Nifty will flat or slightly gap up open.Look the chart and plan trade accordingly .
Buy above 5860 only day high.
Sell below only 15770.
Short


ETH looks to Good to short but at certain level!ETH looks good to short from 1363, either ways one can buy till that point and reverse sell,

Sell nifty for short term Here 20 moving averages going to cross 200 moving averages, here are the chances price will go down.

BELBEL
Picture perfect setup for short Sell
Symmetrical triangle at verge of Break down.
Two ways to play can short now @228 and add more shorts after confirmation.
or wait for break down below triangle.
Stop loss if closing again inside triangle
It's a swing to positional trade for positional targets are big.
Positional Target - 205
Swing Target - 215
#invest @vivek_mashrani @vivek_mashrani @Shorting @forextidings @Tredingview @tradingview_

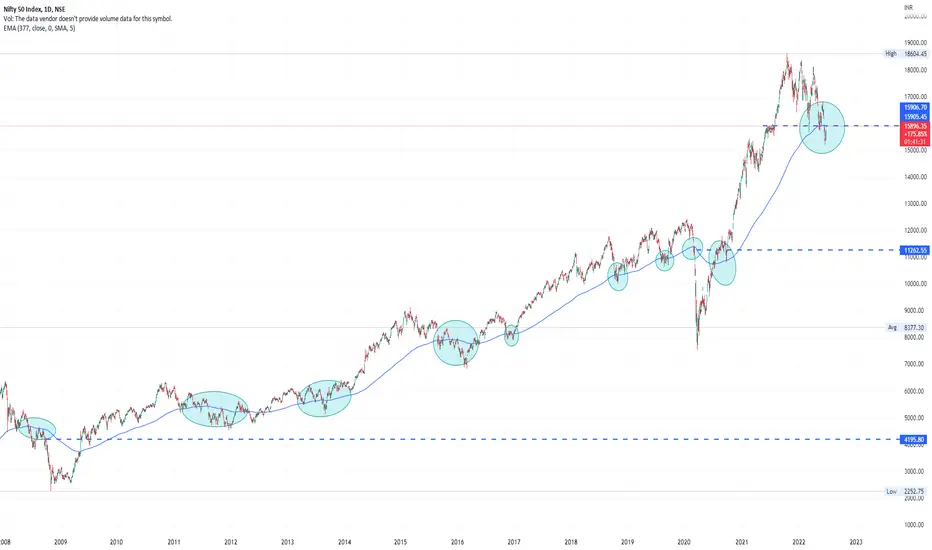
Nifty at 377 EMAHi Everyone
If we look at the daily chart opf Nifty and include 377 EMA then we can see that this is a very strong moving average.
2008 / 2020 crisis happened when this EMA was broken.
Today Nifty is perfectly sitting at this EMA.
It can consolidate or we can now expect a huge fall which has not been witnessed till now. For that it will have to break its previous lows and check my other analysis which tells that Nifty might hit 13000 level by Sep this year.
ETHUSDTSupply and demand pattern formation on ETH on a 4hr timeframe ! Target should be around 1050$ !
🚫Disclaimer:
🔹I'm not an financial analyst! I'm sharing this with public! It just learning purpose only! If u find anything wrong with this post ! U can tell me ⬇️ comments!
🔹incase of Market sudden crash ! This chart is invalid !
Thank you!!!
😊😊😊

Hero news simplifiedHero launched some models in Turkey, and appreciated 8 percent in stock spot price.
However, hero motor export figures are next to nothing. Just about 20000 units.
Move is disproportionate, sell CE (call option) of 2700s toward 2585(200DMA level), and then 2500.
Hero has tried to find solace at 200 DMA, in recent times.
Hero stock price is expensive, given this market. Not to mention prices of several other auto nifty movers as well.
In other news, Hero is going to raise it's two-wheeler prices by (upto) 3,000/- next month.
Increasing product price gives hero less of a price edge over other competitors. Keep in mind Hero sale figures are still lower than pre-covid levels (66% sale figures, or two-months-out-of-three in this quarter are out already—and sales are below pre-covid levels).
Demand is down.
Hero can rest at 2500, 2350 could be considered a buy price.

My view on SBIN for next week Hi,
This is my first post and I am posting it for educational purposes. This is an idea based on trendlines, please comment and guide if this is incorrect. It looks like SBIN is a good candidate for shorting with a target of 410.
Thank you!

SGX NIFTY Analysis - Learning SGX NIFTY formed double top with bearish candle (may be bearish harami) with divergence.
Watch on Monday for divergence and confirmation for short sell.
No confirmation, no short sell.

Tata Shooting Star H1 - Learning In 1H time frame shooting Star pattern formed.
Watch for divergence.
Short sell.

CGCL - BO on either sideCGCL :
Currently in tight consolidation - Add to watchlist and wait for a breakout.
Look for breakout - on either direction.
Please spend some time on own research before investing.

Reliance - can the weakness continue? After the falling wedge breakout I posted earlier
Will reliance take support on the trend-line or break it?
Will it take nifty to lower levels along with it.
Can be weak after a close below 2400
Stay tuned

TITAN short(W)Following the 4 stages of the cycle, Titan seems to be entering the fourth stage of the cycle. A clear break down the trend line provides confirmation on the weekly time frame.

SGX NIFTY Analysis - Learning Double top + Shooting Star + Negative Divergence
Triple confirmation for selling.

SHORT SBI (W) SBIN, looks like it is entering the mark-down phase after forming the triple top pattern.

BANK NIFTY ------- A BIG DOWNFALL COMING ?This is a daily chart of bank nifty.
It has formed an ASCENDING TRIANGLE and has given breakout.
It will be in green for some days coz it's going for a retest and after that the indice will fall rapidly.
This can be a really good time to short Bank Nifty.
*NOTICE*
I AM NOT SEBI REGISTERED.
I WILL NOT BE RESPONSIBLE FOR ANY OF YOUR LOSSES.
IT'S JUST MY OWN PREDICTION.

Bearish Flag PatternBearish Flag Pattern Forming In NIFTY50
A bear flag is a technical pattern that provides an extension/continuation to an existing downward trend. The bear flag formation is underlined from an initial strong directional move down, followed by a consolidation channel in an upwards direction (see image below). The strong move down is known as the ‘flagpole’ whilst the consolidation is referred to as the ‘flag’ itself.
Bear flag formation summary
Preceding downtrend (flag pole)
Identify upward sloping consolidation (bear flag)
If the retracement becomes higher than 50%, it may not be a flag pattern. Ideally, we’ll see the retracement be less than 38%
Enter at top of the flag or on a breakout below the low of the lower channel
Look for prices to break lower with a length equal to the size of the flag pole

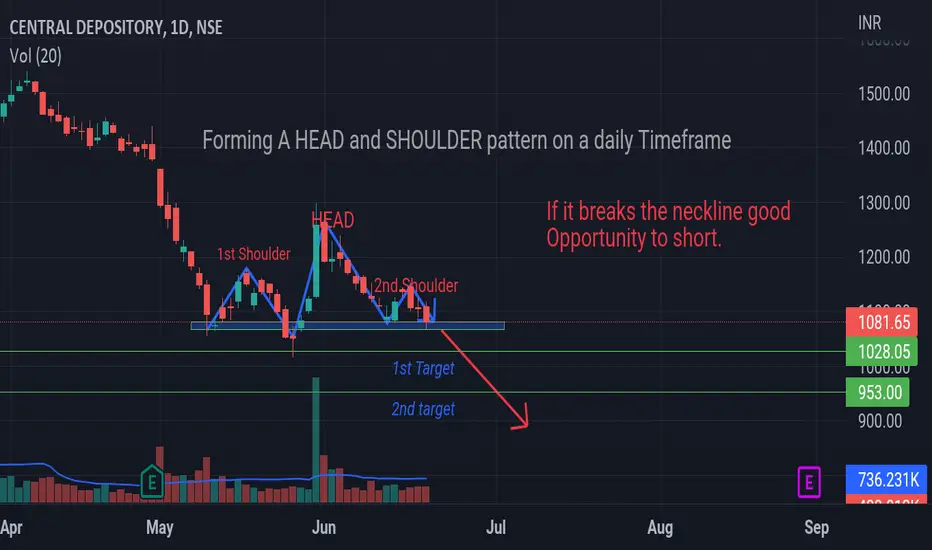
CDSL --- A PERFECT TIME TO SHORTThis is the daily chart of CDSL i.e Central Depository.
Currently it has made a price action pattern i.e HEAD AND SHOULDER
If it breaks it's neckline, it will be a perfect entry with a small stoploss and a target of roughly ₹50.
*NOTICE*
I AM NOT SEBI REGISTERED.
I WILL NOT BE RESPONSIBLE FOR YOUR LOSSES
Vedl for shortingWe saw a massive fall in vedl. it’s not over..
I already gave a analysis for short vedl from level of 400 for target until 300. Which is completed.
Now vedl consolidating at a support of 300.
If it breaks 280 we can short futures of vedl for target of 250 -220 with 10 rs sl.

TATA POWER#TATAPOWER
Time to short this one now great levels to gain huge profits.
Energy sector showing weakness after a great really.
TATA power at crucial Support levels.
Short below 204.
Stop loss 208
Targets
1st - 185
2nd - 170
3rd - 140.
Strong conviction.
#short #sell @Equities
@tradingview_ @vivek_mashrani @Shorting @forextidings @Tredingview

Petronet - Bearish - next Support AnalysisPetronet - Bearish - next Support Analysis
1. Breaks the primary trend, tried a lot of attempts to break the trend upwards... but due to negative trend, it came down.
2. next support at 190 and another at 180.
3. Strong down candle was created last week, due to this mostly next also will be negative for this stock.
3. I hope it won't break the 2020 crash low.
Note:
1. I’m not a SEBI Registered advisor, my research is personal and for educational purposes only.
2. Always check with your financial advisor and take the trade as per your risk/reward ratio.
3. Follow me for more patterns and like, and share so that we feel it is helpful to many and share more patterns...

"HDFC BANK"HDFC Bank corrected 25% from its all-time high, Now it's trading below 1300 level it can fall further 10% to 15% more, this is the best time to start SIP in HDFC Bank
