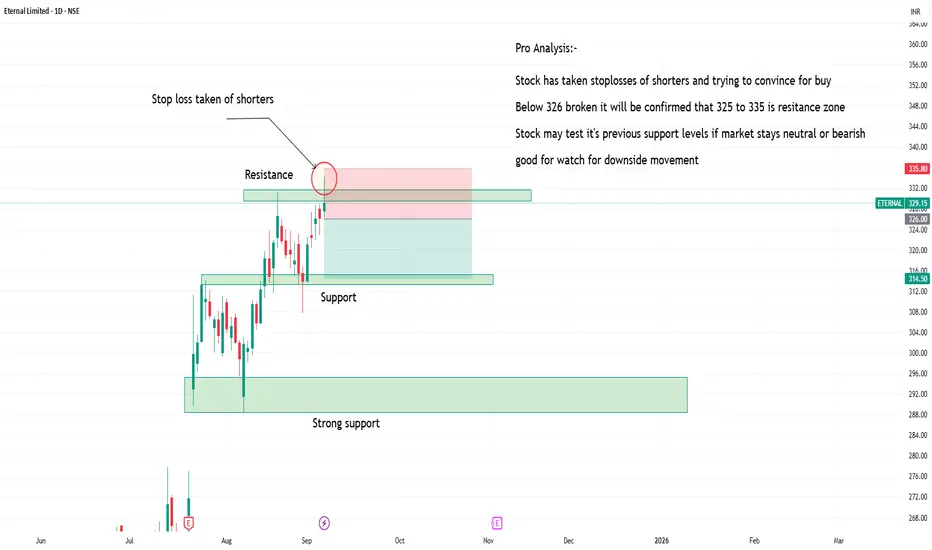
Zomato creating it's resistance zoneZomato is testing it's resistance zone.
one can watch for downside movement with stop losses above recent swing with targets of 215 levels.
it's pure price action.
stock may go in consolidate in zone for long time.
Shortsell
#Nifty may see fall on Monday?Nifty appears to be in its minuette wave 4 and may resume its downtrend move on September 1 to complete wave 5.

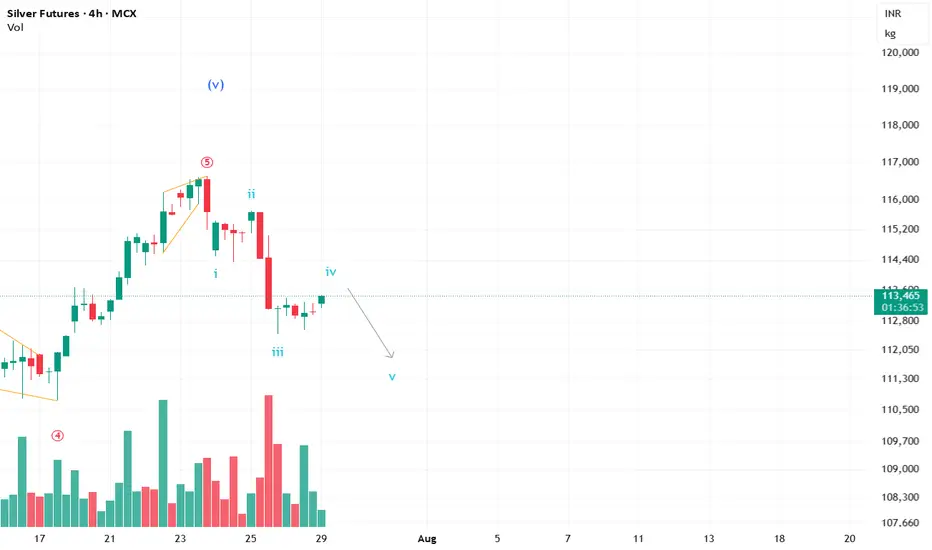
#Silver up for another short sell move?Silver is currently completing the 4th wave and may witness a down move in the short term. Keeping my eyes glued. :)
**This is an educational market outlook, not investment advice. Please consult a SEBI-registered advisor before taking any investment decisions.**
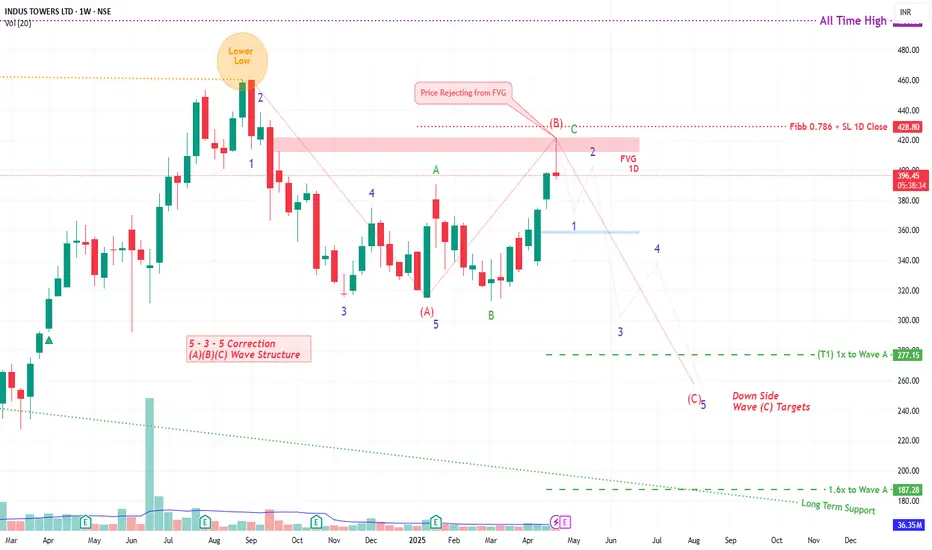
INDUS TOWER By KRS Charts25th April 2025 / 9:40 AM
Why INDUSTOWER??
1. Stock was reached its near ATH level but not able to hold the levels in Sep 2024 . From this point to today it seems like bullishness is getting weaker.
2. Wave Theory is saying Correction Wave ABC is ongoing and C is likely Started .
3. In support of more Correction from here FVG is visible in 1D TF and price are rejected from that level too.
4. Expecting correction from here in 5 Wave Structure towards downside.
Expected Targets and SL are mentioned in Chart
Note: This is Medium to Long Term View
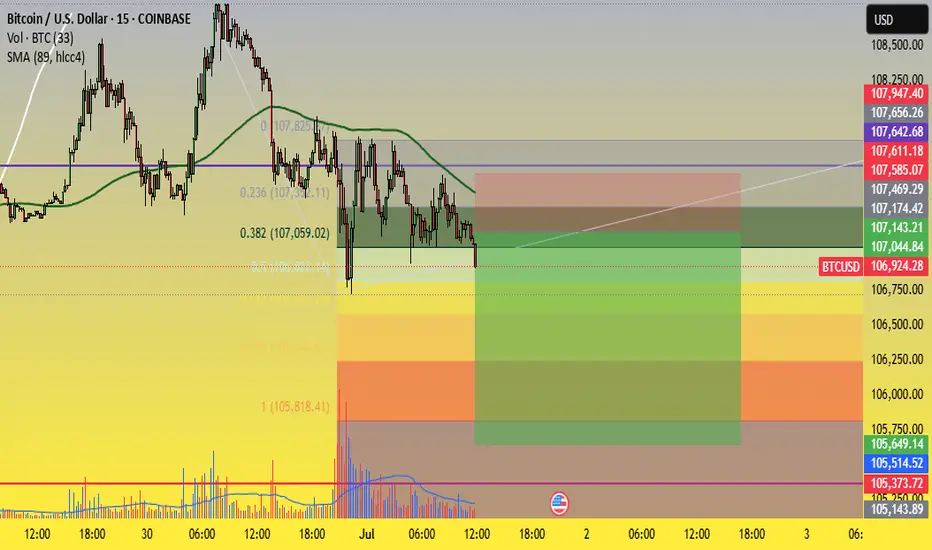
BTCUSD SELL Recommendation – 15-Minute Chart (M15)Sell on short-term downtrend continuation after a technical pullback near resistance and Fibonacci levels.
🎯 Trade Setup:
Sell Zone: 107,000 – 107,200
Stop Loss (SL): 107,650 – 107,850 (above resistance + Fib 23.6% zone)
Take Profit (TP): 105,500 – 105,700
Risk:Reward Ratio: Approx. 1:2 to 1:2.5 – suitable for short-term scalping/swing
📊 Technical Analysis:
1. Fibonacci & Resistance Confluence:
Price is reacting to the Fibonacci 0.382 level (107,059) – a common retracement level in downtrends.
The zone 107,000 – 107,200 overlaps with historical resistance and previously rejected candles → indicating distribution.
2. Moving Average (MA) Pressure:
Price is trading below the MA, and recent pullbacks failed to break above it.
The most recent bounce was rejected around 107,200, suggesting bearish pressure remains.
3. Volume Analysis:
Volume declined on the pullback, showing weak buying momentum.
Meanwhile, the recent drop came with a high-volume bearish candle → sellers are in control.
4. Target Zone – Support Area:
105,500 – 105,700 is a previous swing low and aligns with the Fibonacci 0.618 – 0.786 zone, making it a strong potential bounce area.
This is a reasonable target before the market decides its next direction.
⚠️ Risk Management Notes:
Look for bearish reversal candlestick patterns (e.g., pin bar, bearish engulfing) in the entry zone for confirmation.
If BTC closes strongly above 107,650, consider the short setup invalidated.
Fl me and trading with me! fl Ytb....
XAU/USD Technical Analysis – 4H Chart Overview🔍 Current Market Position
Price: $3,358.125
Currently near resistance zone ($3,420–$3,470)
Historical reaction in this zone shows multiple rejections 🛑
📌 Key Levels
🔺 Resistance Point: ~$3,420–$3,470
Rejected here 3 times ➡️ strong supply zone
🔻 Support Level: ~$3,150
Past price bounced here multiple times 🟠
💪 Strong Support: ~$2,950
Major bounce seen in early May 👊
🧭 Pattern Outlook
Repeated resistance test 🔁 ➡️ potential double/triple top
📉 Blue arrow suggests bearish projection towards $3,050–$2,950
If support at $3,150 fails 🔓, expect deeper drop to strong support
🔮 Forecast
🔽 Bearish Bias
High chance of reversal from resistance
Target: $3,050 and possibly $2,950 🎯
⚠️ Watch for
Price Action at Resistance: Rejection = short opportunity 🔧
Break of $3,150 Support: May accelerate bearish move 🧨
📌 Summary:
Market shows clear resistance rejection history. If it plays out again, we may see a strong drop toward lower support zones. Ideal for short setups 📉💼

"EUR/AUD Bearish Channel with Key Support Ahead"📉 Market Structure Analysis (Bearish Bias)
Current Trend:
The pair is trading within a well-defined descending channel, indicating a bearish trend. Price action is forming lower highs and lower lows, adhering to the channel boundaries.
Moving Averages (EMA):
EMA 50 (Red) at 1.77491 is above the price, acting as dynamic resistance.
EMA 200 (Blue) at 1.73338 is close to current price, likely to act as a support area in the short term.
The bearish crossover between the 50 EMA and current price supports the continuation of downward momentum.
🔍 Key Zones:
Weak Resistance Zone:
Located around 1.7740 – 1.8000, previously a support area, now acting as resistance.
Price rejection from this zone multiple times indicates sellers' strength.
Support Zone:
Located around 1.6950 – 1.7100, where demand may return.
This zone coincides with the lower boundary of the descending channel, making it a likely reaction zone.
📊 Forecast / Expectation:
The chart projects a bear flag / corrective pullback before another leg downward toward the support zone.
If price breaks and sustains below the EMA 200, it will likely accelerate bearish pressure.
The descending channel suggests potential continuation to the downside unless price breaks out of the upper boundary with momentum.
✅ Trade Implications:
Bearish Setup:
Look for short opportunities on intraday pullbacks near the resistance or EMA 50.
Bullish Invalidations:
A breakout above the descending channel and sustained move above 1.7800 would invalidate the bearish outlook.
Conclusion:
This chart presents a technically clean bearish setup. The confluence of a descending channel, EMA rejection, and defined resistance/support zones suggests the EUR/AUD may continue lower, especially if it loses the 1.7300 level decisively.

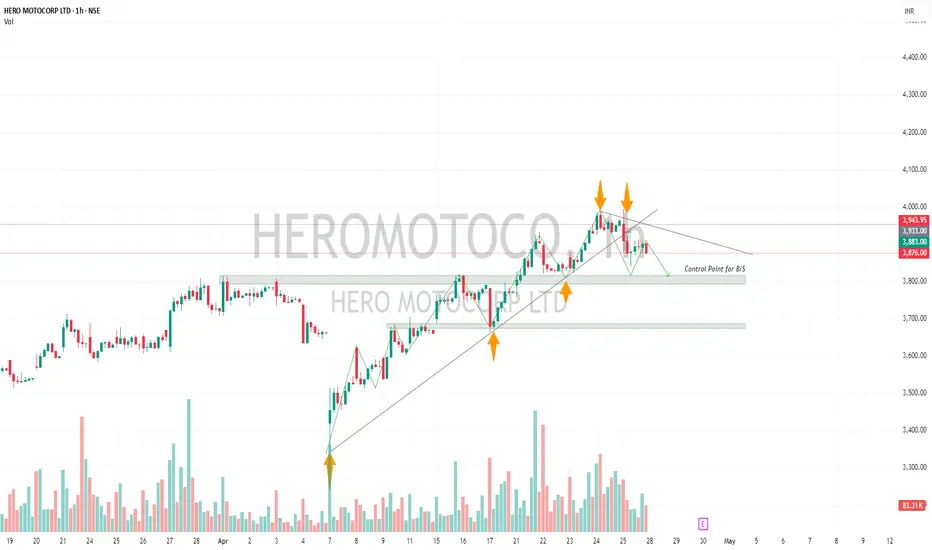
HEROMOTOCO-Positional Short Trade Stock upside taking support from trendline. Friday's session 25'th April The stock has shown weakness potential trend reversal.
There are two possibilities:
1)Head and Shoulder Pattern
2)Descending Tringle Pattern
For both the possibilities it the neckline/Support zone 3800 needs to break. If that happens it may test 3680.
If opens gap up Above 3960 Avoid!
Please don't forget click on follow button so you won't miss any upcoming ideas.
Any confusion, feel free to drop msg. Happy to help :)
This is only for educational purpose, please manage your risk accordingly.
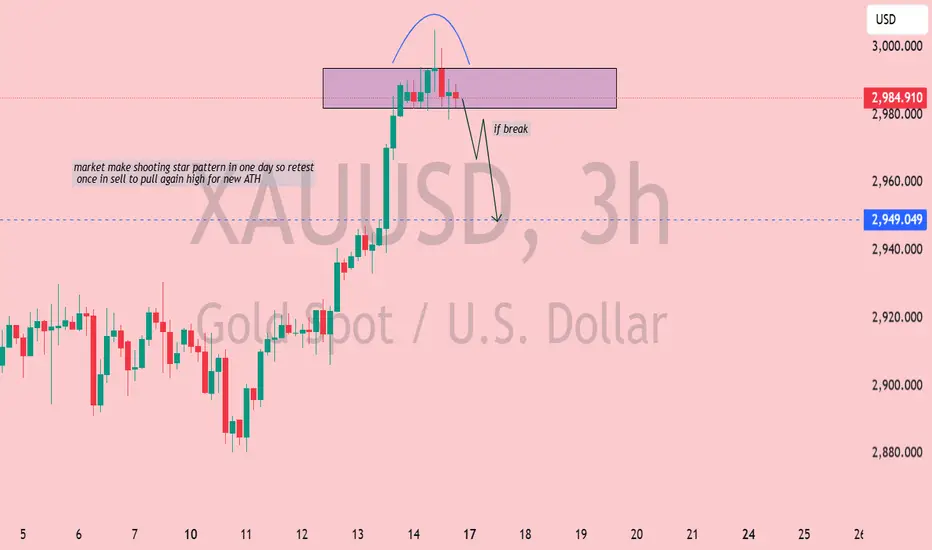
XAUUSD Analysis: Bearish Reversal with Potential for Liquidity📉 XAUUSD (Gold Spot vs USD) Analysis - 3H Chart
🌟 Shooting Star Pattern Detected: The market has formed a shooting star, a bearish reversal candlestick, signaling potential weakness at the top.
📍 Key Resistance Zone (Purple Box): Price action has been rejected from this area, showing strong selling pressure.
🔍 If Break Scenario: Should the price break below the 2,949 support zone (🔵), we can expect a bearish drop 📉 with potential liquidity grab before a pullback for a new all-time high (ATH) 🚀.
🧐 Market Sentiment: Bearish bias for now, but watch for a potential reversal after liquidity is swept.
✅ Trader's Tip: Wait for a clean break and retest before entering a short position. 🎯
NZD/JPY Bearish Breakdown | More Downside Ahead?📉 NZD/JPY Technical Analysis (Daily Chart)
Key Observations:
Downtrend Dominance ⬇️: The pair has been in a clear downtrend since mid-2024, with lower highs and lower lows forming consistently.
200 EMA Resistance 🚨: The red 200-day EMA at 90.088 is acting as a major resistance level, reinforcing the bearish outlook.
Bearish Breakout Pattern ⚠️: A descending structure is forming, suggesting a continuation of the downtrend.
Projected Drop 📉: The black arrow on the chart indicates a potential drop toward 82.00 - 80.00 levels in the coming weeks.
Trading Strategy:
🔴 Bearish Bias: Traders might look for short opportunities on lower highs, especially near 87.00 - 88.00 resistance.
✅ Target Zones: 84.00 (first support) and 80.00 (major support).
🚨 Invalidation Level: A break above 90.00 (above 200 EMA) could signal trend reversal.
What’s your trade plan? 🎯📊

Short sell position for Indusind bankThe indusind bank stock follow the downside channel pattern, as per current situation, it is a good time to enter short sell in future or buy PE in option.

OPPORTUNITY IN DR REDDYI saw shooting star in drreddy on daily time frame . we have a good opportunity to short dr reddy . if the stock cross 5805 level on next trading session, we will be searching short position 15 min or 30 mint time frame in the stock .

GOLD 26/6 $$ The bears are still dominant ?Friday’s rebound in gold prices came on the back of diminishing open interest and suggests that the continuation of the rebound appears unlikely for the time being. In the meantime, the yellow metal remains bolstered by the $1910 per troy ounce for the time being.
Today, Gold price still stays at $1920 - $1930
Can SELL zone at
SELL GOLD $1931- $1934, Sl 1944
According to technical analysis, the support zone $1910 support is quite strong, combine 2 moving averages EMA 34, EMA 89 so that the downtrend project still prevails.

intraday trading setup for Monday apollo in hosptriangle pattern consolidation in apollo hospital
keep it on watch list
most of chances to break demand zone and then wait for retest trend line again,
then go for sell side or put side
if it breaks trend line up side then go for buy side


gsfc technical study The technical chart of the counter is trading with negative bias and it needs a successful close above marked areas once done can give a successful trend on higher side with lower levels which is swing low as stop loss

MGLHi guys, In this chart i Drew My Best Levels in MGL for Short, Observed these Levels based on price action and Demand & Supply. Don't Take any trades based on this chart/Post...because this chart is for educational purpose only not for Buy or Sell Recommendation.. Thank Q

SOLARINDS Inverted Hammer is form near resistance area. Inverted Hammer is form near resistance in SOLARINDS. if on daily timeframe red candle is form in next trading session then this stock will be more bearish in upcoming days. if it will break the resistance zone and sustain above then only thinking for buying this stock for swing trading. as of now looking bearing.

Neutral View On BANKNIFTY Hello Guys
BANKNIFY is In Range Bound
If BANKNIFY Breaks 41520 Then Buy First Target 41575
Second Target 41650 Third Target 41695
If BANK NIFTY Not Closed Above 41480 And Closes Below 41390 Then Go Short First Target 41215 Second Target 41130 Third Target 41015 If BANKNIFY Breaks 41015 Then It Will Fall Upto 40955
Hope The Best Happy Trading And Protect Your Capital
DISCLAIMER :-
Iam Not A SEBI Registered Analyst
If You Take Any Position Consultant Your Financial Advisor

Balkrishna Ind can go downAs Per Elliott wave theory NSE:BALKRISIND looks bearish for short time, formed channel in wave C expecting minute Wave 5 will reach till fibo ratio 0.786 or 1688, and possibly reverse. if price goes beyond the invalid line or breaks channel upward then markings need to recheck.
Risk management is Imp, use stop loss, Happy trading.

Bearish View On SGX NIFTY Do Short Sell If SGX NIFTY Breaks 17725
Go Long If SGX NIFTY Breaks 17830
Major Resistance is At 17880
Major Support is At 17540
Volatility is Very High
So Don't Do Naked Positions Do Hedge And With Strict Stop Loss Safe Your Capital
Wish You A Happy Diwali And Safe Diwali Guys
Happy Trading
• DISCLAIMER :-
• Iam Not A SEBI Registered Analyst
• If You Take Any Position Consultant Your Financial Advisor

Bearish View On SGX Nifty SGX Nifty Trading Negative Side As Per Price Action
SGX Nifty Immediate Resistance is @16982
Second Resistance is @17053
If SGX NIFTY Crosses Above @17053 Then It Will Turn Bullish For Tomorrow Only
SGX Nifty Support is @16025 SGX Nifty Breaks Today's Low @16011 Then It Will Fall Upto @16861 Then It Will Consolidate For Some Time Then It Will Breaks Towards Down Side So You Need To Do Short Sell Don't Buy Call Options On Bear 🐻 Market But Put Options And Sell Call Options It Will Gives More Profit
• DISCLAIMER :-
• Iam Not A SEBI Registered Analyst
• If You Take Any Position Consultant Your Financial Advisor

Analysis For Next WeekAnalysis For Next Week
SGX Nifty is Consolidating From Today's Evening Session
If SGX Nifty Is Breaks @17340 {And} @17430 Then It Will Move Higher If SGX Nifty Breaks @17200 Then It Will Free Fall Upto @16800 Then You Blindly Do Short Sell With Small STOPLOSS
Don't Buy Call Options Sell Call Options And Buy Put Options
SGX Immediate Resistance @17380 And @17430 If SGX Nifty Breaks @17430 Then It Will Upto @17646
SGX Nifty Immediate Support @17290 If SGX Nifty Breaks @17200 Then It Will Fall Upto @16800
If SGX Nifty Breaks Major Support @17200 Then It Will Fall Upto @16800
• DISCLAIMER :-
• Iam Not A SEBI Registered Analyst
• If You Take Any Position Consultant Your Financial Advisor
