PAYTM KARO ONE97 COMMUNICATIONS NSE:PAYTM
Paytm karo varna stock ko niche karo 😅😅
Paytm take strong resistance from his major resistance and also do classical pattern consolidation after breaking down that is double confirmation for trend direction.
now, 1000 is major support
this is not a any types of advice.
this is just chart analysis
do your own research
Shortsetup

Gold Hits Resistance Inside Rising Channel | Short-Term PullbackHello Everyone, i hope u all will be doing good in your life and your trading as well, let;s analyise Gold as it is trading inside a rising channel, but price is currently facing strong resistance near the channel top. The recent move shows signs of rejection, which opens the door for a short-term pullback, not a trend reversal.
This is a counter-trend short focused only on a corrective move. As long as price stays below the marked resistance zone, selling pressure can continue toward lower channel support. Buyers are still in control on higher timeframes, so shorts should remain quick and disciplined.
Key Levels
Short Zone: Near channel resistance
Pullback Targets: 4625 → 4610 → 4597
Invalidation: Above 4660
Disclaimer This analysis is for educational purposes only and should not be considered as financial advice. Trading involves risk. Please do your own research and use proper risk management before taking any trade.
Analysis By @TraderRahulPal | More analysis & educational content on my profile.
If this update helped, like and follow for regular updates.

XAUUSD | 15M | Channel Resistance Rejection – Short SetupGold price is trading inside a well-defined ascending channel. Price has now reached the upper channel resistance, aligning with a previous intraday high / supply zone, where selling pressure is visible.
A rejection from this area suggests a potential short-term bearish move, with price likely to rotate back toward the mid / lower channel support.
Technical Structure
Overall structure: Ascending channel
Entry zone: Upper channel resistance
Confirmation: Rejection wicks + loss of momentum
Bias: Short / Pullback trade
Trade Idea
Sell near resistance after confirmation
Stop-loss above channel high
Targets toward channel support / demand area
This setup is based purely on price action and market structure.
Wait for proper confirmation before entering.
⚠️ Not financial advice. Manage risk accordingly.

BSE- Correction phase startsAfter more than 2000% rally in 2 years, BSE finally formed a double top pattern in monthly. The target for this pattern is 1241 which is the confluence of fib 0.618 + Monthly support + blue channel support.
Note: This is for educational purpose and not a trade recommendation.

BTC at Major Resistance | Short Opportunity Near 90K ZoneBitcoin (BTCUSD) is approaching a key resistance zone between 89,900 – 90,600, an area where price has a higher probability of facing selling pressure.
📌 Trade Idea (Short Setup):
Instrument: BTCUSD
Sell Zone: 89,900 – 90,600
Target Area: 88,500 – 88,000
This zone may act as a supply area, where bears could step in to defend higher prices. Rejection signals or weakness near resistance could offer a favorable risk-to-reward short opportunity.
⚠️ Always wait for confirmation and manage risk wisely.
📌 Disclaimer:
This analysis is for educational purposes only and is not financial advice. Always manage risk and follow your trading plan.
Your feedback drives our content and keeps everyone trading smarter. Let’s make those pips together! 🚀
Happy Trading,
– The InvestPro Team

Wheat Analysis – Opportunity DevelopingHi Everyone,
Today, an interesting setup is forming on the wheat market.
On the daily timeframe, price is making a third pullback on the bearish trendline, following two previous retests clearly visible on the chart.
Historically, a third pullback on this type of structure significantly increases the probability of a bearish reversal.
📉 Primary scenario: bearish movement expected in the coming days
🎯 Target price: 500

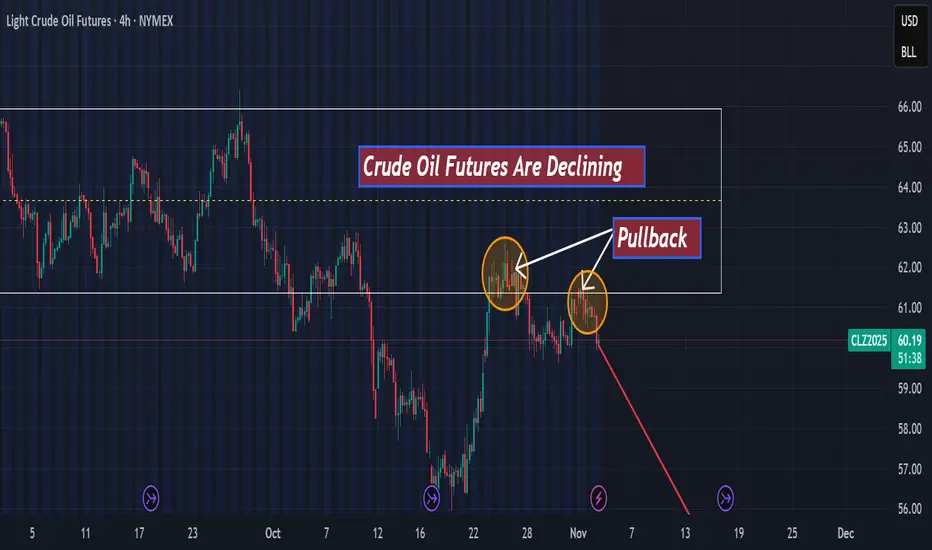
Light Cude Oil Futures are declining hello,
According to my technical analysis, there is a high probability of a decline toward $55 in the next few days for two main reasons:
-A first Pullback on the support level.
-A second pullback retesting that support.
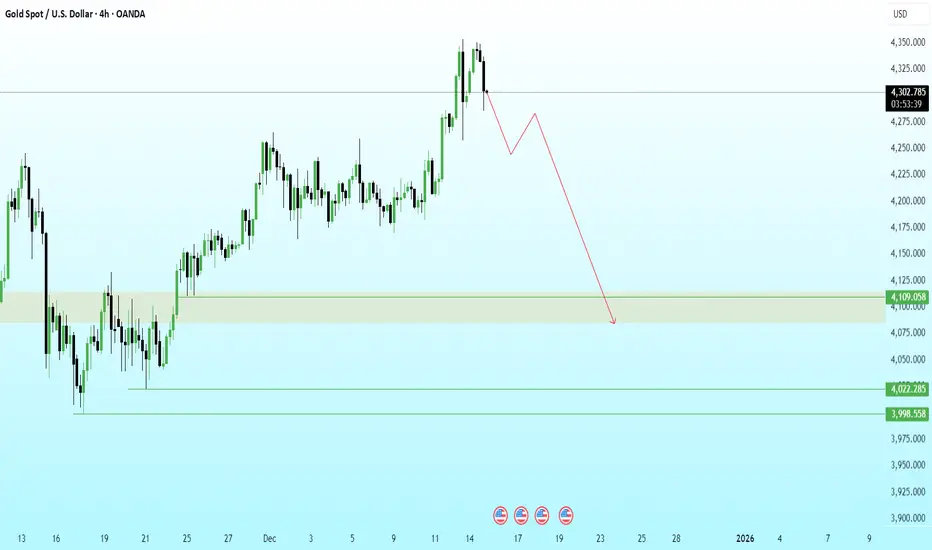
GOLD 4H | Liquidity Harvest Done… Now the Slide BeginsPrice engineered liquidity above the previous swing high and immediately delivered a sharp rejection, confirming a buy-side liquidity grab and the start of distribution.
Structure has now shifted bearish with a clear BOS from the premium zone. I’m expecting a mitigation leg before continuation lower.
The draw on liquidity sits inside the 4100–4080 demand imbalance, which aligns with unmitigated bullish orders from the prior accumulation phase.
If 4100 fails to hold on mitigation, the next liquidity pools rest at:
4022 (clean sell-side pocket)
3998 (final downside liquidity target)
LINKUSDT – Trendline Rejection Short Setup (1H)Price has tapped the major descending trendline and is showing rejection signs.
Market structure is still bearish, and price is reacting exactly at the trendline + previous supply zone.
🔎 Trade Idea
Bias: Short
Reason: Price retests descending trendline → shows rejection → aligns with bearish structure
Entry Zone: Current rejection area
Stop-Loss: Above the trendline + previous swing high
Target: Next liquidity zone / previous demand area
🧠 Why This Setup Makes Sense
Trendline is respected multiple times → strong dynamic resistance
Price failed to break structure convincingly
Clean risk–reward setup
Lower highs still intact
Overall market sentiment is neutral-to-bearish
⚠️ Risk Note
This idea is for educational purposes only.
Market conditions can change quickly—manage your risk carefully.

Possible Decline Toward 113 on T-Bond FuturesAccording to my analysis on the daily chart of T-Bond futures, there is a high probability of a decline toward the 113 level in the coming days.
This bearish outlook is supported by two main technical elements:
-A clear Head and Shoulders reversal pattern, indicating a potential trend change.
-A confirmed breakout, as highlighted on the chart, which strengthens the likelihood of further downward movement.

Gold sell target as per your return you want so im selling this selling gold right away so can get some targets
becuase its pre LDN sell off so taking a 1.5% risk of capital

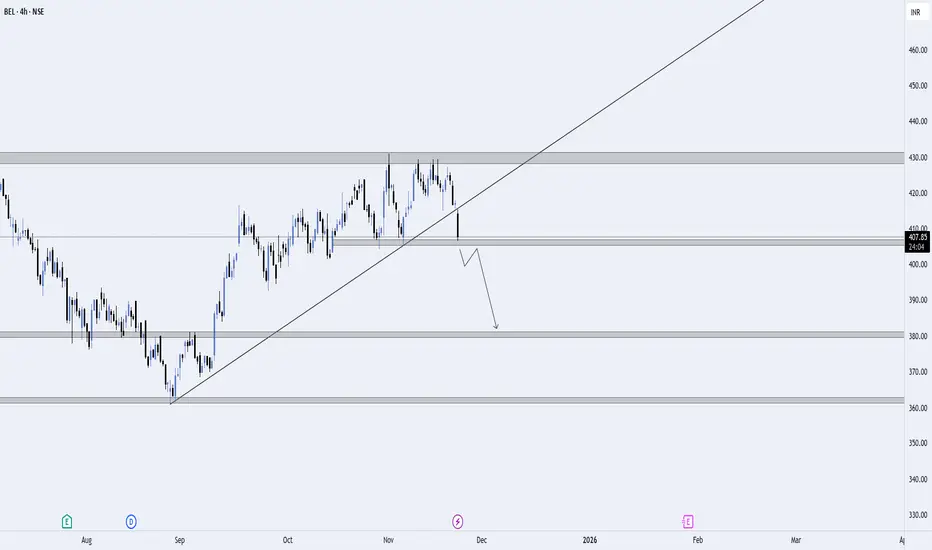
BEL – Trendline Breakdown & Supply Zone Rejection | Bearish SetuBEL has rejected strongly from the higher-timeframe supply zone around ₹425–₹430, followed by a clean trendline breakdown. This breakdown signals weakening bullish momentum and opens the door for a deeper correction.
📌 Key Highlights
Strong rejection from the major supply zone.
Clear trendline break, indicating a shift in structure.
Price currently hovering near ₹408–₹410 support.
Expecting a pullback before continuation.
🎯 Entry Plan (Breakdown + Retest)
🔽 Preferred Entry Model
1. Breakdown:
Price breaks below the minor structure at ₹406–₹408 with a strong bearish candle.
2. Retest:
Wait for price to pull back toward ₹408–₹410 (previous support → now resistance) OR a retest of the broken trendline.
3. Entry Trigger:
Enter short only after a bearish rejection (wick rejections / bearish engulfing / breakdown of retest low).
📍 Ideal Entry Zone:
₹400 – ₹403
🎯 Targets
TP1: ₹395
TP2: ₹382
Final Target (HTF Demand): ₹360 – ₹365
❌ Invalidation
Setup invalid if BEL reclaims ₹425 and sustains above the supply zone.
📈 Bias
Bearish as long as the price stays below the breakdown zone and the trendline.
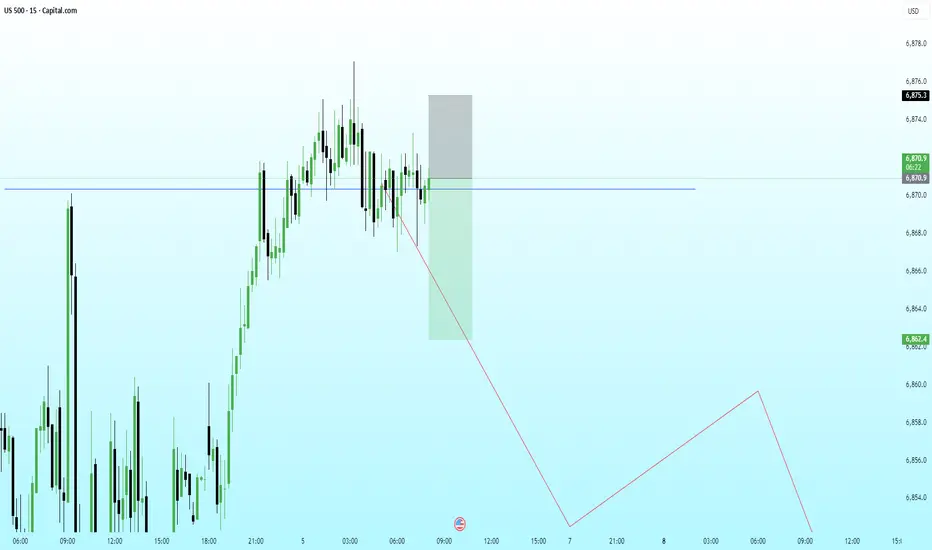
US500 – Clean Retest of Broken Structure With Bearish ContinuatiPrice has retested the broken structure level (blue line) and is now reacting inside a premium zone, suggesting sellers may re-enter the market from this region. The consolidation and repeated rejections indicate absorption of buy-side pressure.
With HTF context still pointing toward a deeper correction, this LTF retest offers a potential distribution setup before a continuation lower toward the next major liquidity pocket.
Bearish Path:
• Retest of the broken structure
• Reaction from premium supply zone
• LTF breakdown and structure shift
• Continuation toward downside liquidity + inefficiencies below
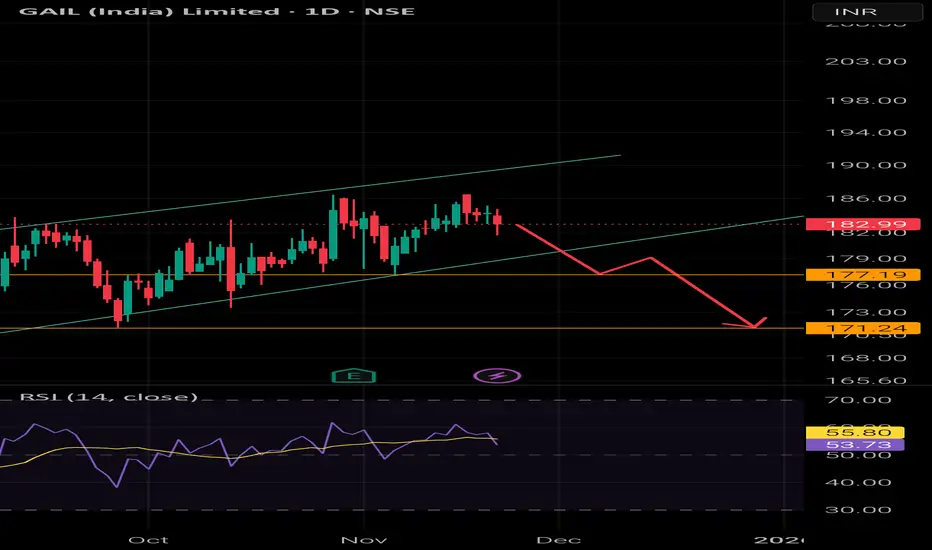
Rising Wedge PatternGAIL is forming a classic Rising Wedge pattern. The immediate targets can be nearest Support. A bearish Strategy can work well in this case
Zcash Formed Triple TopZcash Formed Triple Top And Ready For Breakdown.
But Twist is, 0.38 retracement level. trend still strong
Ready short for setup
Reverse Scenario:
Break That Triple Top High
Any Bullish Pattern breakout in smaller time frame.
🧠 Always DYOR (Do Your Own Research)
⚖️ This is not financial advice or suggestion
👉 “Risk Is Real 💸 Stay Practical🚀”
💬 Please feel free to ask any questions (It's Free)

Consolidation breakdown in eicher motors1. Consolidation range breakdown at top
below 6720 stock will test its Fibonacci support levels
2. stock has given big rally upwards
3. stock may test its fib support levels and the continue upward movement
4. one can watch for swing downside movement with strict targets and sl

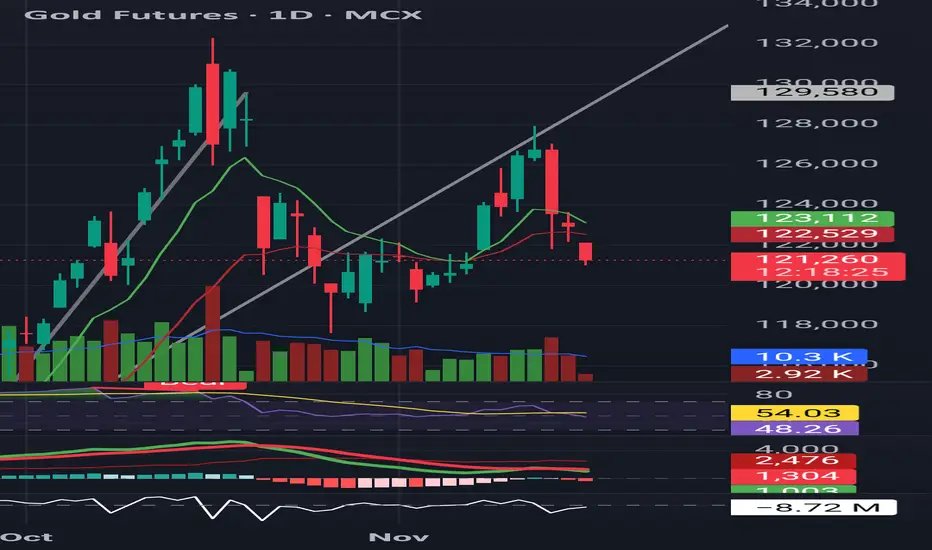
Gold Futures – Bearish Continuation Developing 🟡⬇ Gap-down open = breakdown continuation
Price below 9 EMA and 21 EMA
Evening Star pattern confirmed
RSI falling → momentum weakening
MACD below signal → bearish pressure
📌 Short Setup:
Below 121,800–121,900
🎯 Targets: 117,500 → 116,000
🛑 Stoploss: 123,650
Weak trend until gold closes back above 21 EMA.
GOLD: The Bigger Picture is Finally Getting Clearer !Gold finally showed some clarity after weeks of structure, and now the bigger picture is lining up perfectly across the daily and multi-year weekly charts. The rejection from the 4250–4350 zone triggered the first meaningful retracement after a parabolic rally, and price is now hovering right above the 4030–4060 daily support the only level holding back a much deeper corrective cycle. This entire region is critical because it marks the last breakout base, the liquidity origin, and the midpoint of the 3600-4300 vertical leg. As long as this shelf holds, gold will continue to move in a compressed range, but once a clean daily close breaks below it, the market naturally opens up a fast move toward the 3500–3550 target zone. All confluences measured move, channel midline, point to this same cluster, making it a high-confidence retracement level inside a long-term bullish trend.
On the upside, the structure is very clean. Only a sustained breakout above 4300–4350 invalidates the entire correction and flips the bias back to full-bull mode, where gold can easily run toward 4600–4800 as the next discovery leg. Anything below that zone still falls under the extended correction category, not a bullish continuation. This is why the invalidation level is drawn exactly where it is to protect from guessing the reversal too early.
On the weekly chart, gold has slipped back inside the multi-year ascending channel after briefly wicking above it. That wick was nothing but a classic blow-off extension followed by a reversion to mean. Now price is sitting comfortably inside the same long-term structure . The upper red band remains the multi-year resistance, the green midline is the structural backbone of the trend, and the purple lower band is the deep cycle accumulation zone. As long as gold stays inside this channel, the macro remains strongly bullish and corrections within this structure are normal and healthy. The mid-channel region around 3500 also aligns perfectly with the expected daily correction, which adds even more confirmation that this retracement is simply part of the long-term trend and not a trend reversal.
Commodity index on both daily and weekly frames is cooling off from extreme levels, which supports a deeper pullback rather than an immediate rally. No new bullish divergence has appeared yet, meaning momentum still favors a downside sweep before any major upside continuation. Combine that with the lack of fresh macro drivers and a stabilization in rate-cut expectations, this cooling phase was overdue.
In simple below daily support, gold continues the correction toward 3500-3650 above 4350, the correction thesis dies and the bull trend resumes aggressively. Until then, this is a textbook retracement inside a long-term uptrend nothing broken, nothing unexpected, just a parabolic market taking a breath. Trade safe !

Banknifty facing strong hurdleBanknifty is facing a strong hurdle at 58,000 and is quoting below the pink hurdle trendline. Further downside could be seen in the coming weeks till 56,700. If breaks then a major fall till 54,000 till december won't be surprising given the fact that FIIs usually exit the markets in december leading to a temporary correction.

BTCUSDT SHORT I was sitting in Short after a good bearish candle formed at resistance with very good volume, i just took 1:2 and i was out of the trade.
Logic :- Price was too stretched and bears were gaining control, bulls were trapped
But still the trend is bullish for me, lets see 🚀
Happy profits 🥂 enjoy guys, sorry i didn’t posted this trade earlier
LIKE AND FOLLOW FOR MORE TRADE IDEAS

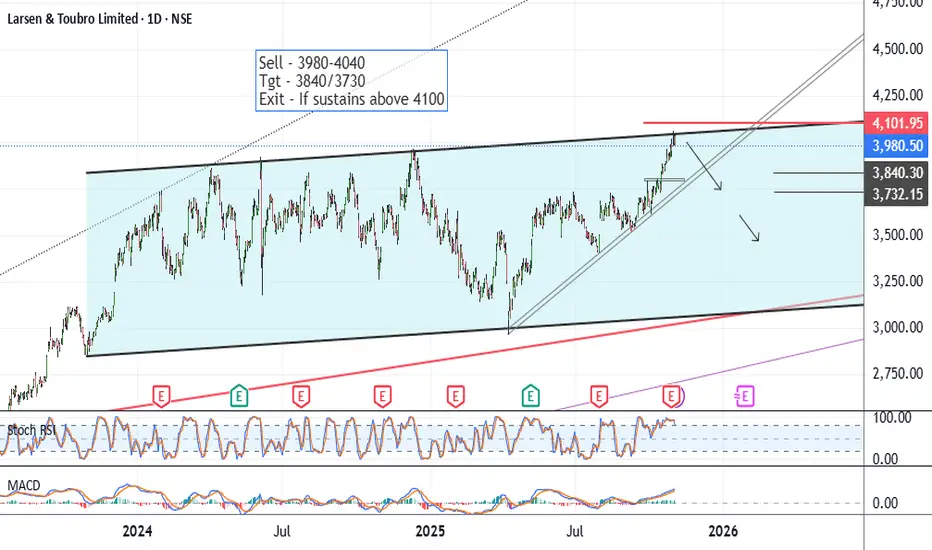
LT - Positional Short SetupCMP 3980 on 04.11.25
In the last 2 years, the stock has been traveling in a rising wedge pattern. At present, it has reached higher levels. If it reverses from these levels, there could be a short opportunity.
All important levels are marked on the chart.
Possible targets may be 3840/3730 or even more downside, depending upon the scenario.
If it sustains above 4100, the exit plan should be exercised.
All the above illustrations and descriptions are for educational and observation purposes only. It is not a buying or selling recommendation.
All the best.
Nasdaq 100 E-mini Futures is declining According to my analysis on the 4-hour timeframe, there is a high probability of a decline in NASDAQ 100 futures toward $250.500 after a breakout from the triangle highlighted on the chart

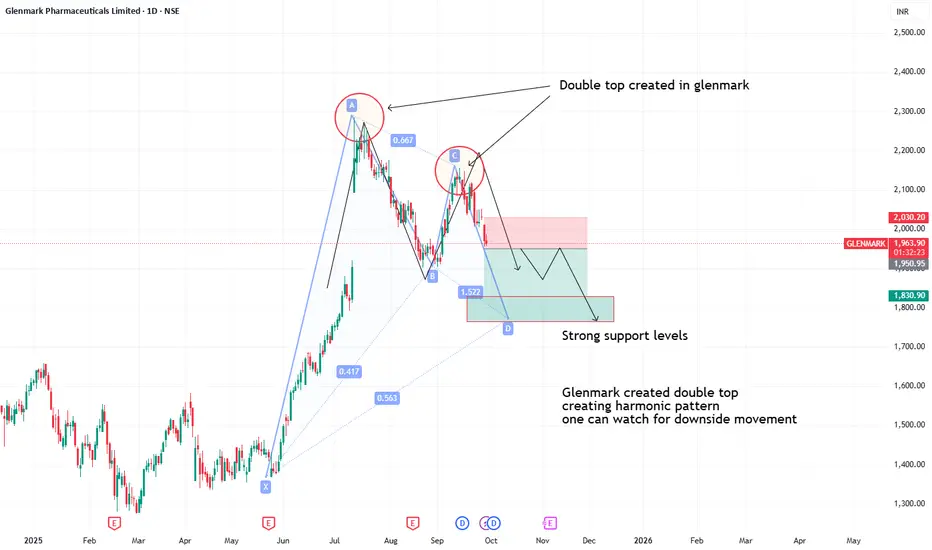
Double top formation seen in glenmark- Glenmark created double top
- creating harmonic pattern
- one can watch for downside movement
- stock may give big move downside if nifty continues to fall