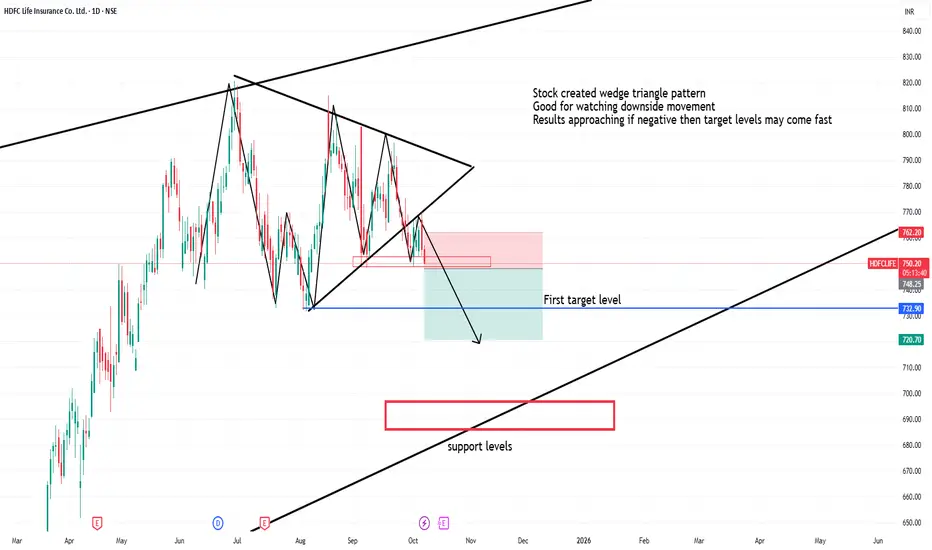
Hdfclife created bearish wedge triangle patternStock created wedge triangle pattern
Good for watching downside movement
Results approaching if negative then target levels may come fast
Shortsetup
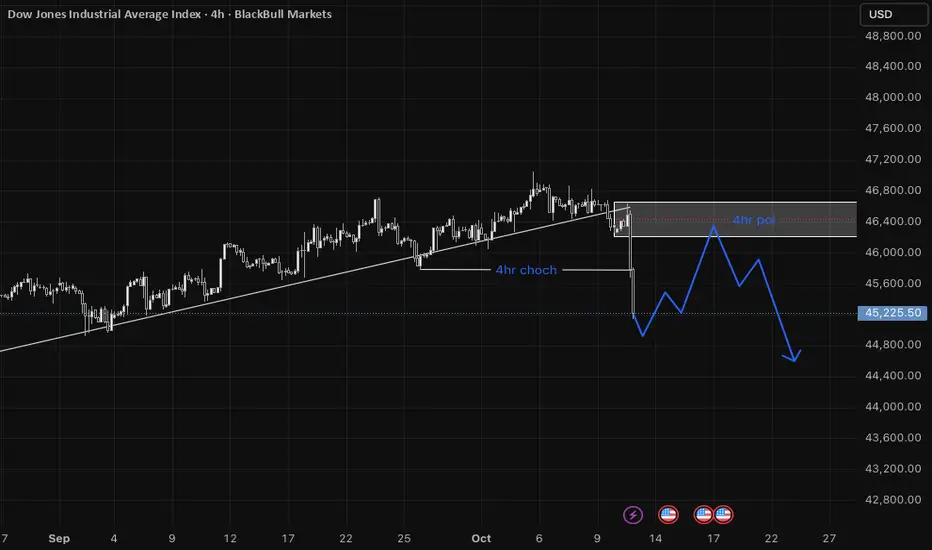
US30 | 4H–15M Bearish Confluence SetupPrice has displayed a Change of Character (ChoCH) on the 4-hour timeframe, breaking the existing bullish trendline and leaving behind a 4H imbalance. This shift indicates potential weakness in the prevailing bullish structure.
I’ll be waiting for price to retrace into the 4H imbalance zone and establish a bearish Change of Character on the 15-minute timeframe, ideally accompanied by the formation of a Fair Value Gap (FVG) or minor imbalance.
Once the 15M imbalance is retested and a bearish candlestick pattern confirms order flow alignment, a short position can be considered after a break below the low of that bearish pattern.
This setup aligns multiple timeframe confluences, reflecting a potential shift in market structure from bullish to bearish.
Bajaj finserv respecting resistance levelsbajfinserv has been returning from its resistance levels showing selling pressure
While nifty shows strentgh
bajfinserv show selling pressure
one can watch for downside movement

BTC/UsDT Short sideHere is a description of the downside scenario as depicted:
1. The Short Entry Point: The short trade is set up to begin at the approximate current price level, which is around $122,000 to $123,000. This suggests a trader is anticipating that the current strong bullish move has reached its peak and a reversal is imminent.
2. The Stop-Loss (Risk):
• The top boundary of the red box, which extends into the red area above the entry, represents the stop-loss level.
• This red area is relatively small compared to the profit target, suggesting a favorable Risk/Reward ratio.
• The stop-loss price appears to be around $126,864.5 (the highest point in the image is $126,864.5). If the price moves above this level, the trade would be closed for a manageable loss.
3. The Take-Profit (Reward/Target):
• The lower boundary of the red box, which extends significantly downwards, represents the take-profit or target area for the short trade.
• The profit target line appears to be around the $108,500 to $108,800 level, which is a key low from late September.
• This is where the trader would expect to close the trade for a profit if the anticipated downside move materializes.
4. The Context: The "downside chart" fundamentally represents a trade where the trader is betting on a significant price decline back toward the prior support levels after the large recent rally.
In summary, the downside chart (the red box) illustrates a hypothetical short position where a trader is risking a small amount of profit from the recent rally to potentially capture a much larger drop in price, targeting the strong support zone established just before the recent V-shaped recovery.
The term "downside chart" in this context refers to the short trade setup that has been drawn on the chart, which is visualized using the large red shaded box.
This setup represents a trader's prediction that the price of BTCUSDT will reverse and fall significantly from its current high.
Here is the breakdown of the downside trade setup:
• Entry Point (Current Price): The trade is initiated for a short position (selling) near the current market price, which is around $122,379.1. This is the belief that the recent powerful rally is exhausted and a reversal is starting.
• Stop-Loss (Risk): The area above the entry point, colored in the brighter red on the chart, represents the Stop-Loss level.
• The stop-loss price appears to be around $126,864.5 (the high shown in the top right).
• This is the level where the trade would be automatically closed to limit the loss if the price continues to rise against the short position.
• Take-Profit (Reward/Target): The large green shaded area below the entry represents the Take-Profit or profit target for the short trade.
• The target price is set significantly lower, near the prior support/lows from late September, likely around the $108,500 to $108,800 range.
• This is where the trader expects to close the short position to realize a profit.
• Risk/Reward Ratio (R:R): By comparing the distance from the entry to the stop-loss (the risk, in red) versus the distance from the entry to the take-profit (the reward, in green), the trade demonstrates a favorable Risk/Reward ratio. The reward (green box) is visually much larger than the risk (top red portion), suggesting the trader is attempting to risk a small amount to potentially gain a large profit.
In summary, the downside chart is the visual representation of a bearish trading strategy, expecting a move down from over $122k to the support area near $108k.

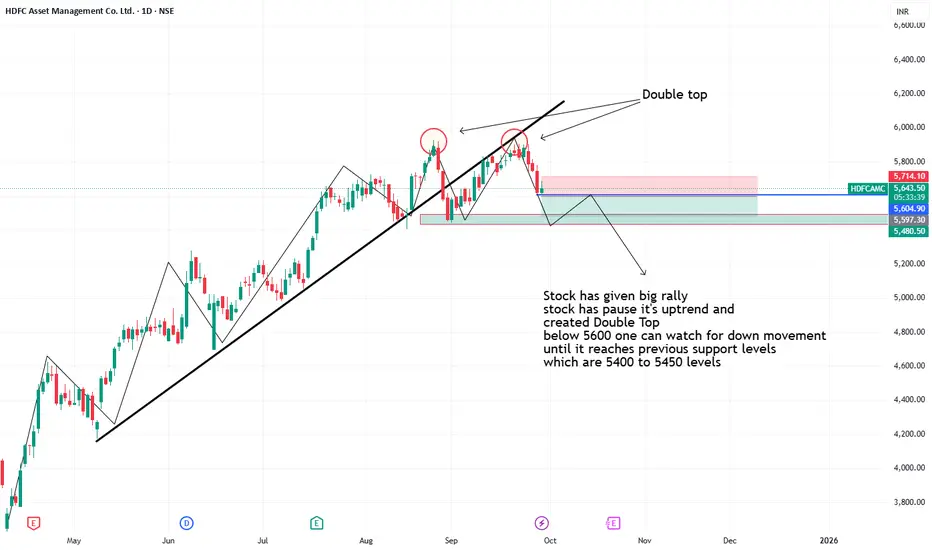
Hdfc created Double Top Formation- Stock has given big rally
- stock has pause it's uptrend and
created Double Top
- below 5600 one can watch for down movement
until it reaches previous support levels
which are 5400 to 5450 levels
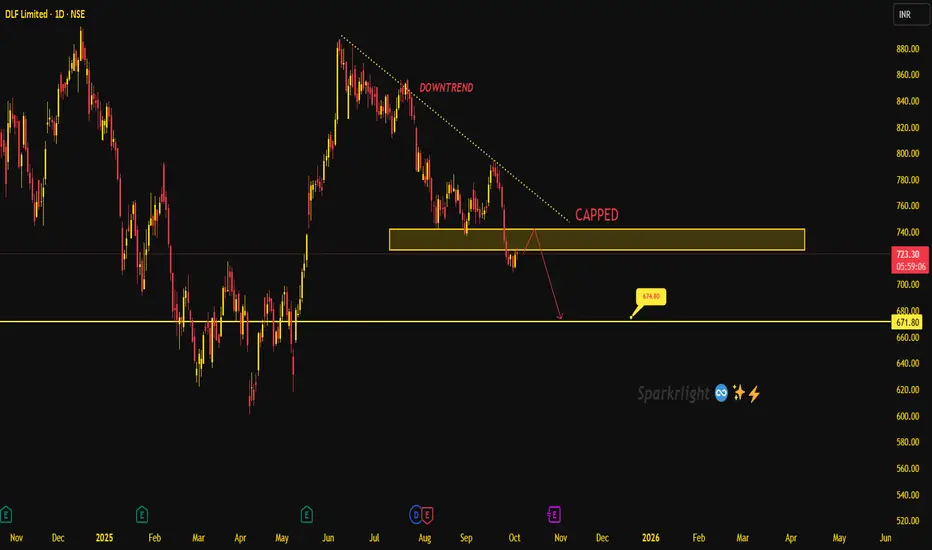
DLF Downtrend Intact – Eyeing 675 Next!DLF is clearly locked in a downtrend, with lower highs forming under the descending trendline. Price is struggling to break above the capped supply zone near 735–740, which continues to act as strong resistance. As long as the stock remains below this zone, the pressure stays on the downside with the next major support seen around 675–672. A break toward this level looks likely in the coming sessions, unless bulls manage to reclaim and sustain above the capped zone, which would temporarily ease the selling pressure. Until then, the structure remains bearish, with sellers holding control. Trade safe !
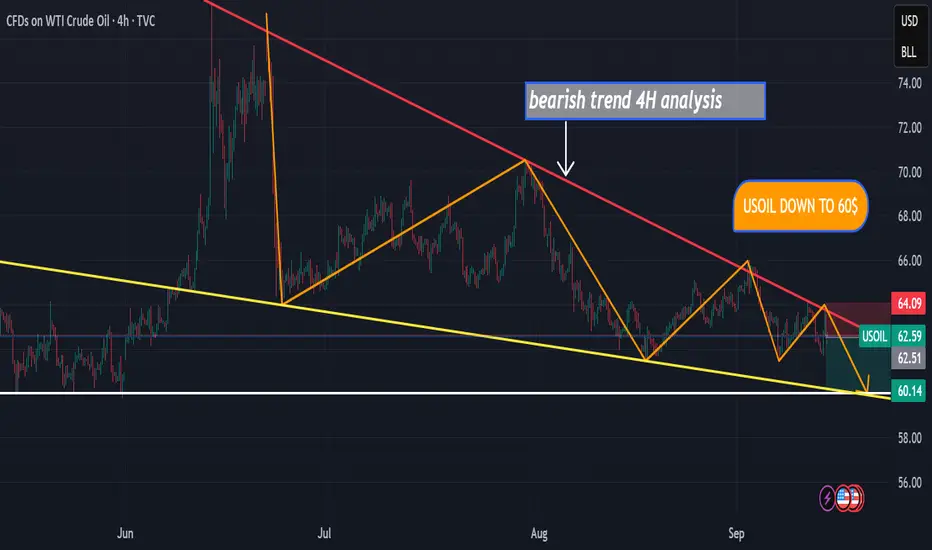
USOIL DOWN TO 60$hello,
I hope you’re doing well. I’ve identified a high-probability short setup on USOIL in the 4H timeframe. The chart is showing a clear downtrend, and based on the current momentum, I expect USOIL to reach the $60 level in the coming days
IBROURI Abdessamad
Supreme industries Short opportunity !!!Supreme industries is looking good for a down move with very nice risk reward ratio...
Nothing much to explain.
Target and SL levels given in the chart
Just sharing my view...not a tip nor advice!!!
Thank you!!!

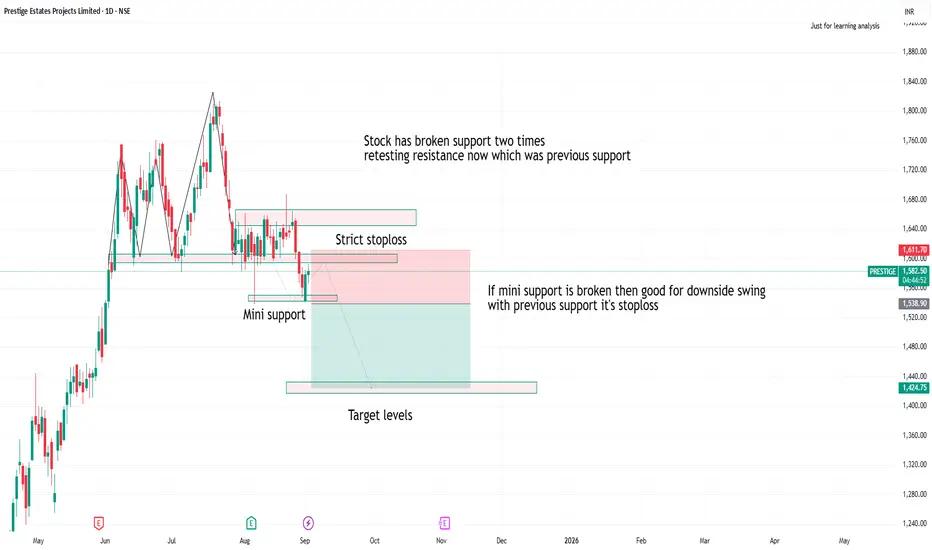
Prestige testing resitanceprestige has broken support second time
if breaks mini support levels good for downside with strict stoploss and targets
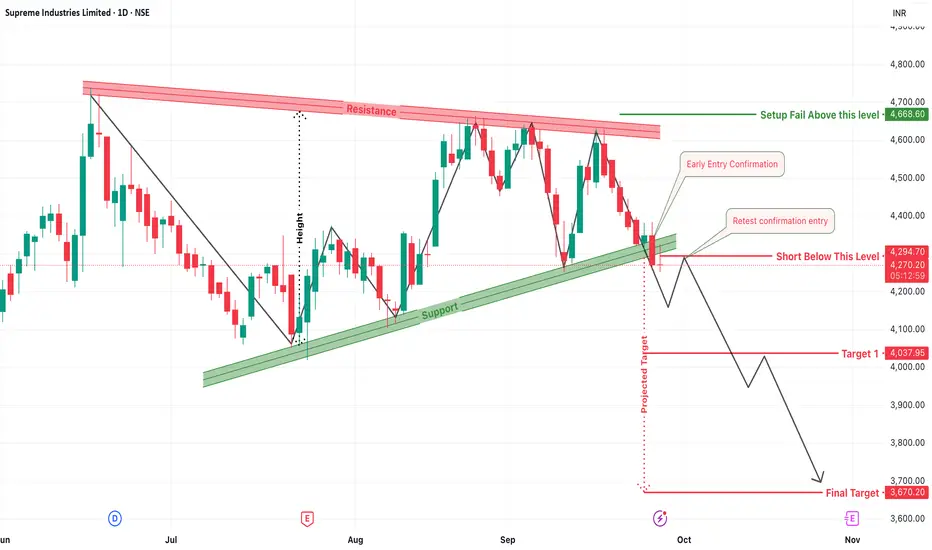
Supreme Industries: Breakdown Below Ascending SupportThe daily chart of Supreme Industries is showcasing a strong bearish signal with a breakdown below a long-held ascending trendline. The structure clearly resembles a descending triangle pattern, and the breakdown confirms growing weakness in price action, favoring sellers in the near term.
1. Bearish Structure Breakdown
The chart shows a clear descending resistance line with a rising support trendline, forming a tight triangle pattern. This kind of setup often indicates building pressure for a breakout, and in this case, it has resulted in a sharp breakdown below ₹4294, signaling the start of a fresh bearish leg.
2. Short Entry Below ₹4294.70
A confirmed breakdown is seen once the price breached below ₹4294.70. This is the ideal short entry trigger zone. Traders looking to enter early may have taken a position right at breakdown, while others may wait for a retest of the broken trendline as confirmation before entering.
3. Early Entry & Retest Entry Zones
For aggressive traders, an early entry just as the price approached the lower trendline was possible. However, confirmation entry after a retest offers better risk-reward and lower false breakdown probability. In this case, a small pullback to retest the broken support would be the sweet spot to enter with tight stop-losses.
4. Target 1: ₹4037.95 – First Downside Milestone
Once the breakdown is confirmed, the first logical price target based on previous swing lows and pattern measurement comes to around ₹4037.95. Traders can consider booking partial profits at this zone to lock in gains while letting the rest of the position ride.
5. Final Target: ₹3670.20 – Projected Measured Move
Based on the height of the triangle structure, the projected final bearish target lies near ₹3670.20. This level aligns with previous consolidation zones and serves as a strong psychological and technical support. If price action remains weak, this target has a high probability of being achieved in the coming weeks.
6. Stop Loss: Setup Invalid Above ₹4668.60
To protect against a failed breakdown or reversal, a stop-loss should be strictly placed above ₹4668.60. This level invalidates the bearish structure and signals that buyers may have regained control.
7. Trading Psychology and Risk Note
Breakdowns from such ascending supports after long consolidations often result in impulsive price moves. However, risk management is critical. Stick to position sizing and trail your stop-losses once Target 1 is achieved. Avoid holding full-size positions near earnings or event-based volatility.
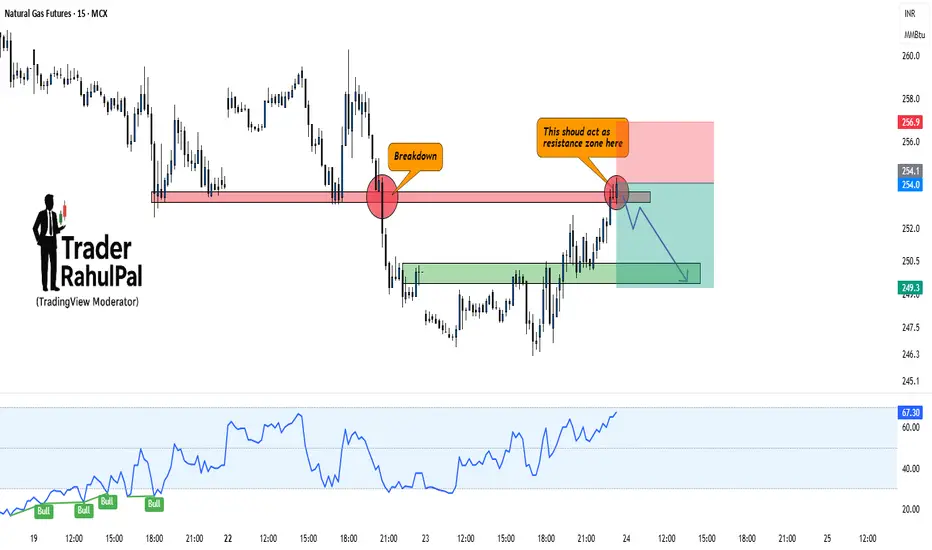
Natural Gas – Breakdown Retest Could Trigger Fresh FallHello everyone, Let's analyse Natural Gas and it has recently broken down from a key support level, turning it into resistance. The price is now retesting that zone, and unless bulls manage to reclaim it strongly, the downside remains the higher probability.
Current Setup:
Previous support around 254–256 has turned into a resistance zone.
Breakdown already confirmed with strong bearish candles.
RSI is still holding higher, but momentum may fade if resistance rejects.
Fresh downside targets can open toward 249–247 zone if rejection plays out.
Only a strong close above 257 will negate this bearish view.
Disclaimer: This analysis is for educational purposes only and should not be taken as financial advice. Please do your own research or consult your financial advisor before investing.
Analysis By @TraderRahulPal (TradingView Moderator) | More analysis & educational content on my profile
👉 If you found this helpful, don’t forget to like and follow for regular updates.
Bitcoin’s Correction Puzzle: Wedge Break, Macro Shifts!!Bitcoin has entered a fascinating phase after breaking down from its rising wedge formation, leaving the market in a medium-term correction cycle. Current price action around 113000 is trying to stabilize, but the structure suggests this zone is fragile. If bulls cannot reclaim and hold above the invalidation band near 116000, corrective flows are to dominate. The first major support sits around 103600, where a pause or bounce could develop. If that level folds, the market opens up for a deeper liquidity sweep toward 93000. Should this pocket fail to hold, Bitcoin’s path could extend into the 75000 region a zone that looks extreme but is consistent with how deep-pocket corrections unfold after a parabolic wedge break.
From a macro angle, the pressure is building. The Fed’s transition toward deeper cuts reflects softer growth, but while rate reductions support risk sentiment broadly, the narrative is colliding with dollar weakness, shifting liquidity conditions, and fading institutional momentum after the wedge breakdown. Equity markets still command flows, and with gold and silver absorbing part of the safe-haven bid, Bitcoin’s role as digital gold is being tested again. Yet, structurally, this correction is not an end-game it’s part of the broader cyclical rhythm. Bulls will need to defend lower zones convincingly to rebuild positioning before another attempt at fresh highs.
In essence, Bitcoin is in a correction phase where short-term optimism hangs on reclaiming 116000, while failure opens doors to a deeper hunt for liquidity at 103600, 93000, and potentially 75000. The macro backdrop makes this correction phase more interesting than usual it’s not just about price action, but about how Bitcoin will reassert its place in a market torn between easing policy, risk-on appetite, and competition from traditional safe-haven flows. Trade safe !!
Key Levels:
Invalidation band (bulls must reclaim): 116000
First support: 103600
Deep pocket zone: 93000
Extreme correction target: 75000

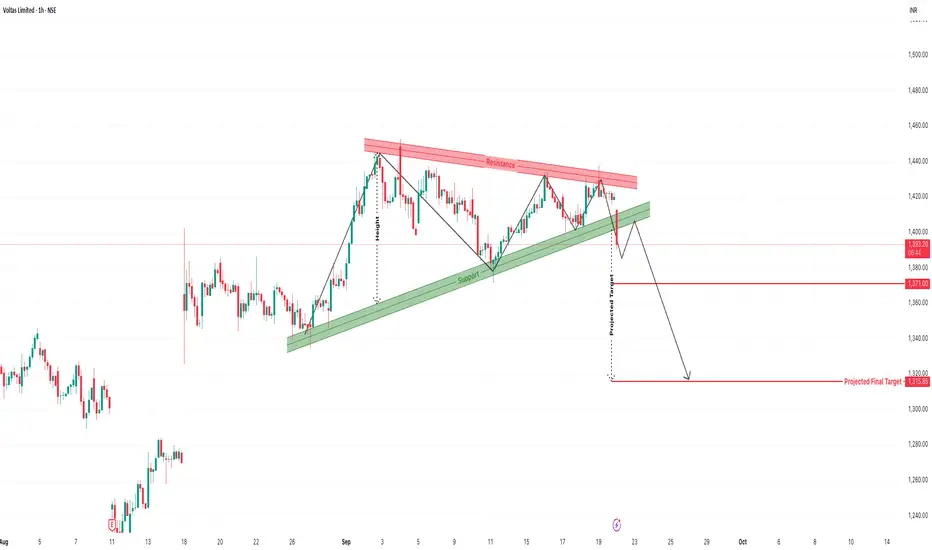
Voltas Bearish Breakdown: Rising Wedge PatternVoltas Ltd, on the 1-hour chart, has recently shown a classic bearish chart pattern — a rising wedge — which has now broken down. This setup often leads to sharp corrective moves, especially when the pattern forms after a strong rally, as seen in this case.
1. Formation of the Rising Wedge
Over the last few trading sessions, Voltas formed a rising wedge pattern, where the price was making higher highs and higher lows, but within a narrowing channel. This usually indicates weakening bullish momentum and sets the stage for a breakdown once the lower support trendline is breached.
2. Breakdown Confirmation
A decisive breakdown below the wedge's support line has been witnessed. This move was backed by a sharp red candle, confirming that bears have taken control. The price is now trading below ₹1400, a psychological round level, adding more weight to the breakdown signal.
3. First Downside Target: ₹1371
Post-breakdown, the immediate short-term target stands at ₹1371. This level may act as temporary support where some buyers might step in. Traders who have entered short trades can consider partial profit-booking at this zone.
4. Final Projected Target: ₹1315.85
If bearish momentum sustains, we can expect a full breakdown as per the wedge height projection, which brings the price target close to ₹1315.85. This would complete the measured move from the wedge breakdown and could serve as a key reversal or bounce zone.
5. Ideal Entry and Stop Loss Levels
Traders looking to ride this move can consider re-entries near ₹1390–1395 on minor pullbacks. A stop loss above ₹1415 would protect against false breakdowns or sudden reversals. This setup offers a high reward-to-risk ratio if managed correctly.
6. Momentum Shifting to the Bears
The breakdown structure shows a shift in control from buyers to sellers. If broader market sentiment also turns weak, Voltas can continue its downward trajectory over the coming sessions. Momentum traders should closely monitor for follow-through price action.
7. Important Trading Note
This is a trend reversal structure. Avoid counter-trend trades until strong support confirmation is seen. Always trail your stop loss once Target 1 is achieved, and don’t hold overnight positions without risk assessment if you’re trading with leverage.
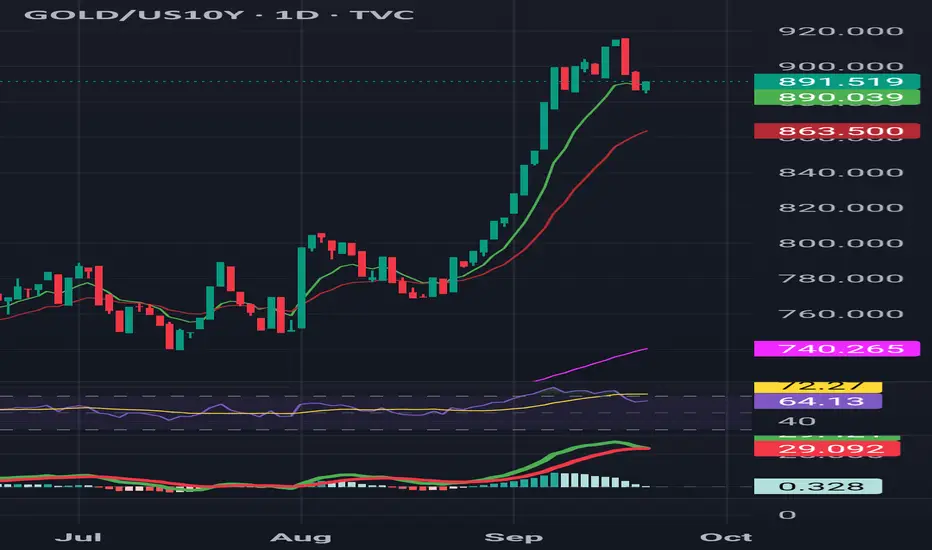
GOLD/US10Y RATIO ANALYSIS Gold vs. US 10Y yield ratio surged to extreme highs but is now showing weakening momentum. RSI has pulled back from overbought and MACD is cooling.
🔎 If this ratio rolls over, it may signal profit-taking in Gold as yields recover.
Zomato creating it's resistance zoneZomato is testing it's resistance zone.
one can watch for downside movement with stop losses above recent swing with targets of 215 levels.
it's pure price action.
stock may go in consolidate in zone for long time.
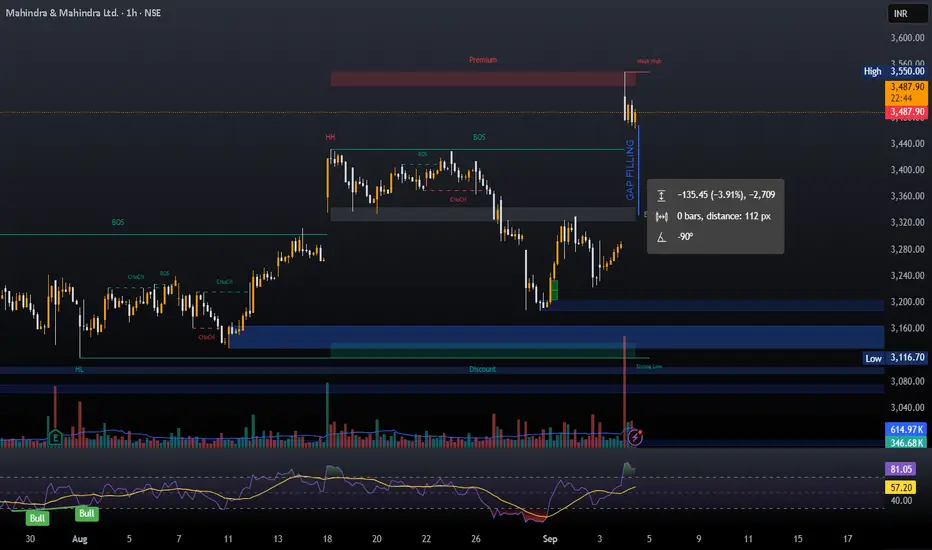
M&M ShortThe GST news has already been factored in and M&M was already trading at its al tie high. A gap up at all time high always gives an opportunity for a sell trade for the gap filling. One can look for sell in M&M with 3550 as resistance zone. Keep track of this chart and see if this concept works or not. Follow for more such concepts.
Jai Shree Ram.
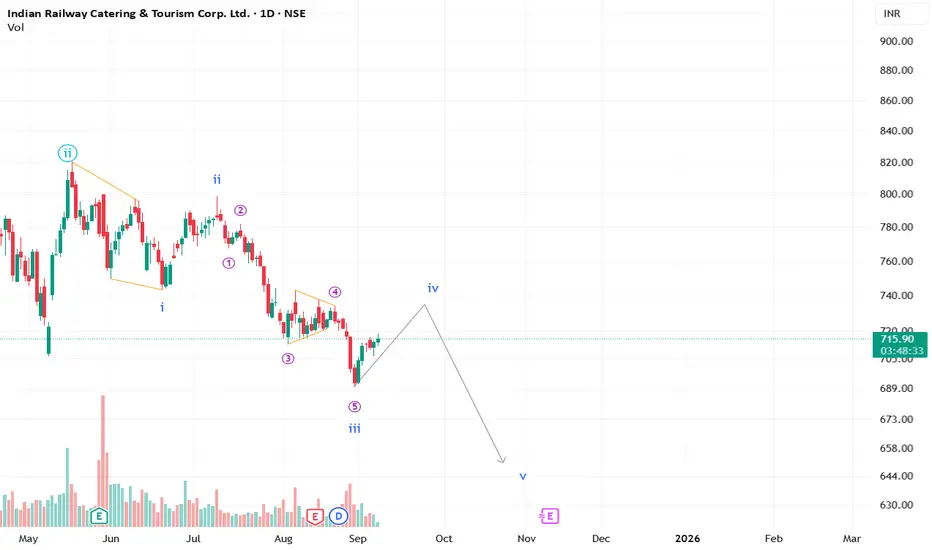
IRCTC rising to fall back again?What appears to be a corrective pullback to complete wave iv, IRCTC may witness a fall in the coming days to complete wave v.
**This is an educational market outlook, not investment advice. Please consult a SEBI-registered advisor before taking any investment decisions.**
Bearish Trade Setup for SOLUSDOverview:
This is a short position on SOLUSD, entering on the 1-hour chart with a well-defined risk-to-reward ratio. The trade is based on a downward trend confirmed by the price action and EMAs, making this a high-probability bearish scenario.
Key Levels and Indicators:
Entry Point: 186.6736
The entry is triggered when the price moves below the resistance level. This confirms the continuation of the downtrend.
Stop Loss: 202.2042
The stop loss is set above the most recent swing high to protect from any sudden price reversals. This level is designed to avoid a whipsaw and ensures the trade is kept within a reasonable risk range.
Target: 155.5356
The target is calculated based on a projected price movement in line with the current trend. Given the current market structure, this target provides an optimal reward-to-risk ratio.
Why is this a Bearish Setup?
Trend Confirmation:
The price has been consistently moving lower, showing strong bearish momentum. The EMAs (9 and 20) are also sloping downwards, reinforcing the likelihood of further downside movement.
Price Action:
The recent price action has formed lower highs and lower lows, a key indication of a strong downtrend.
EMA Alignment:
The 9-period EMA (188.6387) is below the 20-period EMA (192.3233), a classic bearish crossover that confirms the downward bias of the market.
Risk-to-Reward Setup:
The trade offers an excellent risk-to-reward ratio of approximately 1:3, which ensures that potential profits outweigh the risk taken on the trade.
Trade Management:
Entry Criteria: Enter the position when the price breaks below the support zone, ideally near the entry point.
Exit Strategy: Target is set at 155.5356, but keep an eye on the price action in case a trend reversal occurs before hitting the target. Always adjust the stop loss to lock in profits as the price moves in your favor.
Final Thoughts:
This is a well-structured bearish trade idea based on both technical analysis and price action. Always ensure that you follow proper risk management rules and adjust your stop loss or take profit levels based on market conditions.

AUDUSD-ShortAUD/USD 15m Chart Update
1️⃣ HTF Resistance
Price has reached a higher-timeframe resistance zone.
This is an important supply area where sellers may step in.
2️⃣ Bearish Order Block (OB)
A bearish order block is formed just below the resistance.
Price tapped into this OB and showed rejection with red candles.
3️⃣ Volume Analysis
The recent upmove happened with less volumes, showing weak buyer interest.
Sellers gaining strength near resistance is a bearish signal.
Market showing signs of rejection from resistance + bearish OB.
Unless strong buying volume comes in, we may see further downside pressure.
🔹 Entry Zone: Around the Bearish Order Block (0.6548 – 0.6555)
🔹 Stop Loss: Above HTF Resistance (0.6560)
🔹 Target 1: 0.6530
🔹 Target 2: 0.6515 (extended target if momentum continues)
Reasoning: Price rejected from HTF Resistance. Bearish OB showing supply zone. Weak volumes in the upmove = less buyer strength.
Plan: Wait for pullback to OB zone → Short entry → Trail stop once Target 1 is achieved.

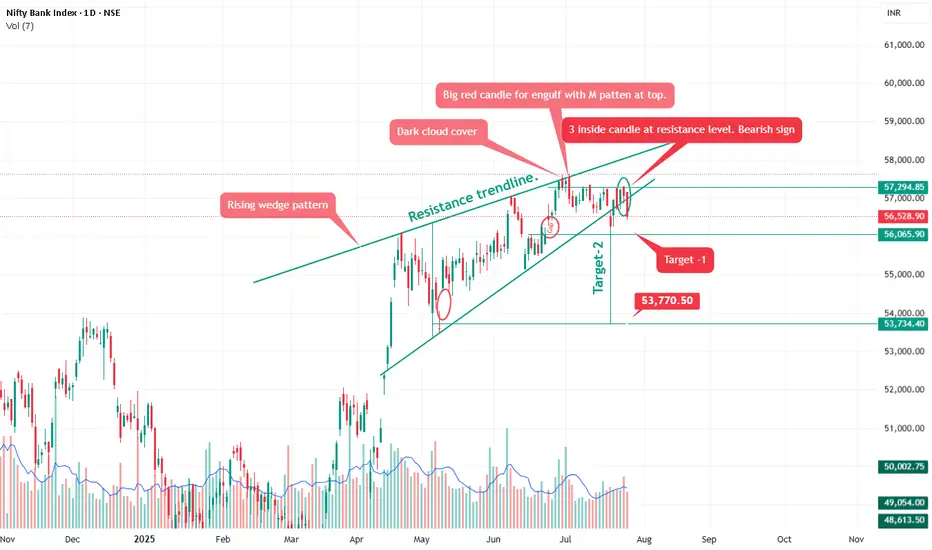
Bank nifty Rising wedge pattern.Pattern Analysis
Rising Wedge Pattern:
A bearish pattern typically seen near tops. It shows narrowing price movement with higher highs but declining momentum.
Breakdown confirmed as price has fallen below the lower wedge support trendline.
Confirms selling pressure and rejection from the top near 57,300–57,500 zone.
🕯️ Candlestick Signals
Dark Cloud Cover:
A bearish reversal pattern indicating sellers have taken control after a bullish phase.
Big Red Candle + ‘M’ Pattern:
Bearish engulfing at resistance – strong indication of a top formation.
3 Inside Down Candlestick Pattern at Resistance:
Recent red candles have higher volume, confirming institutional selling activity.
As anticipated in our previous analysis, Bank Nifty corrected from the 57,000 level to 56,056, validating the bearish setup.
It is also expected to short here 56,550 add on any rise up to 57,700-57,950 for target mentioned on chart.
Alternative Scenario: Be aware that the rising wedge could potentially break upwards. If the price breaks decisively above the resistance trendline with strong volume, the bearish outlook would be invalidated.
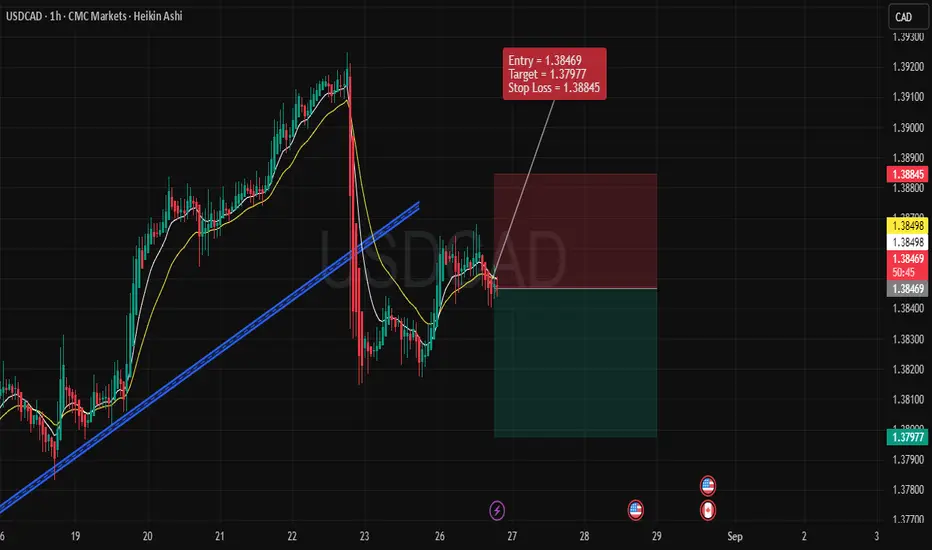
USDCAD – Bearish Trade Setup (1H Timeframe)Trade Details
Entry: 1.38469
Stop Loss: 1.38845
Target: 1.37977
🔹 Technical Reasons for Bearish Bias
Trendline Breakdown
Price recently broke below the rising trendline, indicating that the bullish momentum has weakened.
The failed retest of the broken trendline confirms bearish pressure.
Moving Averages Confirmation
The short-term moving averages (yellow lines) have crossed to the downside, aligning with bearish sentiment.
Price is trading below these moving averages, signaling sellers are in control.
Lower High Formation
After the sharp drop, the latest pullback failed to make a new higher high.
This indicates a shift from bullish structure to a bearish lower-high pattern.
Weak Recovery Attempt
The rebound after the drop is shallow and lacks strong bullish candles.
This suggests the market is unable to regain bullish momentum.
🔹 Risk Management
The Stop Loss is placed above the recent swing high (1.38845), protecting against sudden spikes.
The Target is set at 1.37977, aligning with recent support levels and offering a favorable risk-to-reward ratio.
🔹 Trade Outlook
This setup anticipates continuation of the bearish trend after the trendline break. Unless price reclaims and sustains above 1.3885, sellers remain favored in the short term. A successful breakdown could open the way for deeper downside in USDCAD.
✅ Summary:
Bearish structure confirmed by trendline break, bearish moving average alignment, and weak recovery → Entered short at 1.38469, targeting 1.37977 with stop at 1.38845.
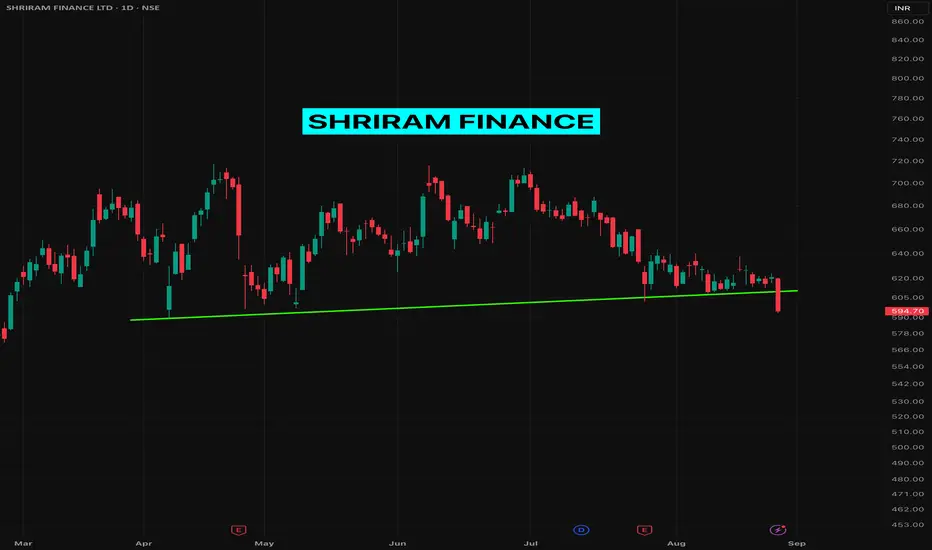
Shriram Finance BREAKING DOWN a #TrendlineSupport Shriram Finance BREAKING DOWN a TrendlineSupport with quite decent volume.
I am looking at the daily time frame here and filled some SHORT position today before the closing bell.
BNB/USDT – Short Setup (1H Chart)BNB is showing weakness after repeated rejections and a break below short-term moving averages. Price action indicates selling pressure, and the recent structure suggests continuation to the downside.
🔹 Entry: 841.825
🔹 Target: 784.770
🔹 Stop Loss: 870.281
The risk-to-reward ratio looks favorable, with sellers gaining momentum as long as price remains below resistance. A breakdown from the current consolidation zone may accelerate bearish momentum toward the target zone.
⚠️ This is a short-term bearish trade idea based on technicals. Always manage risk and adjust positions as per market conditions.
