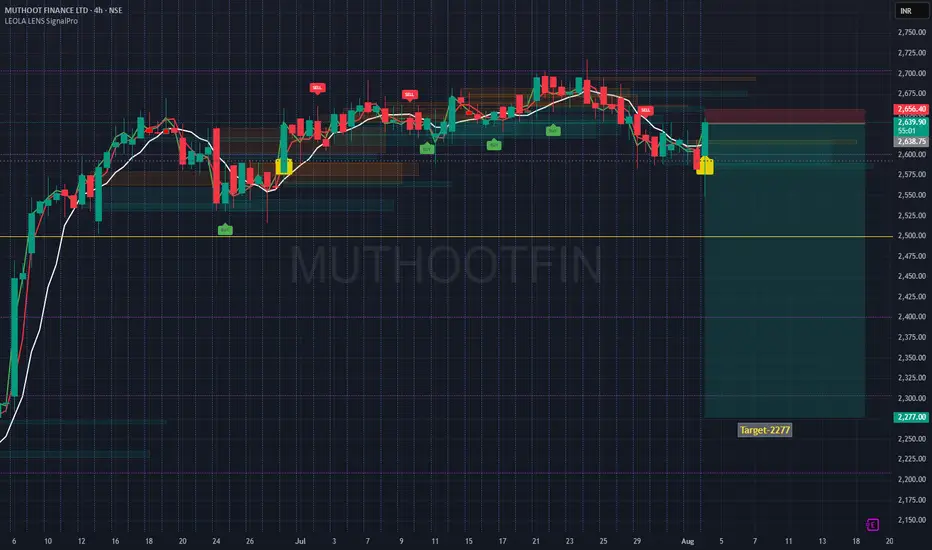
MUTHOOTFIN Structure Breakdown- 2277- Step Towards a Fall 🔍 Technical Structure Breakdown:
🟡 Caution label printed after extended distribution — often a signal for upcoming directional shift.
🔴 Price rejected strongly from the upper red supply zone near ₹2,656, confirming resistance from prior SELL cluster.
⚪ Structure broke below a multi-session accumulation zone, flipping the bias to bearish.
🟢 Current rebound is testing the underside of broken structure — often a key area for rejection or continuation.
📉 Target: ₹2,277, aligning with a major historical reaction zone and potential liquidity pocket.
This setup reflects a classic breakdown-retest structure where price may revisit lower order blocks if it fails to reclaim the broken support zone.
⚠️ Disclaimer:
This post is intended solely for educational purposes and does not constitute financial advice. Please do your own research and consult a licensed financial advisor before making any investment or trading decisions.
Shortsetup
XAUUSD - Intraday Eyes Short 📌 XAUUSD 45-min — Sell Signal at Supply After Aggressive Impulse Rally
Technical Structure Notes (45m):
🔺 A strong impulsive leg lifted price from sub-3320 zones toward 3360 — completing a breakout from accumulation.
🔴 SELL Signal triggered near prior rejection zone after signs of exhaustion.
🔻 Price is currently reacting to short-term supply, with the red moving average acting as a dynamic decision point.
🟫 Supply zone aligns with previous resistance, suggesting potential rejection unless price reclaims 3362.
📍 If price fails to hold above 3353, a pullback toward 3315–3320 becomes technically plausible.
Disclaimer: This chart is shared strictly for educational purposes and is not financial advice. Always perform your own analysis and manage risk before taking any trading decisions.

EURUSD Eyes Short Structure Break📌 EURUSD 15-min — Structure Breakdown After Consolidation Near Resistance
Technical Chart Breakdown (15m):
🔴 SELL Signal triggered after price rejected upper boundary of a tight consolidation box.
🟠 Multiple rejections formed just below 1.158 — suggesting local supply absorption.
🔻 Price broke below the red moving average and consolidation low, confirming momentum shift.
🟡 Leola Lens caution structure (box cluster) marked a potential pause before breakdown.
📉 Downside focus remains valid as long as price stays below 1.158.
🔍 Structural target zone extends toward 1.15, with intermediate reaction levels visible.
Disclaimer: This chart is shared for educational purposes only and does not constitute financial advice or a recommendation to trade. Always conduct your own analysis and manage risk appropriately.

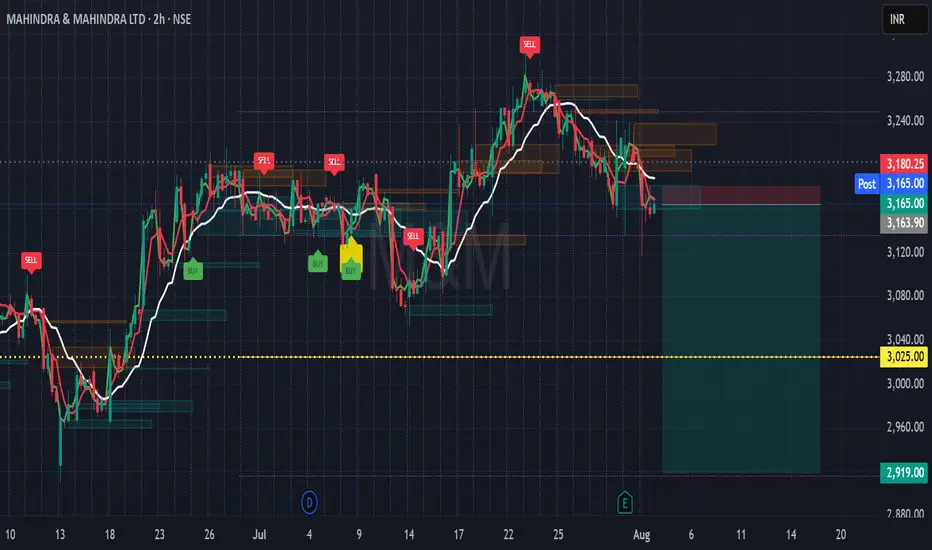
M&M Short Setup-Rejection from Supply Zone + Trend ConfirmationThis 2H chart on Mahindra & Mahindra Ltd. reflects a structure-aware short opportunity, based on price rejection from a key resistance zone and alignment with Leola Lens SignalPro logic.
🔎 Technical Structure Highlights:
🔴 SELL signal confirmed as price failed to sustain above recent supply clusters.
🟤 Multiple rejection blocks visible near ₹3,180 — now acting as resistance.
⚪ Price broke below the adaptive white base trendline, turning it into overhead pressure.
🟡 Prior yellow caution marker (trend shift risk) proved meaningful as momentum faded.
🟥 Defined invalidation level above ₹3,180.25.
🟢 Bearish targets align with previous demand zones near ₹3,025 and ₹2,919.
📌 Context Note:
Trend has shifted from congestion to downside acceleration. A clean break of recent structure suggests caution for longs. Watch for volatility around upcoming earnings.
📚 This is a technical case study — for educational use only.
Always trade with risk controls and your own judgment.
#M&M #Mahindra #NSEStocks #PriceAction #ShortSetup #StructureTrading #TechnicalAnalysis #SignalPro
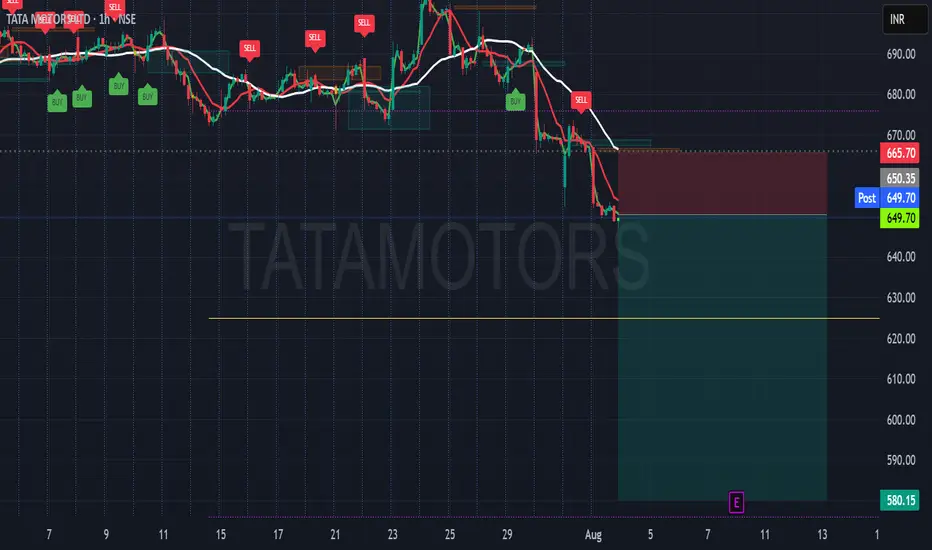
TATAMOTORS Breakdown Watch-Structure Rejection & MomentumThis 1H chart on Tata Motors highlights a structure-aware short setup, guided by the Leola Lens SignalPro overlay.
🔍 Technical Breakdown:
🔴 A fresh SELL signal appeared after price lost the adaptive trendline and failed to reclaim the resistance block.
⚪ Price retested the liquidity rejection zone near ₹650–₹652 before continuing lower.
🟣 The white base trendline is now acting as overhead pressure.
🟥 The Liquidity Control Box serves as invalidation above ₹665.70.
🟢 Potential target zones extend toward the ₹620–₹580 region, aligning with prior demand clusters.
🧠 Context Note:
The setup follows a clear structure rejection after a failed bullish attempt. Momentum confirms the shift, but risk management remains essential due to volatility and earnings
📌 For educational purposes only.
Always manage risk and confirm with your own strategy.
#TataMotors #ShortSetup #StructureTrading #IndianStocks #NSE #PriceAction #TechnicalAnalysis
UK100-Short Setup After Supply Zone RejectionPrice rallied sharply from the lows after a Buy signal, showing strong momentum into resistance.
After the rally, a Sell signal has emerged near local highs and beneath a defined structure zone.
Price has started to reject from the zone, with EMAs flattening out — hinting at short-term weakness.
🔍 Educational Setup (Short Bias):
Observed Entry Area: Near 9,146.80
Stop Reference: Above 9,155.96 (supply invalidation point)
Target Zone: 9,092.29 — aligned with previous demand base and structural retest
🧠 SignalPro Observations:
Earlier Buy sequence led to momentum burst — now fading as price meets resistance
EMA behavior suggests potential for mean reversion or short-term correction
Liquidity cluster below may act as a draw in the near term
⚠️ This chart and analysis are for educational purposes only. This is not financial advice. Please conduct your own analysis and manage risk before making any trading decisions.

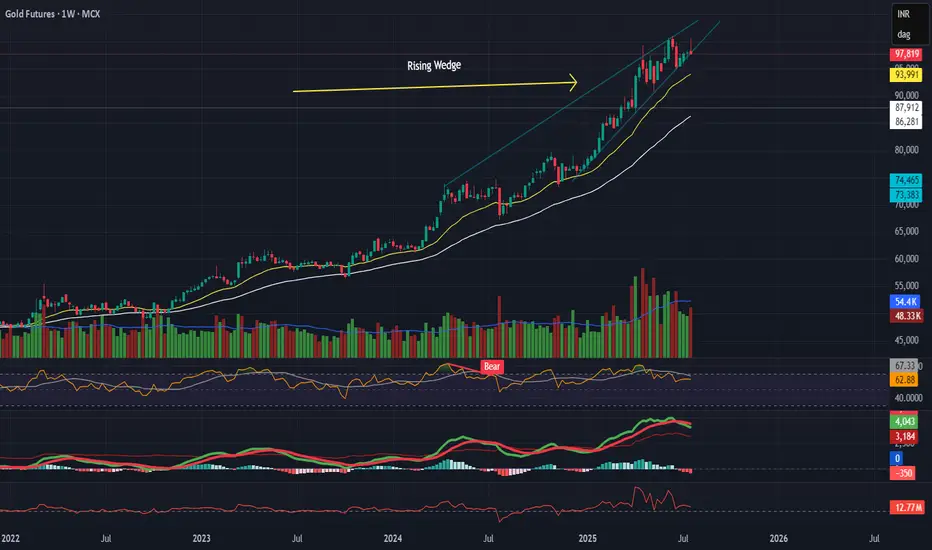
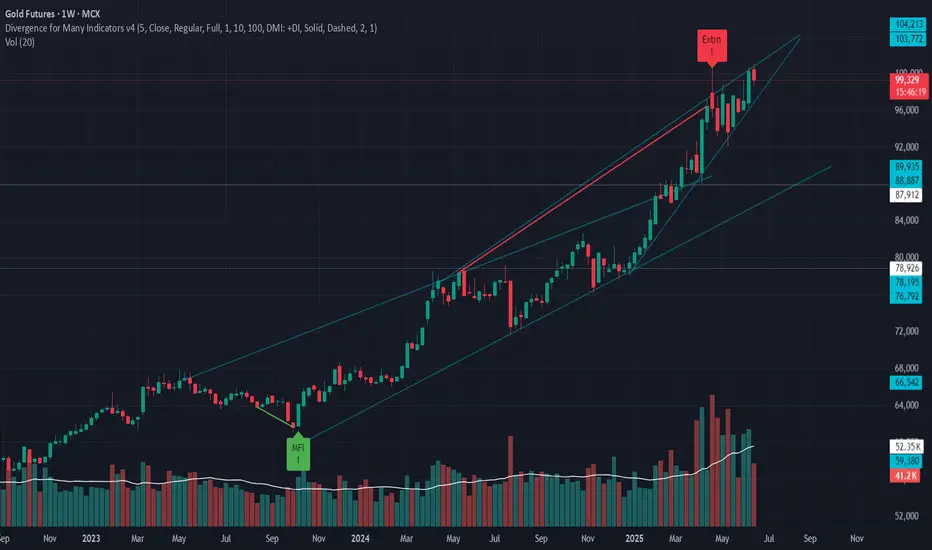
Gold Breaking Down – Rising Channel + Wedge Breakdown
Gold Breaking Down – Rising Channel + Wedge Breakdown
Description:
Gold has broken down from a rising channel on the daily timeframe and a rising wedge on the weekly, signaling a possible intermediate correction.
Key Observations:
- Momentum divergence on RSI, MACD, EFI
- Bearish volume supporting the move
- Price now below 20 EMA, approaching 50 EMA
- Weekly wedge failure after a secondary test of highs
Macro Drivers:
- Lower inflation
- Stable USD
- Dovish Fed stance
- Middle East tension cooled
- Gold appears overpriced on relative terms
Trade Setup:
🔻 Breakdown: ₹97,500
🎯 Targets: ₹92,000 → ₹87,000
🛑 Stoploss: ₹1,00,560 (near ATR and resistance)
🧠 Bearish bias short-term unless macro changes again.
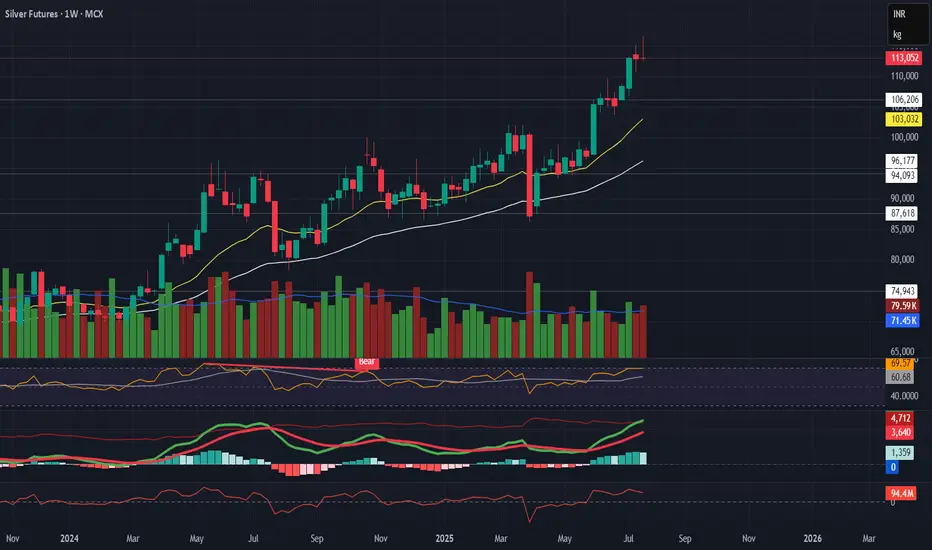
Silver Futures – Bearish Reversal in Progress
Silver Futures – Bearish Reversal in Progress
Description:
Silver is showing a strong technical reversal across timeframes. Short-term correction looks likely.
Technical Setup:
Daily:
Evening Star + Bearish Engulfing
Flattening EMAs
Volume and MACD confirming momentum slowdown
Weekly:
Gravestone + Southern Doji near resistance
RSI close to overbought
EMA slope still up, but weakening signs visible
Macro View:
No major bearish macro trigger — Fed dovish, USD stable, inflation low.
→ This is likely a technical pullback, not a fundamental reversal.
Trade Plan:
🔻 Breakdown Level: ₹114,560
🎯 Targets: ₹107K → ₹101K → ₹93K
🛑 SL: ₹116,000+
Caution: No position without breakdown confirmation.
SPX Supply Rejection-Eyes on 6304SPX shows signs of potential weakness after testing a prior supply zone and failing to sustain higher levels. The current setup anticipates a downward move, supported by structural resistance and liquidity imbalances.
🔍 Chart Highlights:
🟥 Red zone marks supply rejection after a strong upward move.
📦 Liquidity Control Boxes from SignalPro show layered imbalance zones between 6,350–6,310.
🧊 Target marked at 6304, aligned with lower liquidity pocket and recent demand structure.
⚠️ Stop region defined above the rejection high, giving clear invalidation.
📘 Educational Focus:
This trade scenario highlights how to:
Identify potential exhaustion at supply zones
Map liquidity structures using institutional-style tools
Build trade ideas with defined risk-to-reward
Such planning reinforces disciplined trading, especially in high-volume indices like SPX.

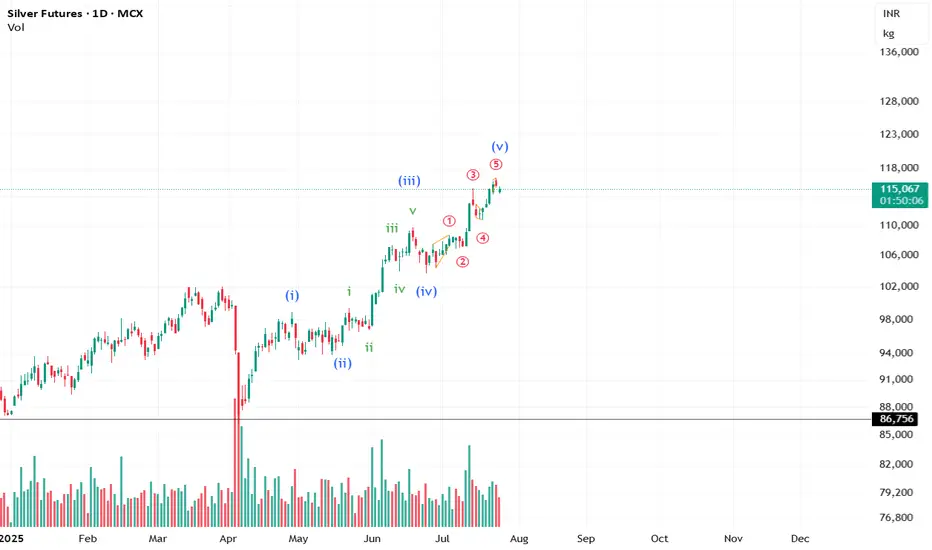
Is the move over for Silver? #CommodityIt looks like the impulse for Silver is about to end. However, we still need the price action to confirm the view.
**This analysis is based on the Elliott Wave Principle.
This analysis is for educational purposes only and not investment advice.
Please consult your SEBI-registered advisor before making any investment decisions. Markets are subject to risk.**
MRF - BEARISH SETUP (DAILY TIMEFRAME) DOUBLE TOPA double top pattern is a bearish reversal pattern that can be observed on a stock's price chart after an uptrend. It signals that the upward trend may be losing momentum and that a downtrend could be imminent.
Please sell if your setup agrees too - I will sell if 1,45,000 Levels is broken Your Boost and like will remind me to sell so please keep supporting so that this post reminds me to sell MRF at 1.45K levels

Selling pressure, gold downtrendPlan XAU day: 09 July 2025
Related Information:!!!
Gold (XAU/USD) continues to extend its decline on Wednesday for a second consecutive session, as the US Dollar (USD) and US Treasury yields strengthen ahead of the release of the Federal Open Market Committee (FOMC) Meeting Minutes.
The US Dollar Index (DXY) has climbed to a two-week high, exerting downward pressure on XAU/USD, which has fallen below the $3,300 level at the time of writing.
The forthcoming release of the FOMC Minutes from the June meeting is anticipated to provide insight into the Federal Reserve’s internal discussions regarding the future course of monetary policy.
In June, the central bank chose to maintain its benchmark interest rate within the 4.25% to 4.50% range, citing continued labor market resilience and persistent inflationary pressures.
personal opinion:!!!
Gold price is in the accumulation zone below 3300, big selling pressure. Pay attention to selling gold according to the trend line 3294
Important price zone to consider : !!!
support zone point: 3274; 3252 zone
Sustainable trading to beat the market

Shorting BTCUSD After Trendline Failure & Bearish RetestPlanning to short BTCUSD as price has rejected from the descending trendline resistance after breaking the minor ascending trendline support. The confluence of trendline rejection and bearish retest suggests potential downside continuation.
Entry Zone: ~107,300–107,350
Stop-Loss: Above 107,550 (recent high)
Target: 106,550 support area
Risk-to-Reward Ratio: ~1:2 (Min) 1:4 (Final Target)
Quote:
"Trendline confluence and failed bullish continuation often lead to deeper pullbacks."
📊 Summary of the Idea
✅Reason for Entry: Multiple rejections at trendline + structure breakdown.
✅Confirmation: Retest rejection candle.
✅Invalidation: A clean breakout and hold above the descending trendline.

Gold price recovers 3310, accumulates MondayPlan XAU day: 30 June 2025
Related Information:!!!
Gold prices (XAU/USD) regained some lost ground during the early European trading hours on Monday. Increasing expectations that the US Federal Reserve (Fed) will implement additional interest rate cuts this year—and potentially sooner than previously anticipated—may weigh on the US Dollar and, in turn, provide support for the USD-denominated commodity, as a weaker dollar makes gold more affordable for foreign investors.
However, improved risk sentiment stemming from the US-China trade agreement, as well as the ceasefire reached between Israel and Iran, may reduce the appeal of gold as a traditional safe-haven asset. Market participants now turn their attention to upcoming remarks from Federal Reserve officials later on Monday, with scheduled speeches from Atlanta Fed President Raphael Bostic and Chicago Fed President Austan Goolsbee.
personal opinion:!!!
Gold price recovers to gain liquidity at the beginning of the week, using fibonacci to find potential resistance: 3310
Important price zone to consider : !!!
SELL point: 3310 zone
Sustainable trading to beat the market

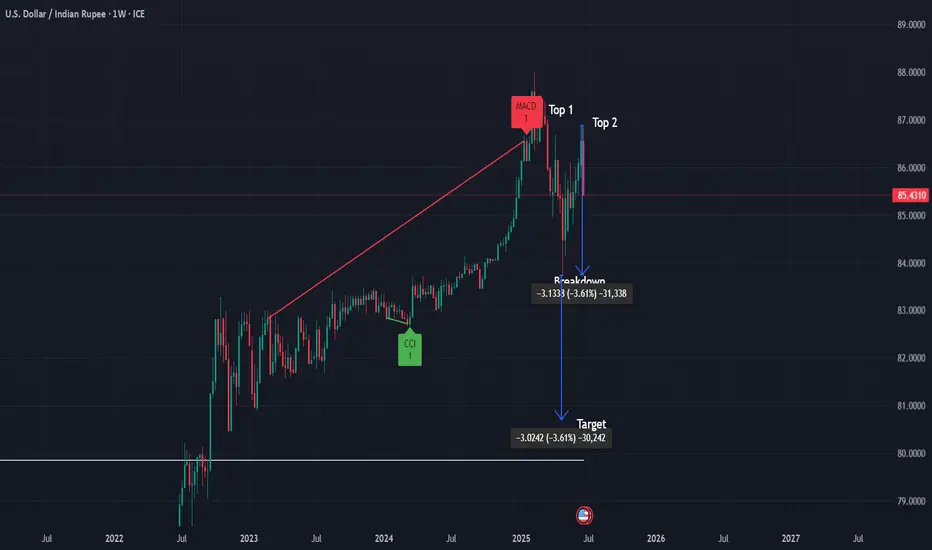
USD/INR Weekly Chart Analysis 📌 USD/INR Weekly Chart – Double Top Analysis
After a sustained uptrend, USD/INR is showing potential signs of a reversal with a well-defined Double Top pattern on the weekly timeframe.
✅ Pattern: Double Top (Weekly)
✅ Key Resistance: ~87.00 (tops)
✅ Breakdown Level: 83.76 (watch for confirmed weekly close below)
✅ Target Projection: ~80.76 (based on measured move)
✅ Stop-loss: ~84.70 (ATR-based level)
📉 Bias: Bearish on confirmed weekly close below 83.76 with increased selling volume.
🔎 Volume Note: Look for higher volume on breakdown to confirm selling pressure and pattern validity.
✅ Commentary:
This classic double top setup suggests potential trend exhaustion after an extended move up. A weekly close below the 83.76 neckline with strong volume would strengthen the bearish signal, targeting ~80.76 in the medium term. ATR-based stop-loss placement provides tactical risk management above recent support
RATTANINDIA POWER LTDTechnical View:
Price: ₹14.39 (+3.60%)
Volume: Very strong volume (~645M), indicating institutional interest or strong buying pressure.
EMA: Price is trading well above the EMA – confirms short-term bullish strength.
RSI: Currently at 66.67 – strong positive momentum.
Chart Pattern View:
Price is moving within a well-defined ascending channel.
Recently rebounded from the lower boundary – and now heading toward the upper resistance line.
Candlestick View:
Strong bullish candlestick seen in the current breakout candle.
No upper wick implies buyers were in full control throughout the session.
Buy Opportunity:
Entry Zone: 15.00 above
Target 1: 17.50 (previous swing high).
Target 2: 20.00 ++ (upper channel resistance if momentum continues).
Stop Loss: 12.90 (below breakout level and channel lower band).

bears active, gold price below 3300Plan XAU day: 27 June 2025
Related Information:!!!
In fact, Powell reiterated this week that the Fed is well-positioned to wait before cutting interest rates until it has a clearer understanding of the impact of steep tariffs on consumer prices. His comments sparked fresh criticism from US President Donald Trump, who has been calling for lower interest rates. Furthermore, reports indicate that Trump is considering naming Powell's successor by September or October.
This development raises concerns about a potential erosion of the Fed’s independence, which should limit any immediate positive reaction in the USD to the upcoming inflation data. In turn, this suggests that the path of least resistance for the XAU/USD pair remains to the upside, and any further decline may still be viewed as a buying opportunity.
personal opinion:!!!
Gold prices are consolidating around 3280 - 3290 in the European trading session, accumulating for selling pressure to prevail.
Important price zone to consider : !!!
BUY point: 3272; 3248 zone
Sustainable trading to beat the market

Amazon on shot high selling pressureThe chart depicts the weekly price movement of Amazon (AMZN) stock from 2022 to mid-2025, with a focus on a recent period around June 2025. Here’s an analysis based on the provided chart:
Historical Trend: The stock experienced a significant upward trend from 2022 to mid-2024, showing consistent growth with periodic corrections. This suggests strong bullish momentum over the long term.
Major Support Level: A key support zone is identified around the $916.18 to $919.18 range (highlighted in red). The price recently approached this level and appears to have found support, as indicated by the stabilization and slight upward movement after testing this zone.
Recent Price Action: After reaching a peak near $1,000, the stock experienced a sharp decline, entering a consolidation phase within a descending triangle pattern (highlighted in light blue). The price recently broke below the lower trendline of this pattern, suggesting potential bearish momentum.
Projected Movement: The chart includes a downward projection (blue arrow) indicating a possible further decline toward the $616.74 to $650.00 range if the bearish trend continues. This could represent a deeper correction or a test of a lower support level.
Volume and Indicators: The chart shows Bollinger Bands (BVC 880,260 H90,000 L85,200) and a closing price of $852,740 with a -29,380 (-3.33%) change, indicating increased volatility and a recent downward shift. However, specific volume or momentum indicators are not detailed enough for a precise assessment.
Outlook: The stock is currently at a critical juncture. If the $916.18 support holds, it may signal a reversal or consolidation. A break below this level could lead to a more significant decline toward the projected $616.74-$650.00 range. Monitoring price action around the support zone will be key.

Gold Futures is forming a rising wedge with weakening momentum.
Gold is currently testing a rising trendline on the daily/weekly chart.
A trendline breakdown could signal a shift from bullish to corrective phase.
If the trendline breaks, the structure suggests:
Stop-loss: ₹101,000
Target 1: ₹90,000
Target 2: ₹86,000
This aligns with a potential retracement before the next macro wave (e.g., Fed rate cut cycle or global risk-off).
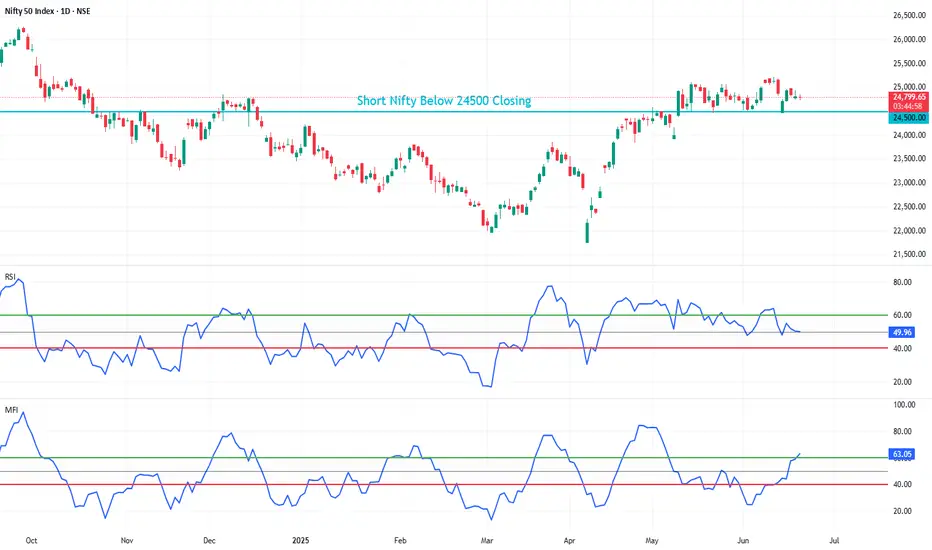
NIFTY (OVERALL MARKET) SETUP FOR SHORTING Please don't look for longs if nifty breaks below 24500, if it is above 24500 then you can see signs of recovery and re-asses your trades but untill then please wait for nifty to fall below 24500₹ levels to short
If nifty breaks then overall markets fall, for better optimization look for stocks now which you think are overvalued now
and then when nifty breaks 24500 then sell or buy PE (any ways you want to) that overvalued stock because that will usually have a larger fall if markets fall.
Please be prepared apart from your daily trading !!
May you all be happy, May you all be profitable :)
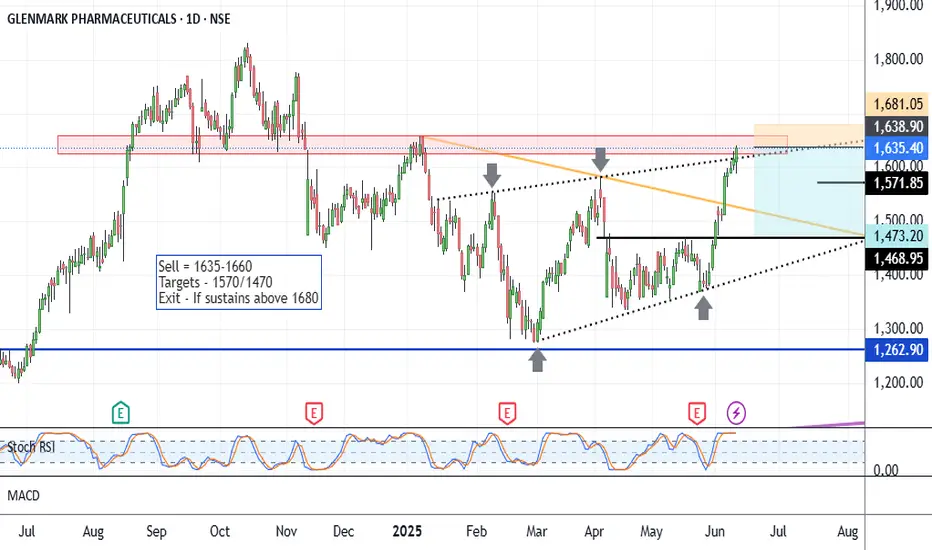
Glenmark - Short SetupCMP 1635 on 12.06.25
The chart is self-explanatory. The stock price has increased by approximately 20% over the past month. This time, reaching the confluence area around 1640-1650.
If the area around 1650 reacts as resistance again, a correction period will then ensue.
Targets may be 1570/1470.
The setup will lose significance if it sustains above 1680.
The above illustration and analysis are only for learning and sharing purposes; it is not buy or sell recommendations.
All the best.
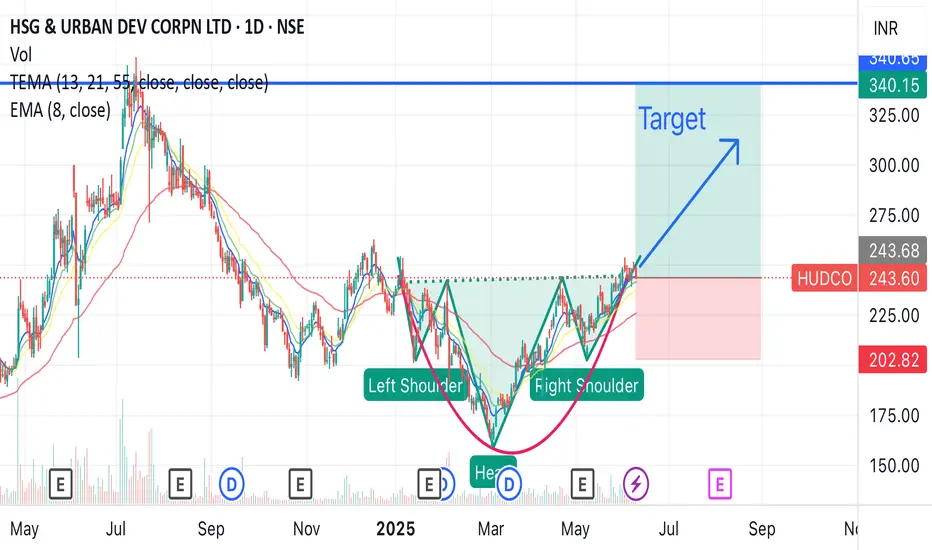
HUDCO head and shoulder breakoutHUDCO is great stock with good fundamentals, giving head and shoulder breakout soon in short term with 35% upside
Buy at - 243
Target - 340
Hold duration - 1 to 2 months
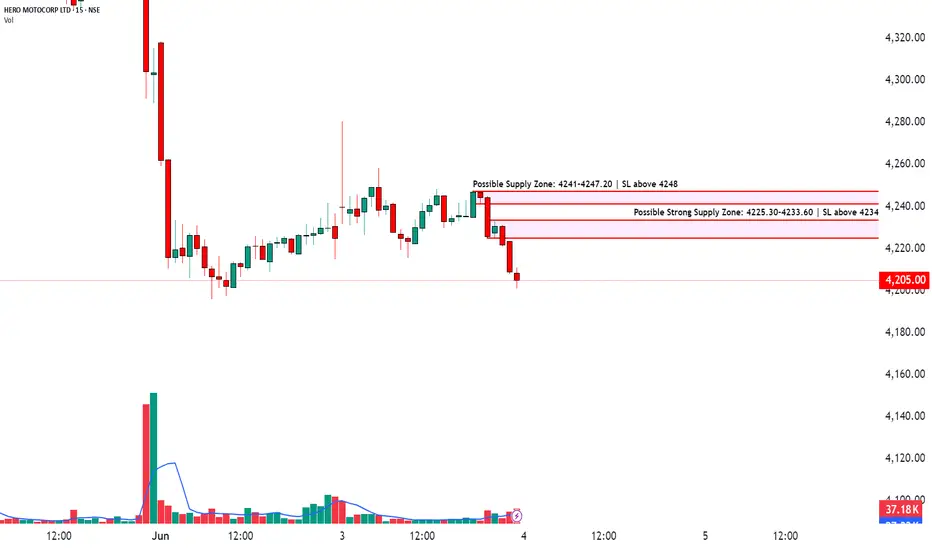
Identify Strong Supply Zones & Set Targets with RRR Logic📈HERO MOTOCORP LTD | 15-Min Chart Analysis
📆Date: June 3, 2025
Ticker: NSE:HEROMOTOCO
Price: ₹4,205.00
Chart Overview:
The chart shows a clear intraday rejection from a key supply zone followed by strong bearish price action. A decisive move below ₹4,220 indicates supply pressure.
Two critical supply zones are marked:
Possible Strong Supply Zone: 4225.30–4233.60 | SL above 4234
Possible Supply Zone: 4241–4247.20 | SL above 4248
Price is currently trading around ₹4,205, just below these zones, signaling a potential continuation of the short-term bearish trend.
Supply Zone Breakdown:
🟥🟥 Strong Supply Zone (4225–4233):
Multiple wick rejections seen previously.
Ideal for aggressive short entries with tight SL above 4234.
🟥 Upper Supply Zone (4241–4247):
Acts as a secondary resistance.
Conservative short traders can consider this zone with SL above 4248.
How to Trade Supply & Demand Zones:
When to Enter (Short Trade from Supply Zone):
Wait for price to retest the supply zone.
Watch for bearish confirmation candles like shooting stars, bearish engulfing, or rejections with volume.
Enter short near the top of the supply zone.
Keep a tight stop-loss just above the zone.
Stop-Loss Placement:
For Strong Supply Zone: SL above ₹4234.
For Higher Supply Zone: SL above ₹4248.
Targets: Book profits at logical RRR levels (1:2 or 1:3 for high probability setups).
Why Use Risk-Reward?
Helps you define targets objectively.
Protects capital with fixed stop-loss logic.
Avoids emotional exits; everything is pre-planned.
⚠️ Risk Management Tip: Always trade with a clearly defined stop loss. Avoid entering positions impulsively. It is advisable to start with a smaller quantity and increase your exposure only if the price action confirms the continuation of the trend. Capital protection should always be the priority.
📢 Disclaimer
This content is created purely for educational and informational purposes. It is not intended as investment advice, stock recommendations, or trading tips. Trading and investing in the stock market involves risk. Please consult with a SEBI-registered financial advisor before making any investment decisions. The author/creator is not registered with SEBI and shall not be held responsible for any losses incurred based on this information. Always do your own research and use proper risk management.
👉 If you found this analysis helpful, don’t forget to Follow, so you never miss out on a trade-worthy setup, breakout opportunity, or valuable educational insight again. Stay updated and trade smarter! 💡📈