My Analysis Perfect 100%Analysis of the Price Action
Based on the image, the market experienced a significant and rapid downward movement, indicated by the long red candle (often called a 'sell-off' or 'wick' depending on how the candle closes) around the area you've highlighted.
• Before the Drop: The price was trading in a relatively high range, hovering around the 120,000 to 122,000 USDT mark, following a strong uptrend from late September to early October.
• The Drop: The price crashed through multiple key support levels (the horizontal white, yellow, and red lines, as well as the green/red zones you have drawn) in a very short period.
• The Volume: This massive price drop was accompanied by a huge spike in selling volume (the very tall red bar in the volume indicator at the bottom), which confirms a strong and sudden selling event.
• The Low: The price wick reached a low around 101,668.1 USDT before bouncing slightly.
Interpreting "My Target is Done"
Since I don't know the specifics of your trading strategy, "My target is done" could mean a few things:
1. Stop-Loss Hit: If you were long (betting on the price going up) and had a stop-loss set somewhere in the zone where the price fell, this sudden move would have triggered your stop-loss, closing your position for a loss (a target for your risk management).
2. Take-Profit Hit (Short Position): If you were shorting (betting on the price going down) and had a take-profit target set in the lower price ranges (perhaps around 110,000 or 105,000 USDT), this drop would have executed your take-profit order for a gain. This is the most common interpretation if you are celebrating a target being done during a crash.
3. Target for Entry: If you were waiting to buy the dip, the price hitting the very low levels (the wick) might have triggered a buy limit order you had placed, meaning your target for a new entry was achieved.
Given the nature of the move, if you were short, congratulations! If you were long, this looks like a painful liquidation or stop-loss event.
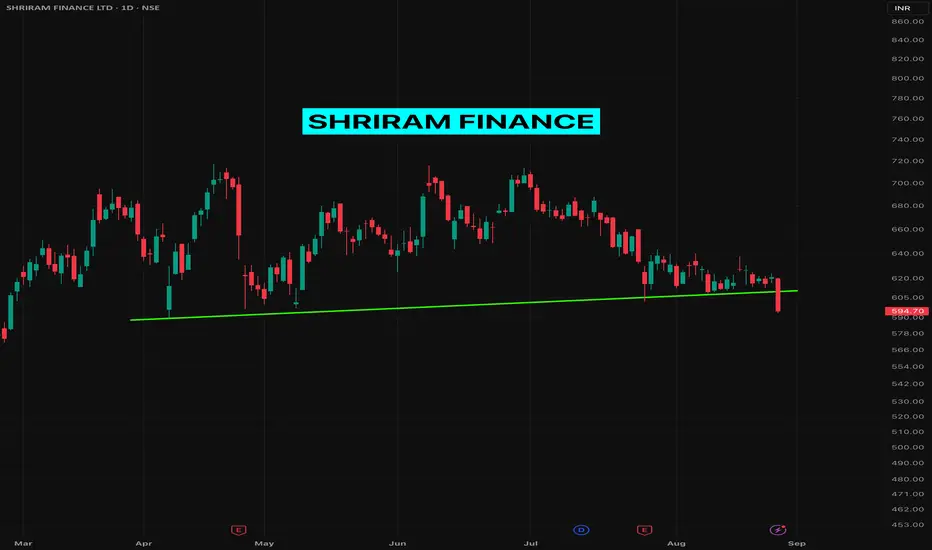
Shortsignal

Shriram Finance BREAKING DOWN a #TrendlineSupport Shriram Finance BREAKING DOWN a TrendlineSupport with quite decent volume.
I am looking at the daily time frame here and filled some SHORT position today before the closing bell.
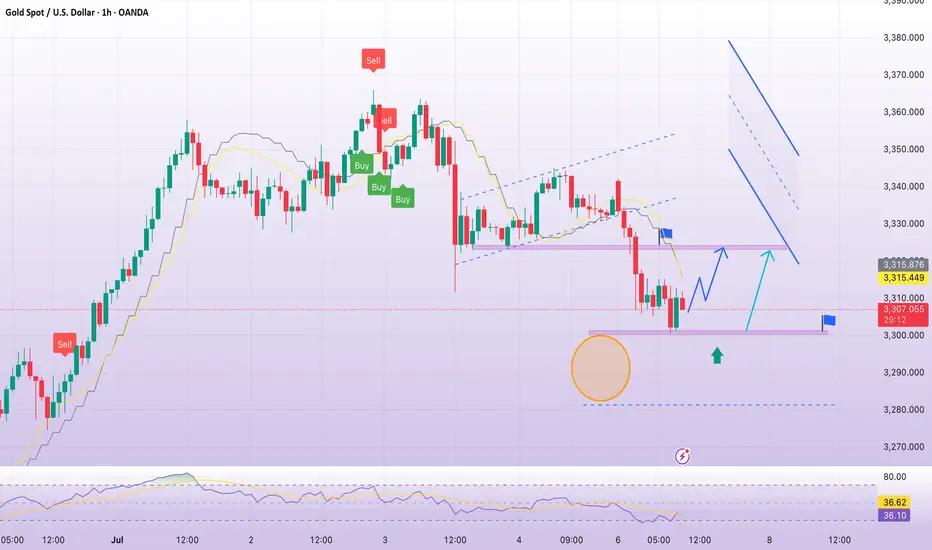
Selling pressure, gold downtrendPlan XAU day: 09 July 2025
Related Information:!!!
Gold (XAU/USD) continues to extend its decline on Wednesday for a second consecutive session, as the US Dollar (USD) and US Treasury yields strengthen ahead of the release of the Federal Open Market Committee (FOMC) Meeting Minutes.
The US Dollar Index (DXY) has climbed to a two-week high, exerting downward pressure on XAU/USD, which has fallen below the $3,300 level at the time of writing.
The forthcoming release of the FOMC Minutes from the June meeting is anticipated to provide insight into the Federal Reserve’s internal discussions regarding the future course of monetary policy.
In June, the central bank chose to maintain its benchmark interest rate within the 4.25% to 4.50% range, citing continued labor market resilience and persistent inflationary pressures.
personal opinion:!!!
Gold price is in the accumulation zone below 3300, big selling pressure. Pay attention to selling gold according to the trend line 3294
Important price zone to consider : !!!
support zone point: 3274; 3252 zone
Sustainable trading to beat the market

sell signal at the beginning of the week, downward pressurePlan XAU day: 07 July 2025
Related Information:!!!
Gold prices (XAU/USD) maintain an intraday bearish bias during the first half of the European session, although the precious metal has managed to rebound from the $3,300 level—its lowest point in a week, recorded earlier on Monday. A notable uptick in demand for the US Dollar (USD) has emerged as a primary factor diverting flows away from gold. However, increasing market consensus that the US Federal Reserve (Fed) is likely to implement further interest rate cuts this year may temper bullish sentiment toward the USD and offer some support to the non-yielding yellow metal.
Additionally, concerns surrounding former President Donald Trump’s substantial tax-cut and spending proposals—seen as potentially exacerbating the United States’ long-term debt challenges—may also act as a constraint on USD strength. Meanwhile, overall market sentiment remains fragile due to ongoing uncertainty linked to Trump's unpredictable trade policies. Furthermore, renewed Israeli airstrikes on Yemen—the first in nearly a month—have dampened investor appetite for riskier assets, further helping to limit downside pressure on gold and warranting a cautious approach from bearish traders.
personal opinion:!!!
Gold price adjusts and accumulates around 3300 before tariff policies this week, gold recovery opportunity
Important price zone to consider : !!!
Resistance point: 3324 zone
Sustainable trading to beat the market
Selling pressure, gold price falls below 3300Plan XAU day: 24 June 2025
Related Information:!!!
Gold price (XAU/USD) maintains a heavily bearish tone during the first half of the European session and is currently trading just above the nearly two-week low reached earlier this Tuesday. News of a ceasefire between Iran and Israel has boosted investor confidence and triggered a fresh wave of global risk-on sentiment, which is seen as a key factor driving funds away from the safe-haven precious metal.
Meanwhile, the intraday decline appears largely unaffected by continued US Dollar (USD) selling, which would typically support gold prices. Mixed US PMI data and dovish comments from Federal Reserve officials have fueled speculation about a possible rate cut in July. As a result, the USD has fallen to a more than one-week low, which could offer some support to gold ahead of Fed Chair Jerome Powell’s upcoming testimony.
personal opinion:!!!
Strong selling pressure, gold price continues to be under downward pressure. War negotiation information is becoming an obstacle causing gold price to drop sharply.
Important price zone to consider : !!!
BUY point: 3304; 3293 zone
Sustainable trading to beat the market

EURUSD ShortNOTE - Analysis done on 5 min time-frame
Based on the previous analysis of mine, I shared two levels. One for support and one for resistance. Price is now around resistance level and we have seen a change of character. Also price is reversing from a key Fibonacci level. Price broke a trend line and did a retest at key Fibonacci level.

Nifty 50: READY FOR Correction/ Crash!Attached: Nifty 50 Daily Chart as of 7th July 2023
Price has closed below PDL marking the End of the 5 wave rise that makes up either the 3rd Wave or the C Wave
In both case, whether it is there 3rd or the C Wave, post completion of a 5 wave impulse be it whatever degree of the wave, there has to be a Retracement at the very least
Price has 2 downsides going as per the Retracement:
Target 1= 19200 (Gap Area)
Target 2= 19030 (Super Trend Support)
On further break below 18975, the Downside can accelerate to fill the 3rd Gap @ 18815
Last Line of Support is 18640....

Bajaj Auto Formed Shooting starBearishness appears overpowering the stock fueled by weak sales data for entire Q4, when compared to YTD.
6th April's candle indicating bears in power with long wick, which is also coinciding with Harmonic Potential Reversal Zone with some buffer points.
With Above the High of 6th April as SL, downside moves may be witnessed on chart in coming sessions.
Let's see.

Rising Wedge PatternRising Wedge pattern on the 15 minute timeframe, most likely to follow the trend pattern.
#Bitcoin #BTC #BTCUSD

Manappuram Fin - Short in 1hr TF if it breaks the support levels🔴DISCLAIMER
***** It's just for an educational purpose, So you must also follow your own technical analysis before taking up the trades ******
Aggressive traders enter at the breakout and conservative traders may give entry after retracement (Retracement is optional, we cannot expect every stock to take a retest after the breakout, it may also continue to have its bullish pressure after the breakout)
Ideal Target and Stop Loss should be minimum 1:2 RRR (Risk reward ratio)
After reaching our targets, Book 50% Profits and trail your stop loss to get maximum profits from rest of the 50% in your trade.

COH SHORT SWING TRADEmest capital indicator has generated an alert of going "SHORT" for COH "COCHLEAR LTD. " Australia
Happy trading 🙏

Nifty on decline. Following wave pattern
Nifty is in 5th wave (drawn in orange).
Nifty completed all 4 waves fully and have taken the last wave which should move it to 15500-15800 level.
Nifty should reach this level somewhere in between May 09 and June 06 2022.
Inside wave of this 5th wave is drawn in blue. As per that the current upmove of Nifty should take it to 17400-17460 and then the decline should continue.
Disclaimer: This is just my view on Nifty. I'm not a registered advisor on market analysis. The idea is published only to spread my views on Nifty and gather feedback to cultivate healthy discussions. Please do your due diligence before investing your money. Remember, you're responsible for your investments.

SELL PVR BELOW 1610PVR has given breakdown of a bearish pattern known as ASCENDING WEDGE.
The measured targets can be upto 1450 but 1550 is a hurdel to cross as it is supported by 200 ma on a 4 hour timeframe.
RSI is weak
MACD below the signal line.
SELL BELOW - 1610
Targets mentioned in the chart above.
Please LIKE, COMMENT and SHARE to motivate and support me. I'll keep on posting new ideas on Indices & Stocks. Be sure to follow so that you don't miss any good trades that might have been rewarding.
Any comments and critiques will be appreciated even if it's of opposite view as a trader can also be right so many times.

SHORT - TATA STEELExcellent Shorting opportunity in NSE:TATASTEEL ,
as metal sector looks weak for next few weeks, it will be safe initiate a short trade in TATA STEEL.
ENTRY : Below 1220
SL : 1270
TARGET : 1180/1130/1100
NOTE :This post is just for educational purpose. Do consult with your financial advisor before taking any trade.
Thank you.


PVRNO INCOME, MORE AND MORE FUND RISING IN ONE OR THE OTHER FORM....MAYBE CAN HIT A NEW LOW IF IT GOES IN THIS WAY


Market Crashing ALERT !!!! SHORT NIFTY & DON'T INVESTHii
This is trader Kanishk
Today NIFTY ant the INDIAN ECONOMY
This is a crashing ahead. Watch full analysis and take it seriously please.
SHORT NIFTY
DON'T INVEST
This is not the right time to invest.
This is the time for traders
we can earn only by short selling.
Thank you.

Sell now & buy stocks on Diwali 2020, Nifty analysis Multi-frameNifty multi time frame analysis.The nifty look very weak in coming months. Very good level to convert portfolio to cash / exit positions / profit booking.
Or if buying is done this level it should be done with proper hedging with PUT option/ Gold.
The charts are pretty self explanatory with comments at each points.
Weekly chart analysis of Nifty
On March 16th nifty has broken (9500) very crucial support coming from major trend line since 2009 after it made bottom of (7500), yesterday it has tested support (9500) become resistance (9500). With these nifty will see having selling from here and will continue its downtrend.
Daily chart analysis of Nifty
The downtrend will emerge soon, what we have seen on weekly chart. On Daily chart we are seeing flag and pennant pattern in downtrend (powerful pattern) pennant is a consolidation zone and we are at the end of consolidation meaning soon we will see down turn and new bottoms. (Another way to look, flag can be seen as Elliot wave A, pennant wave B, and Wave C is coming)
After seeing down force and long term/ Mid term charts analysis we will see nifty will take support somewhere between 6326 and 4773. It will depend on how things will turn out in future and how much force it goes down with.
I hope this analysis will help. If you agree with analysis hit like, and Its ok to disagree. Please help me with comment below either way. :)
-Ankit Salgia

IndusInd bank levels IndusInd bank now bearish till 430-440 range , below that may be a good fall.
Close above 490-500 can be a long breakout towards 550.
Trade can be taken accordingly for May 550CE or MAY450PE

TCS in its final exhaustive upmove towards 2280 TCS in its exhaustive upmove and we may witness a sharp decline from 2280 levels in coming days....if this happens we can witness 2030 levels soon.....Respect Risk.....Happy Trading
