Gold (XAUUSD) Rejects 4470 Resistance – Short-Term Sell SetupGold (XAUUSD) has shown a clear rejection from the 4470 resistance zone, signaling potential short-term exhaustion after the recent rally.
This area has acted as a strong supply zone, increasing the probability of profit booking / corrective pullback before any continuation to the upside.
📉 Trade Idea:
Look for sell opportunities in the 4462 – 4472 zone, aligning with the marked resistance and price rejection.
Targets and risk levels are clearly outlined on the chart.
⚠️ This is a counter-trend / pullback trade, best suited for intraday or short-term traders. Manage risk accordingly.
📌 Disclaimer:
This analysis is for educational purposes only and is not financial advice. Always manage risk and follow your trading plan.
Your feedback drives our content and keeps everyone trading smarter. Let’s make those pips together! 🚀
Happy Trading,
– The InvestPro Team
Shortterm

HDFC BANK LTD PARALLEL CHANNEL BREAKOUTHDFC BANK was traded in channel from past few years and made a breakout with good volume. Entry price at ₹990, with a STOPLOSS ₹940 and TARGET ₹1,190

Glance Finance Expected UpsideGlance Finance is moving in uptrend with slow consolidation. I see consolidation is Broken is previous week opening. Now can expect upside rally in short term. Can move close to 500, 550....
Please do your own research too and take decision.

UNIONBANK | Cup & Handle breakout aheadUNIONBANK | Cup & Handle breakout ahead
CMP : 149
Something interesting is coming up from this counter

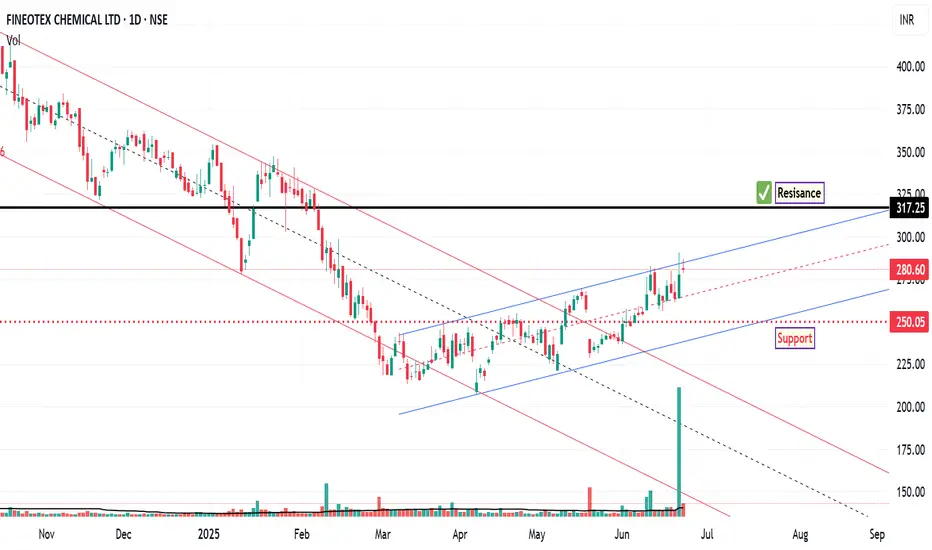
FCL: Technical Setup Signals 10% Upside Potential
The chart of FCL outlines key price levels that represent potential breakout zones, signaling shifts in market momentum. It also identifies critical support areas where buying interest may emerge, offering insight into potential entry points.
Additionally, resistance zones are clearly marked, indicating probable barriers to upward price movement. These levels are instrumental in formulating strategic entry and exit decisions based on anticipated market behaviour.
Disclaimer:
This technical analysis is provided for informational and educational purposes only. It does not constitute financial advice or a recommendation to buy or sell any security. Investors should perform their own due diligence and consult with a licensed financial advisor before making any investment decisions.
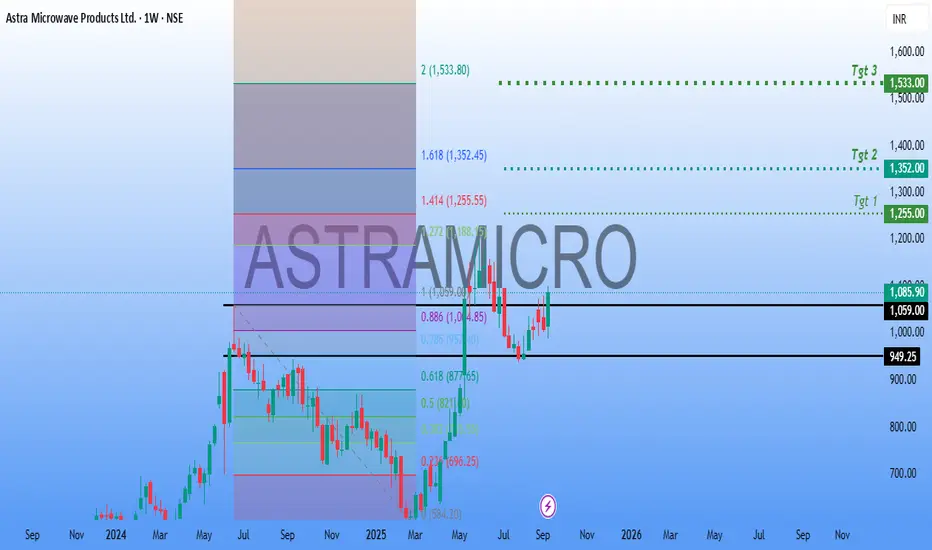
ASTRAMICROAnother #Defense #Stock in focus.
#ASTRAMICRO has a strong Technical Structure. Made a neat #breakout and consolidating at the Breakout levels.
Neat #Buyondips stock for #Short to #Longterm #Investment.
Targets in Chart.
Hitech Pipes Long
📊 Hi-Tech Pipes Ltd (NSE: HITECH) – Weekly Technical Analysis
The stock has witnessed a prolonged downtrend from its highs and recently formed a strong bullish reversal candle, signaling a potential short-term trend reversal. Key indicators are also turning positive, supporting the possibility of an upward move.
🔎 Technical Observations
Price Action:
After a steep fall from ~₹140 levels, the stock took support near ₹88–90.
A strong green weekly candle has appeared with good momentum, suggesting renewed buying interest.
RSI has bounced from oversold territory, indicating strength.
MACD has shown a bullish crossover, with the histogram turning green, confirming momentum shift.
The recent bullish candle was backed by higher-than-average volume, a sign of accumulation.
📌 Trading Plan
Entry Zone: ₹95 – ₹102
Stop-Loss: ₹88 (weekly close basis)
Target 1: ₹110 – ₹115
Target 2: ₹125 – ₹130
Target 3: ₹140 – ₹145
⚠️ Key Notes
Sustaining above ₹115 with strong volume will be crucial for further upside.
Since the broader trend is still weak, treat this as a pullback rally until the stock closes above ₹130+.
Booking partial profits at each target level is advised to protect gains.
📢 Conclusion
Hi-Tech Pipes Ltd is showing early signs of a reversal after a long decline. The combination of price action, momentum indicators, and support zone bounce makes it an attractive short-term opportunity. However, strict stop-loss management is necessary given the prior downtrend.

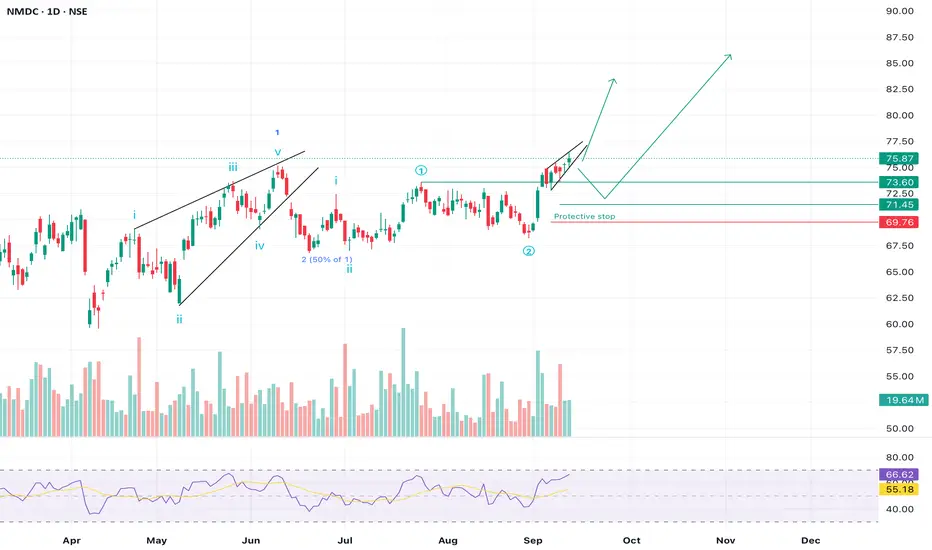
NMDC setting the stage for RALLYNMDC looks to be setting up for a potential impulsive rally after completing a corrective wave. The structure suggests strength, with protective levels clearly defined.
🧩 Elliott Wave Structure
• We can see a completed 5-wave move up earlier this year (Wave 1).
• That was followed by a healthy correction (Wave 2), which retraced close to 50% of Wave 1 — a textbook retracement zone.
• Now, price action is forming a new Wave 3 setup, which tends to be the strongest move in Elliott Wave cycles.
📈 Key Levels to Watch
• Current Price: ₹75.87
• Immediate Support: ₹73.60 – ₹73.37 zone
• Protective Stop: ₹71.45 (below recent swing low, Wave 2 invalidation area)
• Upside Path: If price sustains above ₹76, we may see a quick move towards ₹80–82 first, and eventually ₹85+ in the coming weeks.
🔍 Technical Indicators
✅ RSI is rising and trading around 66, showing bullish momentum but still shy of overbought levels.
✅ Moving averages are sloping upward, supporting the bullish bias.
✅ Volume spikes on green candles indicate strong participation from buyers.
📊 Possible Scenarios
1. Bullish Continuation: A breakout above ₹76 could trigger momentum buying, leading to higher targets quickly.
2. Pullback Before Rally: Price may retest the ₹73–74 zone before resuming the uptrend — a healthy retest would make the rally stronger.
Protective stop is marked near ₹71.45. If price falls below this, it may indicate that the wave structure has failed, and deeper correction could follow.
⸻
Disclaimer:
This analysis is for educational purposes only and not investment advice. Please consult a SEBI-registered financial advisor before making any trading or investing decisions.
Zyduslife - Near Breakout LevelsCMP 1013.85 on 07.09.25
All important levels are mentioned on the chart.
For a year, the level of 1030 has been acting as a resistance zone.
The price has formed a Cup & handle pattern. Presently nearing the level of breakout.
If it sustains above 1030, it will gain strength.
If it sustains below 980-970, the setup will weaken, and the exit plan should be exercised.
Possible targets are 1120/1170+.
All these illustrations are only for educational and sharing purposes. It should not be considered as a buy or sell recommendation.
All the best.

Ather Energy Ltd (ATHERENERG) – Technical AnalysisPrice Action
Current Price: ₹441–445 (as of August 29, 2025)
Up ~2–2.6% today, nearing 52-week highs.
Momentum & Indicators
Likely above key moving averages — bullish momentum.
RSI may be elevated — watch for overbought conditions.
ADX suggests trend strength is building.
Substantial volume backing price movement.
Chart Structure
Resistance zone: ₹450–451 (52-week high)
Support zones: ₹440, then ₹430–435
Upside targets: ₹470 → ₹480+ on breakout
Invalidation: Drop below ₹430 weakens bullish setup.
Trading View Bias
Bias: Bullish as long as price stays above ₹430
Short-Term Target: ₹450 → ₹470
Medium-Term Target: ₹480+
Invalidation Level: Close below ₹430 shifts to caution.
Disclaimer: This is a technical analysis for educational purposes only—not financial advice. Always perform your own due diligence before trading.

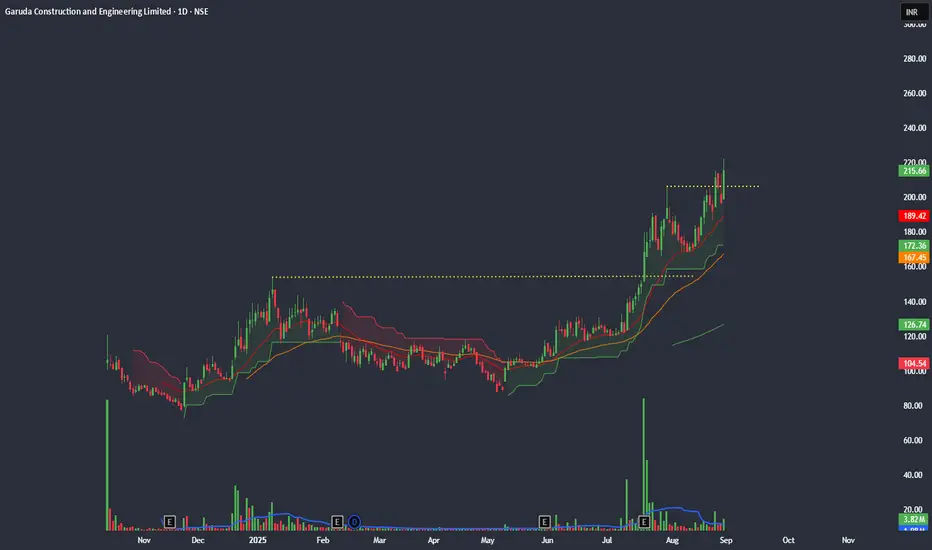
Garuda Construction & Engineering Ltd (GARUDA) – TechnicalPrice Action
Current Price: ~₹215.5 (as of August 29, 2025)
Snapped up nearly +9–10% today, breaking to fresh 52-week highs.
Indicators & Momentum
Likely traded above major moving averages.
RSI probably in overbought territory — caution warranted.
ADX likely above 25 — confirming trend strength.
Volume spike (~3.6M shares) supports the breakout.
Chart Structure
Broke resistance at ~₹200–210; price nearing ₹222–225 zone.
Support zones:
Short-term: ₹210–212
Strong: ₹200
Upside targets: ₹225 → ₹230; potential rally to ₹240+.
Trading View
Bias: Bullish as long as price stays above ₹210.
Short-Term Target: ₹225 → ₹230
Medium-Term Target: ₹240+
Invalidation: Close below ₹200 weakens bullish thesis.
Disclaimer: This is a technical overview for informational and educational purposes only—not investment advice. Please conduct your own research before trading.
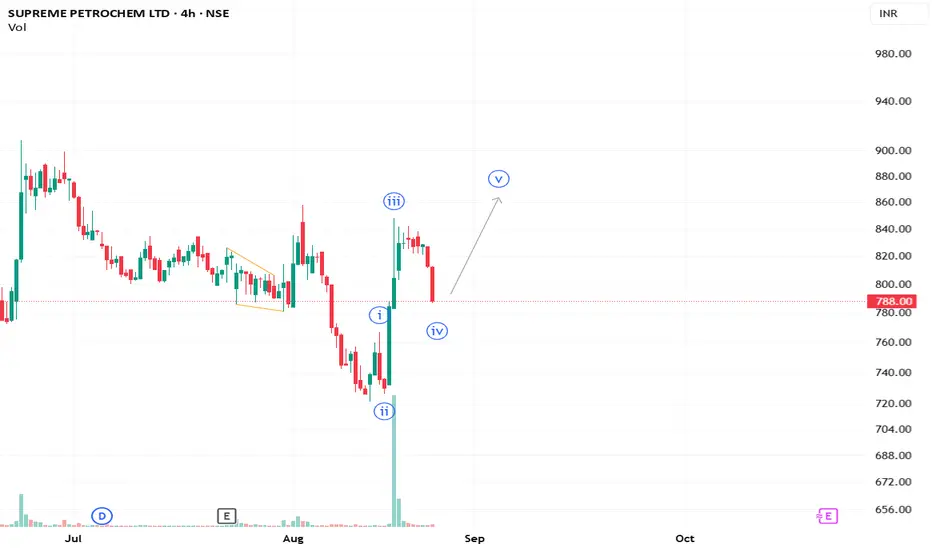
Supreme Petrochem Ltd – Possible 5-Wave StructureThe chart is forming a 5-wave pattern. After the Wave (iii) rally and current Wave (iv) correction, the next move could be an upward push into Wave (v).
**This is an educational market outlook, not investment advice. Please consult a SEBI-registered advisor before taking any investment decisions.**
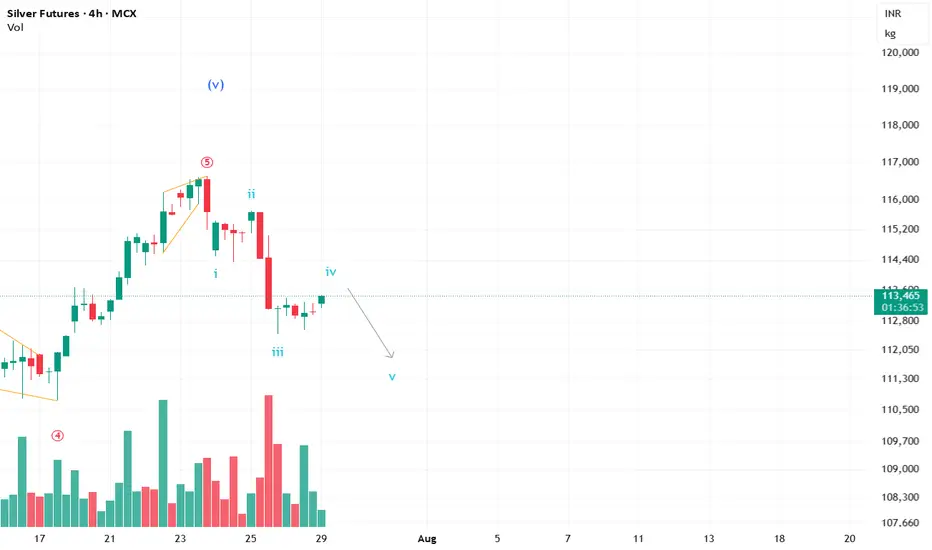
#Silver up for another short sell move?Silver is currently completing the 4th wave and may witness a down move in the short term. Keeping my eyes glued. :)
**This is an educational market outlook, not investment advice. Please consult a SEBI-registered advisor before taking any investment decisions.**
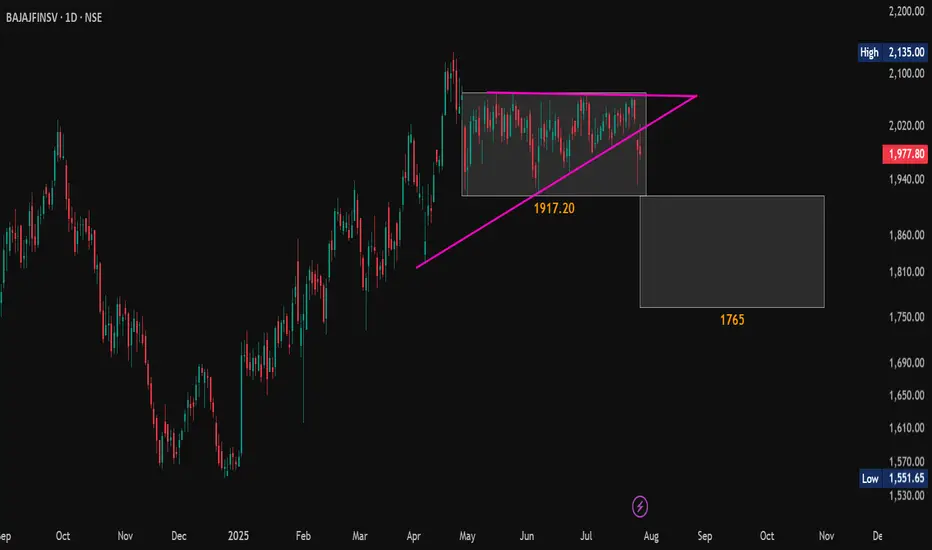
Triangle Fails, Box Awaits – What's Next for #BajajFinsv?🔍 #OnRadar
#BajajFinsv
📉 Technical View:
Bajaj Finserv has been consolidating between 1917 – 2071 for the past 3 months, forming a Box Pattern and an Ascending Triangle .
An Ascending Triangle breakdown occurred on Friday with a gap-down move. Today, the stock retested the breakdown level and resumed its fall.
🔸 Key Support: 1917.20 (Box Pattern lower boundary)
🔸 A daily close below 1917.20 may confirm a Box Pattern breakdown
📌 Target (Post Breakdown): 1765
(~10% downside from current level)
⚠️ This is a technical analysis update for educational purposes only. Not a buy/sell recommendation. Please consult your financial advisor before making any trading decisions.
#TechnicalAnalysis | #BoxPattern | #ChartAnalysis | #ShortTerm
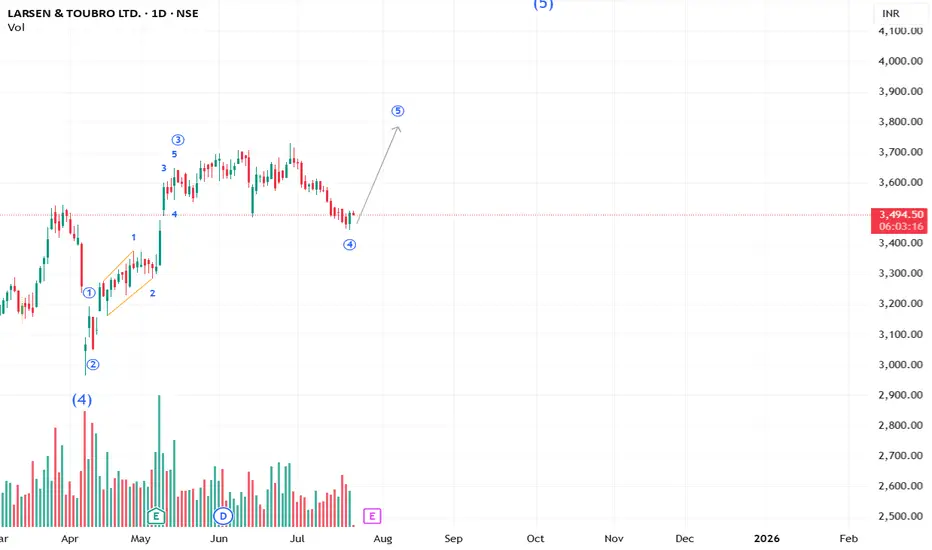
The last move on the way in LT? #LT We may see an upside in LT to finish the last wave 5 to go above 3732. Don't risk more than 2% of your capital on any trade.
**This analysis is based on the Elliott Wave Principle.
This analysis is for educational purposes only and not investment advice.
Please consult your SEBI-registered advisor before making any investment decisions. Markets are subject to risk.**
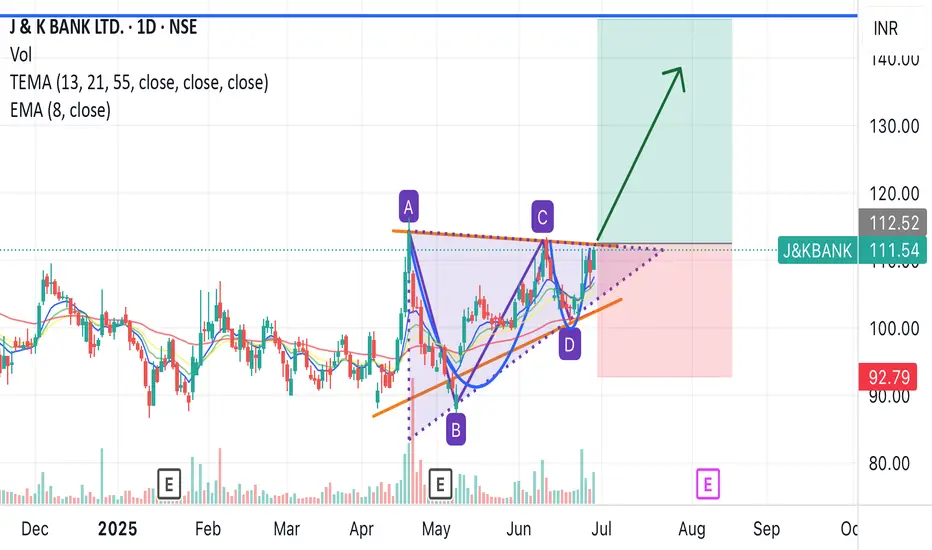
J&k Bank nearing breakout with triangle, and also. Up and handleJ&k bank nearing breakout according to triangle, and cup and handle pattern.
Entry - around 111
Target - 145
Duration- 2-3 months
With good fundamentals
Tata steel cup Handle breakoutTata steel cup and handle breakout and the price is near resistance also with support coming close to the resistance suggesting possible breakout.
Buy around - 160
Target - 180 (13%)
Duration - 1 month
Tata steel have good fundamentals and showing breakout possibility

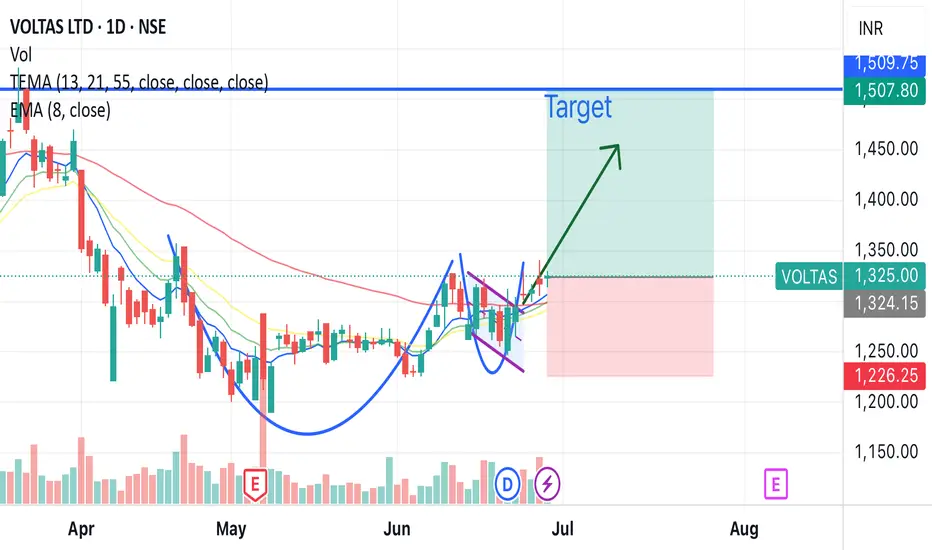
Voltas breakout soon cup and handle patternVoltas will soon be flying, cup and handle breakout pattern, pattern is very prominent, high chances of breakout in short term 15% profit.
Also reaching golden crossover
Buying range - 1310 - 1330
Target - 1507 (15%)
Hold duration - 1-2 month
Voltas belongs to Tata groups and have good fundamentals.
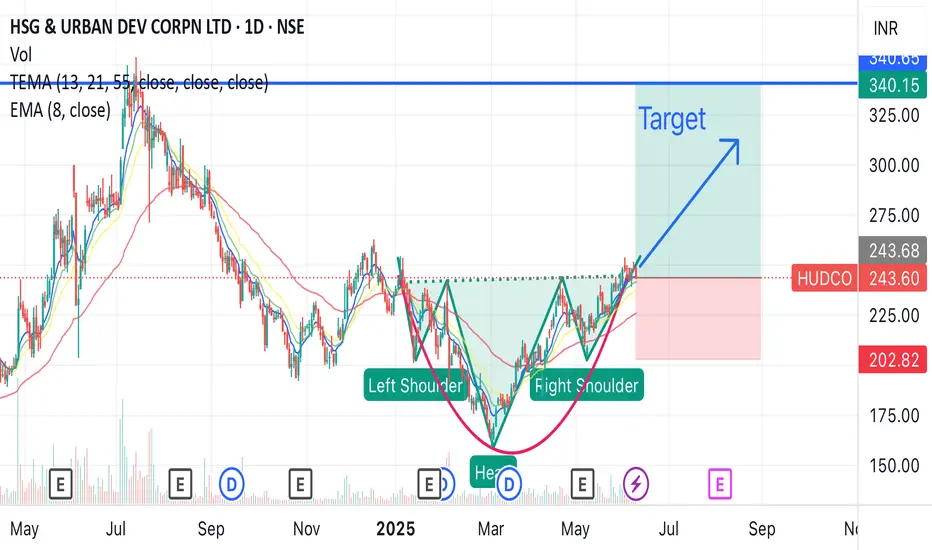
HUDCO head and shoulder breakoutHUDCO is great stock with good fundamentals, giving head and shoulder breakout soon in short term with 35% upside
Buy at - 243
Target - 340
Hold duration - 1 to 2 months
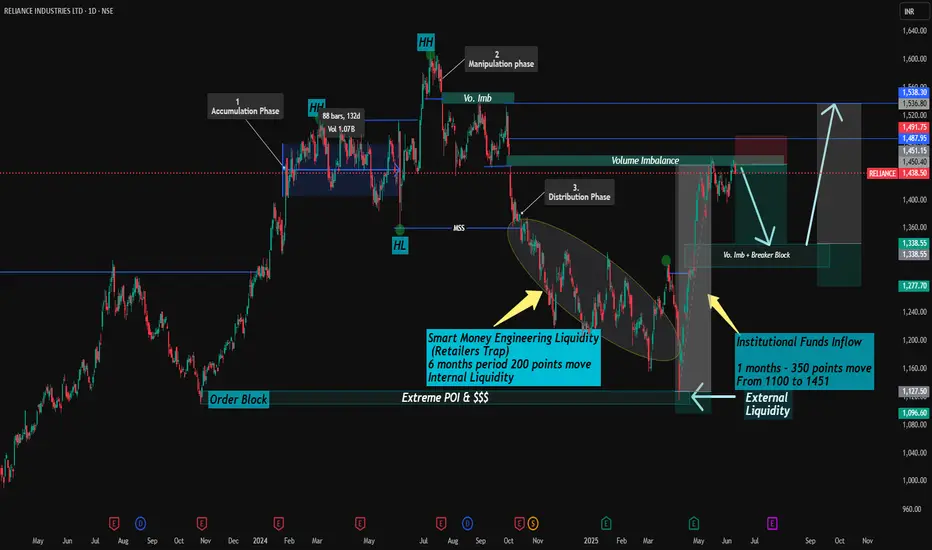
Reliance industries ltd. Deep AnalysisSharing my Analysis on Reliance (RIL). (Only for Education Purpose)
This analysis is based on Higher Time Frame (Daily)
Past Move scenario ----
1. If we see on chart, after 3rd oct. 2024, Price has completed major liquidity sweep below internal lows followed by Market Structure Shift (Marked as MSS) and for that it took 6 months.
2. After that External liquidity sweep been performed near to 1100 levels which is also marked as Extreme POI which triggered an impulse move of 350 points with funds inflow which pushed price to 1451 levels. (Here it just took 1 months only)
Current Move Scenario ----
===upside there we saw volume imbalance + Breaker block where price is making resistance or rejecting upside move.
(Potential Short Term Supply Zone 1450-1488 levels)
Expected Short Term Bias ---
Downside levels --- 1335 (Breaker Block + Discount Zone)
Upside Resistance ---- Cross of Order block range 1496
Expected Long Term Bullish Bias -- Likely after Retracement to downside Vo. Imbalance and + Breaker block
Re-Entry Long Zone - 1335-1350
Upmove expected to 1500 Imbalance levels
above that Final External Liquidity zone to 1560
Steps --- Accumulation ---Expansion ---Re accumulation, targeting External Liquidity.
Everything mentioned on chart itself.
{Above Views are only for Education purpose and do not consider it as any Advisory. Consult your Financial Advisor before investments in any securities.}
YOur Views or Comments are Welcomed.
BEPL Breakout soonBEPL about to breakout with 16% profit in short term with triangle pattern and also 55 ema has crossed 8,13,21 ema which shows strong uptrend on moving average
Hold duration around 1-2 month
Entry - 117
Target -138
Stock has good fundamentals
So I suggest to buy BEPL Bhansali eng. Polymers LTD

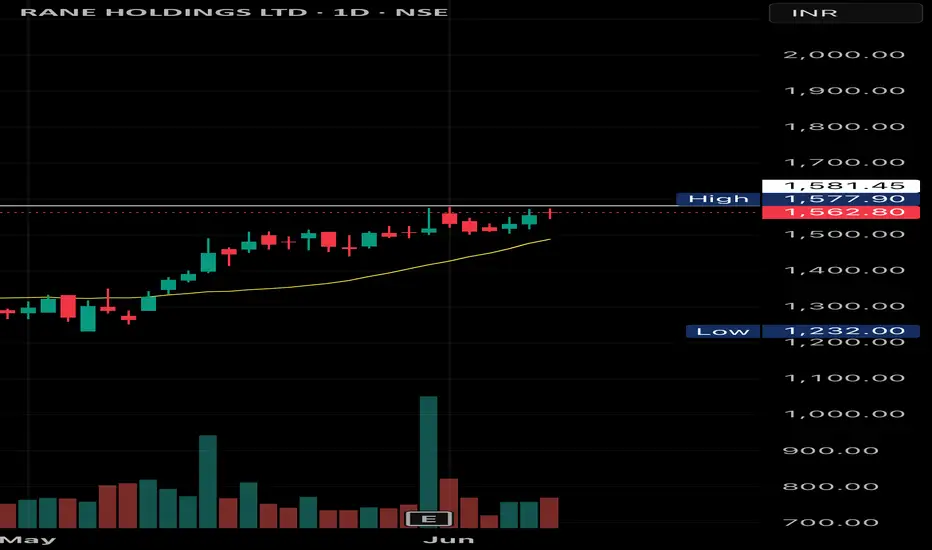
RANE HOLDING SWING TRADE SETUPRane holding swing trade setup. Breakout soon possible, can be a good breakout above 1581 and stop loss Below 1544. Analyse yourself before entry
Share your view on this
CARERATING | Channel + Flag breakout with 200 EMA supportCARERATING | Channel + Flag breakout with 200 EMA support
High probable setup
CMP : 1237
SL : 1150
Target : 1550
