Buy APL Apollo TubesShort Term Trading Advice by Goodluck Capital
Buy APL Apollo Tubes
● Buy Range- 1940 - 1960
● Target- 2060 - 2080
● StopLoss- below 1890
● Upside Potential- 6% -7%
● Approx trade duration 12 - 14 days
Shorttermtrading

Buy Multi Commodity Exchange of IndiaShort Term Trading Advice by Goodluck Capital
Buy Multi Commodity Exchange of India
● Buy Range- 10475 - 10575
● Target- 11000 - 11200
● StopLoss- below 10180
● Upside Potential- 5% -6%
● Approx trade duration 12 - 14 days

BPCL Breaks Structure, Big Targets Ahead: Long-Term Chart TurnsBPCL is currently positioned at a highly important zone on the higher-timeframe chart where price is attempting to shift from a prolonged consolidation into a potential expansion phase. The stock has respected a long-term structure and is now trading near a critical breakout region, making it an interesting candidate for positional and long-term traders. However, the setup is still in the developing stage and requires confirmation before any aggressive long exposure.
From a structure perspective, BPCL has formed a broad base after a long corrective phase. Price action is compressing near the upper boundary of this range, suggesting that volatility expansion could occur in the coming sessions. A sustained move above the key resistance zone, accompanied by strong volume and follow-through candles, would indicate strength and increase the probability of an upside continuation toward higher targets.
In the bullish scenario, a confirmed breakout and successful retest could open the path for a gradual move toward the next resistance cluster. If momentum sustains, the stock may attempt a trend continuation move in phases rather than a straight rally. Positional traders should focus on price holding above the breakout level on closing basis, as this will be the primary sign of trend acceptance by the market.
On the other hand, if BPCL fails to break and hold above the resistance zone, the stock may slip back into its previous consolidation range. In such a case, sideways or corrective movement cannot be ruled out, and premature long positions may face drawdowns. A deeper rejection from resistance would indicate that buyers are not yet in control.
Risk management remains crucial in this setup. Since the breakout is not yet confirmed, any long exposure should be planned only after clear confirmation, with a strict stop loss below the invalidation zone. This approach helps protect capital while allowing participation in the upside if the breakout sustains.
Overall, BPCL is at a decisive technical juncture. The chart structure favors a bullish bias in the medium to long term, but confirmation is key. Traders and investors should remain patient, track price behavior around the breakout zone, and act only when the market clearly validates the move.

Angel One on the Edge: Long-Term Chart Points to 4800+The monthly chart of Angel One shows a well-defined broadening wedge pattern, where price has been repeatedly oscillating between a rising support line and a widening resistance zone. The structure has been forming for almost two years, indicating a long consolidation phase after a strong uptrend. Currently, the price is trading near the lower trendline support, which aligns with the long-term uptrend support. This zone is marked as the Buying Zone, suggesting that the risk-reward ratio is favourable for long-term buyers as long as the support remains intact.
A potential breakout above the upper wedge resistance may trigger a strong upside rally. The first major level on the upside is the Reversal Target around 3050, which is the initial confirmation level. If price sustains above this, the momentum may carry it towards the Breakout Target near 3500, which represents the first official breakout swing. Once this level is surpassed, the trend may accelerate towards Target 2 around 3900, indicating continuation of the long-term bullish structure. The complete projected move from the pattern height signals a Final Projected Target around 4840, which is the long-term positional upside expectation.
On the downside, the setup remains valid only while the price trades above the lower trendline region. A sustained close below the marked failure level would invalidate the pattern, signalling potential weakness and a breakdown of the long-term bullish structure. However, until that failure zone is breached, the pattern continues to favour a bullish breakout scenario with upward projections as highlighted.

SchaefflerInd - Technical Analysis#Schaeffler India - Technical Analysis Report
Current Price: 4,141.10 / Prev ATH @4951.
Trade Setup Overview
Basic Dow Theory : Stock is making Higher High - Higher Low by Breaking previous ATH decisively and stock is down to strong Demand Zone for retracement.
Stock is in consolidation before breaking previous ATH & currently forming Flag & Pole Pattern.
Entry on breakout above resistance 4,200-4,300
Conservative Stop Loss at 3,800 | Tight SL near 4,000
Tgt 1: 4,602
Tgt 2: 4,776
Tgt 3: 5,026
Grand Flag & Pole Target: 5,495.
Technical Highlights:
- Trend Reversal confirmed by breaking previous High on May 2025 around 2,800
- Price consolidating after strong recovery rally
- Trading above key moving averages
- Breakout above 4,300 resistance could trigger momentum toward 4,600 / 5495
Risk-Reward:
Favorable R:R with potential 11-33% upside vs 3-8% downside to stop loss levels.

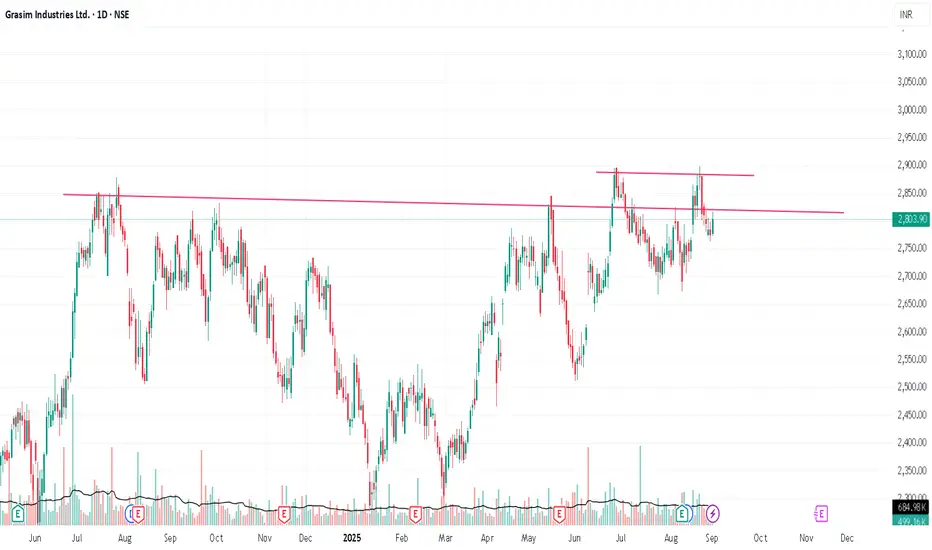
Flexing at All Time HighGrasim broke a cup & handle pattern and came down, again trying to break another trendline at top of the cup & handle pattern. if it breaks and sustain above the latest breakout with good volume, it'll move up for sure.
***This is only for educational purposes***
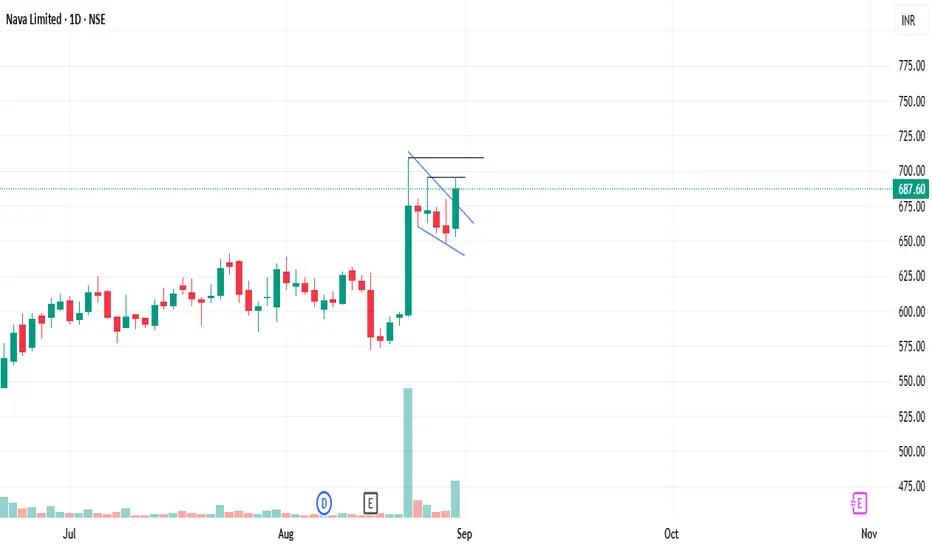
"NAVA" A Pole & Flag pattern breakout on 1day chart Stock name:- Nava on 1day chart price formed a pole and flag pattern and on 29-aug-2025 price breakout and sustained above and closed which simply means price is ready to move up but there's a immediate resistance at "696" once price breaks it then 710 is our next resistance and there's possibility of 3 scenarios 1.price breaking high and going up till 740-765 level. 2.price breaking high and then take resistance and fall below 700 level & stay in a range then decide the move. 3.price taking resistance at 710 then fall till 660.
for Monday i.e. 1-sep-2025 if price opens gap up wait till 10:15am then on hourly chart see candle then take trade, if flat opens then wait for price to cross 696 level then trade but with less quantity as 700 is psychological round level and 710 a previous high so price can form a big candle & break previous high then fall & retest then go up, so be cautious a little and once price goes up we can add quantity, if gap up price take resistance from 710 and closes below 675 then a fall till 660 can be seen.
for investment/swing trade once price goes above 710 then add up quantity as price can go up till 740-765 in 1st level then to 780 in next tgt level.
Disclaimer:- i'm not a sebi registered analyst and idea shared here is my personal view point which includes various technical indicators and i don't have any investment in this scrip nor do i have any contact with employees of the company the idea shared is for educational purpose so before taking any trade or investment pls consult with your financial advisor.
JSW-INFRA : Powering India’s Port Revolution – A Deep Dive into NSE:JSWINFRA
JSW Infrastructure Ltd.
🧾 Company Overview
Role: JSW Infrastructure is India's second-largest commercial port operator (after Adani Ports), and forms a core part of the JSW Group.
Operations: The company manages and operates major ports across both the east and west coastlines of India.
Revenue Streams: Primarily driven by port operations (handling bulk, breakbulk, containerized cargo), as well as integrated logistics services.
📊 FY24 Financial Snapshot
Revenue ₹3,200+Cr
EBITDA Margin 55–60%
Net Profit ₹750+Cr
Debt to Equity ~0.6x
ROCE ~15%
ROE ~13%
Positive aspects:
Asset Turnover Strong
Double-digit revenue CAGR (>20%) over the past three years.
High EBITDA margins consistent with best-in-class infra businesses.
Well-diversified cargo and customer profile, with increasing non-JSW business.
Stable long-term contracts & beneficiary of India’s logistics and trade reforms.
Risks / Weaknesses:
~70% revenue is from group companies, though diversification is underway.
Aggressive capex plans elevate financial risk.
Susceptible to regulatory, tariff, and environmental compliance changes.
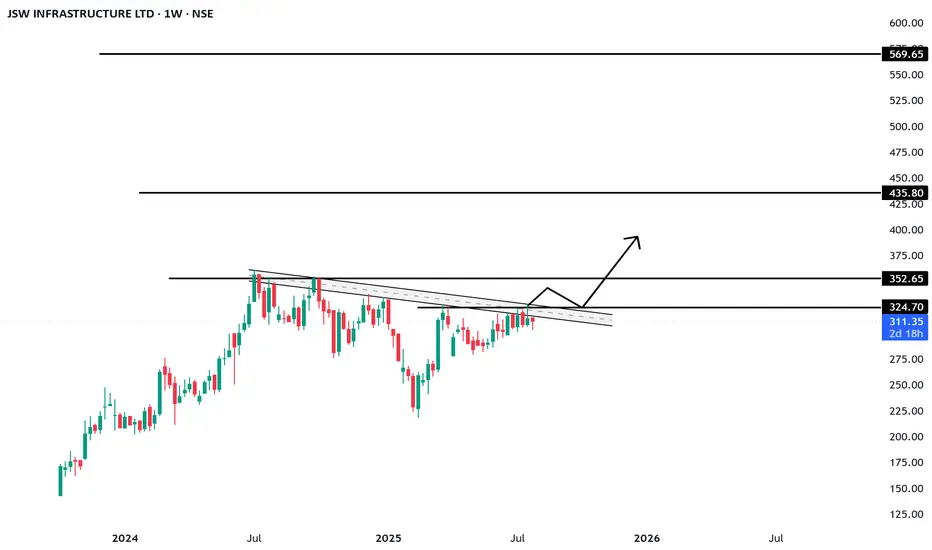
📈 Technical Analysis (July 2025)
• Share Price: Trading in the ₹260–₹280 range. IPO was at ₹119 (Sep 2023); strong price appreciation since listing.
• Trend: Intact uptrend; recently consolidated between ₹240–₹260.
• Support/Resistance: Key support at ₹230–₹235; resistance at ₹285–₹300.
• Moving Averages: Stock remains above both its 50-EMA and 200-EMA — a structurally bullish indicator.
• Momentum:
o RSI: 60–65 (bullish, but approaching overbought)
o MACD: Fresh bullish crossover; volume shows accumulation near breakout.
• Outlook: Breakout above ₹285 could trigger medium-term upside toward ₹320–₹340. Buy-on-dips is favored, with strong accumulation likely in the ₹230–₹240 zone.
🚀 Growth Prospects & Strategic Moves
• Capacity Expansion: Plans to nearly double port capacity by FY30 (from ~160 MTPA to ~300 MTPA).
• Cargo Diversification: Targeting major reduction of group dependency (from ~70% to ~50%) by growing third-party cargo traffic.
• New Projects: Investment pipeline includes both greenfield and brownfield projects in Odisha, Maharashtra, and other states.
• Integrated Logistics: Deeper backward integration into rail connectivity and warehousing to capture higher value from logistics value chain.
• Macro Tailwinds
o Major government initiatives (e.g., Sagarmala) catalyzing sector growth.
o India’s trade/exports rising; strong outlook for cargo and container volumes.
o Shifts in supply chains to coastal shipping and blended logistics.
o Demand uptrend in containerization and warehousing services.
⚠️ Key Risks & Limitations
• High Capex Cycle: Expansion could elevate debt and financial leverage.
• Macro Sensitivity: Lower industrial/output growth would hit cargo volumes.
• Regulatory Overhang: Tariff and ESG regulations present chronic uncertainty.
• Group Concentration: Third-party cargo growth remains an execution challenge.
• Rivalry: Competitive intensity from Adani, DP World, and others is ramping up.
📌 Conclusion & Investment Verdict
Parameter Verdict
Fundamentals Strong, superior margins, efficient operations
Valuation Fair to premium (due to uptrend and growth)
Technical Trend Bullish, ready for potential breakout
Growth Outlook High (supported by sector tailwinds)
Risk Profile Moderate (driven by capex & regulatory factors)
For long-term investors:
JSW Infra presents a compelling case for portfolio inclusion, offering robust growth visibility, sectoral leadership, and operating excellence. Accumulation is best near ₹230–₹240 on dips.
Short-term view:
Stocks in strong uptrends may see minor corrections but are well-placed for fresh breakouts above ₹285, targeting ₹320–₹340.
The stock is ideal for investors seeking infrastructure-sector exposure with high growth potential, but one must remain mindful of execution and regulatory risks.
==============================
==============================
⚠️ Disclaimer:
This analysis is for educational and informational purposes only.
We are not SEBI-registered analysts or advisors.
This is our personal view based on available data and market trends.
Please consult your SEBI-registered investment advisor before making any investment or trading decisions.
You are solely responsible for any financial decisions you make based on this content.
========================
Trade Secrets By Pratik
========================
Update idea
Add note
Trade_Secrets_By_Pratik
Also on:
Disclaimer
The information and publications are not meant to be, and do not constitute, financial, investment, trading, or other types of advice or recommendations supplied or endorsed by TradingView. Read more in the Terms of Use.
English (India)
Select market data provided by ICE Data services.
Select reference data provided by FactSet. Copyright © 2025 FactSet Research Systems Inc.
© 2025 TradingView, Inc.
More than a product
Supercharts
Screeners
Stocks
ETFs
Bonds
Crypto coins
CEX pairs
DEX pairs
Pine
Heatmaps
Stocks
ETFs
Crypto
Calendars
Economic
Earnings
Dividends
More products
Yield Curves
Options
News Flow
Pine Script®
Apps
Mobile
Desktop
Tools & subscriptions
Features
Pricing
Market data
Trading
Overview
Brokers
Special offers
CME Group futures
Eurex futures
US stocks bundle
About company
Who we are
Athletes
Blog
Careers
Media kit
Merch
TradingView store
Tarot cards for traders
The C63 TradeTime
Policies & security
Terms of Use
Disclaimer
Privacy Policy
Cookies Policy
Accessibility Statement
Security tips
Bug Bounty program
Status page
Community
Social network
Wall of Love
Refer a friend
House Rules
Moderators
Ideas
Trading
Education
Editors' picks
Pine Script
Indicators & strategies
Wizards
Freelancers
Business solutions
Widgets
Charting libraries
Lightweight Charts™
Advanced Charts
Trading Platform
Growth opportunities
Advertising
Brokerage integration
Partner program
Education program
Look First
HDFC BANK LTD
NSE•Real-time•Market closed
Edit Idea
Minimize
Close
JSW INFRA : Powering India’s Port Revolution – A Deep Dive into
NSE:JSWINFRA
JSW Infrastructure Ltd.
🧾 Company Overview
Role: JSW Infrastructure is India's second-largest commercial port operator (after Adani Ports), and forms a core part of the JSW Group.
Operations: The company manages and operates major ports across both the east and west coastlines of India.
Revenue Streams: Primarily driven by port operations (handling bulk, breakbulk, containerized cargo), as well as integrated logistics services.
📊 FY24 Financial Snapshot
Revenue ₹3,200+Cr
EBITDA Margin 55–60%
Net Profit ₹750+Cr
Debt to Equity ~0.6x
ROCE ~15%
ROE ~13%
Positive aspects:
Asset Turnover Strong
Double-digit revenue CAGR (>20%) over the past three years.
High EBITDA margins consistent with best-in-class infra businesses.
Well-diversified cargo and customer profile, with increasing non-JSW business.
Stable long-term contracts & beneficiary of India’s logistics and trade reforms.
Risks / Weaknesses:
~70% revenue is from group companies, though diversification is underway.
Aggressive capex plans elevate financial risk.
Susceptible to regulatory, tariff, and environmental compliance changes.
📈 Technical Analysis (July 2025)
• Share Price: Trading in the ₹260–₹280 range. IPO was at ₹119 (Sep 2023); strong price appreciation since listing.
• Trend: Intact uptrend; recently consolidated between ₹240–₹260.
• Support/Resistance: Key support at ₹230–₹235; resistance at ₹285–₹300.
• Moving Averages: Stock remains above both its 50-EMA and 200-EMA — a structurally bullish indicator.
• Momentum:
o RSI: 60–65 (bullish, but approaching overbought)
o MACD: Fresh bullish crossover; volume shows accumulation near breakout.
• Outlook: Breakout above ₹285 could trigger medium-term upside toward ₹320–₹340. Buy-on-dips is favored, with strong accumulation likely in the ₹230–₹240 zone.
🚀 Growth Prospects & Strategic Moves
• Capacity Expansion: Plans to nearly double port capacity by FY30 (from ~160 MTPA to ~300 MTPA).
• Cargo Diversification: Targeting major reduction of group dependency (from ~70% to ~50%) by growing third-party cargo traffic.
• New Projects: Investment pipeline includes both greenfield and brownfield projects in Odisha, Maharashtra, and other states.
• Integrated Logistics: Deeper backward integration into rail connectivity and warehousing to capture higher value from logistics value chain.
• Macro Tailwinds
o Major government initiatives (e.g., Sagarmala) catalyzing sector growth.
o India’s trade/exports rising; strong outlook for cargo and container volumes.
o Shifts in supply chains to coastal shipping and blended logistics.
o Demand uptrend in containerization and warehousing services.
⚠️ Key Risks & Limitations
• High Capex Cycle: Expansion could elevate debt and financial leverage.
• Macro Sensitivity: Lower industrial/output growth would hit cargo volumes.
• Regulatory Overhang: Tariff and ESG regulations present chronic uncertainty.
• Group Concentration: Third-party cargo growth remains an execution challenge.
• Rivalry: Competitive intensity from Adani, DP World, and others is ramping up.
📌 Conclusion & Investment Verdict
Parameter Verdict
Fundamentals Strong, superior margins, efficient operations
Valuation Fair to premium (due to uptrend and growth)
Technical Trend Bullish, ready for potential breakout
Growth Outlook High (supported by sector tailwinds)
Risk Profile Moderate (driven by capex & regulatory factors)
For long-term investors:
JSW Infra presents a compelling case for portfolio inclusion, offering robust growth visibility, sectoral leadership, and operating excellence. Accumulation is best near ₹230–₹240 on dips.
Short-term view:
Stocks in strong uptrends may see minor corrections but are well-placed for fresh breakouts above ₹285, targeting ₹320–₹340.
The stock is ideal for investors seeking infrastructure-sector exposure with high growth potential, but one must remain mindful of execution and regulatory risks.
==============================
==============================
⚠️ Disclaimer:
This analysis is for educational and informational purposes only.
We are not SEBI-registered analysts or advisors.
This is our personal view based on available data and market trends.
Please consult your SEBI-registered investment advisor before making any investment or trading decisions.
You are solely responsible for any financial decisions you make based on this content.
========================
Trade Secrets By Pratik
========================

Get VINCOFE for Big Upside in Short termTake entry at cmp 144
Invest More at 111
Target will be 180 ( 25% upside)
We set minimum target for short term...if you hold it for next 2 years then it can be give 100% return

BHARAT FORGE LTD. – INTRADAY ZONE ANALYSIS________________________________________________________________________________
📈 BHARAT FORGE LTD. – INTRADAY ZONE ANALYSIS
📆 Date: July 1, 2025 | ⏱ Timeframe: 15-Minute Chart
🔍 Educational Breakdown – For Learning & Study Use Only
________________________________________________________________________________
🔹 Price Action Zones
🔴 Top Range(Resistance): 1324.50
🟢 Bottom Range(Support): ₹1270
⚪ No Trade Zone: Mid-range, no clear directional bias
________________________________________________________________________________
🧩 Chart Pattern: No
There is no visible or marked chart pattern (e.g., flag, triangle, head and shoulders) on the chart.
________________________________________________________________________________
🔁 Reversal Candlestick Patterns:
🔴 Top Range: No visible reversal candle pattern at the supply zone on this chart snapshot, but the area has been marked for potential rejection.
🟢 Bottom Range: No textbook reversal candlestick (like pin bar, hammer, or engulfing) is clearly visible at ₹1270. However, the price bounced strongly from this level, indicating possible short-term support or buyer interest.
________________________________________________________________________________
🧠 1. Trade Plan (Based on Reason and Logic)
🔼 Bullish Trade:
Idea: If price retests ₹1270 and forms a bullish structure (strong bullish candle, reversal candles, volume support, long wick)
Stop Loss: Below ₹1269
Risk-Reward: 1:1 | 1:2+
Logic: you need to give an actual logic to this
________________________________________________________________________________
🔽 Bearish Trade:
Idea: If price rejects 1324.50 and forms a bearish structure (strong bearish candle, reversal candles, volume support, long wick)
Stop Loss: ₹1325
Risk-Reward: 1:1 | 1:2+
Logic: Historically rejected area as marked on chart.
________________________________________________________________________________
📦 2. Trade Plan Based on Demand/Supply Zones
🟥 Supply Zone Trade:
Zone: ₹1293.30 – ₹1299.90
SL: ₹1301.45
Plan: Trade the Supply Zone (only on rejection confirmation)
Risk-Reward: 1:1 | 1:2+
🟩 Demand Zone: No defined demand zone.
________________________________________________________________________________
📌 Disclaimer
This analysis is shared for educational and study purposes only. It does not constitute investment advice. The author is not SEBI-registered. Please consult a SEBI-registered advisor before making trading decisions. Always use proper risk management and trade only with confirmation.
________________________________________________________________________________
💬 Comments
What’s your view on Bharat Forge?
Will it reject from the supply zone or hold the bottom range?
Share your charts or thoughts below 👇
________________________________________________________________________________

GALLANTT ISPAT LTDGALLANTT - The stock is currently in a rising channel pattern, with consolidation near a key resistance level forming a potential bullish flag continuation pattern. If the stock sustains above 485, it could trigger a move towards 525 and 565.

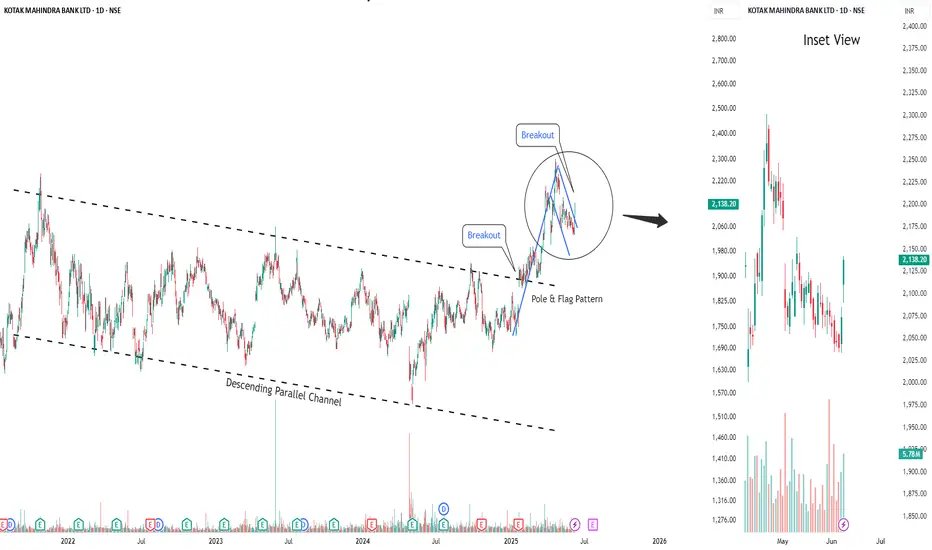
Buy Kotak Mahindra Bank Short Term Trading Advice by Goodluck Capital
Buy Kotak Mahindra Bank
Buy Range- 2100 - 2135
Target- 2200 - 2225
StopLoss- below 2060
Upside Potential- 4% -5%
Approx trade duration 7 - 8 days
NAVA LTDNAVA - Nava Limited exhibits strong technical indicators with a bullish bias,
If the stock price manages to break through the 500 level, it could potentially reach targets of around 533 and then 565.

Buy Venus Remedies Short Term Trading Advice by Goodluck Capital
Buy Venus Remedies
Buy Range- 423 - 438
Target- 470 - 480
StopLoss- below 406
Upside Potential- 9% -11%
Approx trade duration 12 - 14 days

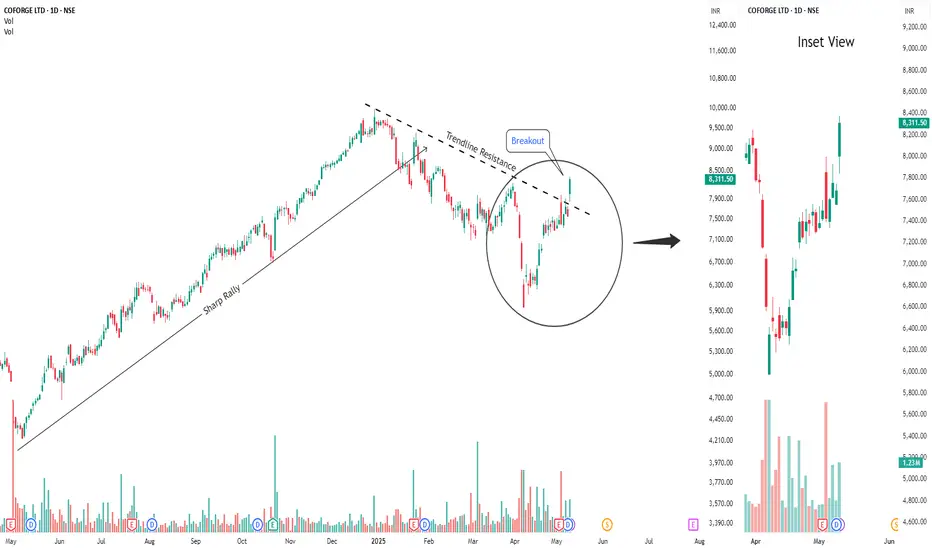
Buy Coforge Short Term Trading Advice by Goodluck Capital
Buy Coforge
Buy Range- 8000 - 8200
Target- 8750 - 8850
StopLoss- below 7700
Upside Potential- 8% -9%
Approx trade duration 14 - 15 days
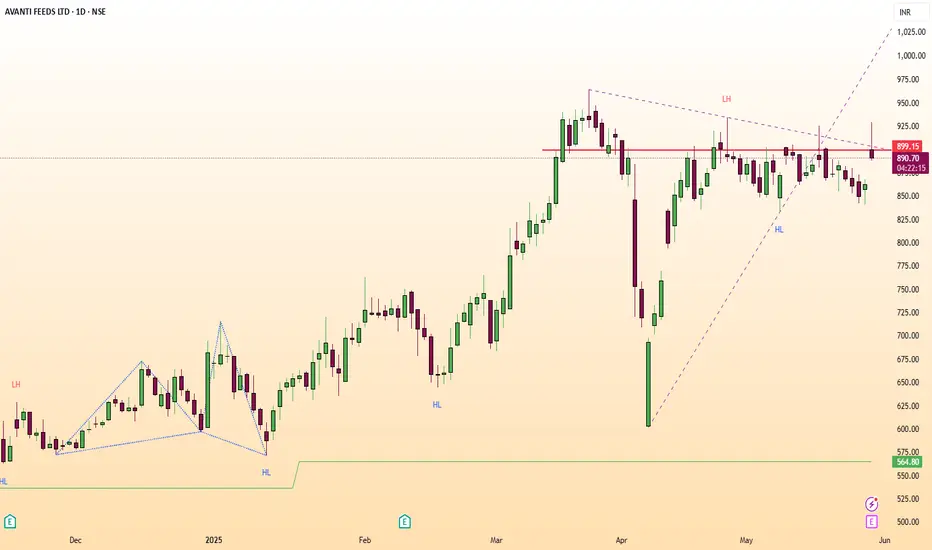
AVANTIFEED Breakout StockGood Above 900 on Closing Basis.
For Educational Purpose only.
Rationale:-
Volume:
Volume is greater than previous session by 848.49%.
Volume is greater than last 10 sessions average volume.
Volume is greater than last 10 sessions volume. That is a high volume.
Highest volume marked in last 20 sessions. That is a volume spurt.
Volatility:
ATR% of the stock is 3.96%
Average of last 20-day is 4.33%
Moving Average Observations:
Price remains above 200-day Moving average.
Price went above 50-day Moving average in the current session, it is a bullish crossover.
Price above 50-day, 100-day and 200-day Moving average.
Moving average alignment is bullish. It is an uptrend & a bullish setup.
RSI Observations:
The Daily RSI indicator has crossed above 50 in the current session. Current Daily RSI reading is 56.32.
The Weekly RSI indicator has remained above 50. This is a bullish zone. Current Weekly RSI reading is 60.34.
The Monthly RSI indicator has remained above 70. Current Monthly RSI reading is 72.59.
ADX Observations:
The Daily DMI position turned bullish. Its a bullish crossover.
The Daily ADX went up by 4.34%. Current ADX reading is 10.76.
The Daily distance between DMI lines is 28.43%.
The Weekly DMI position remains bullish.
The Monthly DMI position remains bullish.
Donchian Channel Observations:
Price is above middle Donchian channel (Bullish).
Price is at Upper Donchian channel band.
Upper band is rising. 20-day new high marked.
Difference between bands is 11.53%.
Ichimoku Observations:
Price above Ichimoku clouds.
Clouds are bullish.
Tenkan line went above Kinjun line in current session. Bullish crossover.
Tenkan line is above Kijun line. Ichimoku setup is bullish.
Current cloud range is 1.25% and Future cloud range is 11.34%.
Bollinger Band Observations:
Price is above middle Bollinger band (Bullish).
Price is above Upper Bollinger band.
Bands are expanding.
Difference between bands is 6.05%.
Buy Premier Explosives Short Term Trading Advice by Goodluck Capital
Buy Premier Explosives
Buy Range- 444 - 466
Target- 520 - 540
StopLoss- below 400
Upside Potential- 15% -20%
Approx trade duration 20 - 25 days

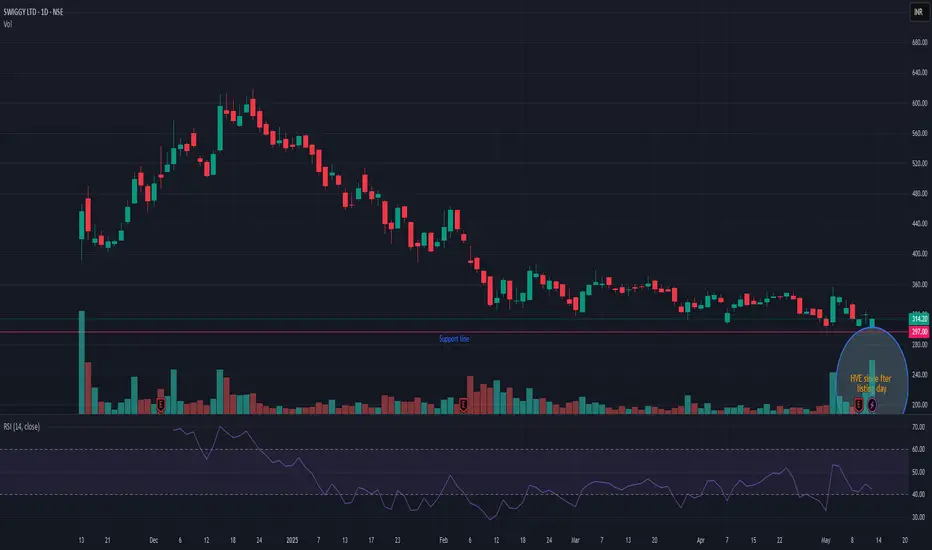
SWIGGYSWIGGY is showing highest ever volume after listing day. Forming a base pattern with volume. Now if if doesn't break today's low then this may be considered as a short term bottom. So no 297 is a key support are. Though for a momentum play its closing above 330 is v crucial. But if above all conditions satisfied then definitely is may prove to be a good trade in coming days.
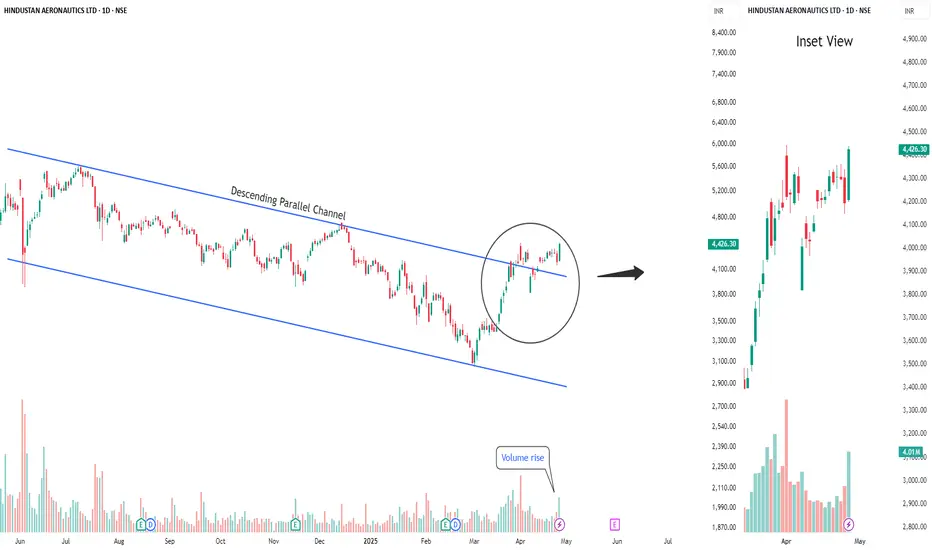
Buy Hindustan Aeronautics Limited Short Term Trading Advice by Goodluck Capital
Buy Hindustan Aeronautics Limited
Buy Range- 4250 - 4400
Target- 4600 - 4700
StopLoss- below 4100
Upside Potential- 6% -9%
Approx trade duration 14 - 15 days
Buy Data Patterns India Limited Short Term Trading Advice by Goodluck Capital
Buy Data Patterns India Limited
Buy Range- 2075 - 2222
Target- 2475 - 2550
StopLoss- below 1944
Upside Potential- 15% -20%
Approx trade duration 20 - 25 days

Indhotel ready for big rally again.If ind hotel holds this position above 810. it should go very high from these levels.
800 is short term stoploss and target 900.

SANDUMA-Positional Long trade-Swing tradeStock has rejected trendline multiple times. In next 1-2 session if it holds above 450 and breakout the trendline with bullish candle. Good opportunity to go long.
If it falls below 450, avoid.
Please don't forget click on follow button so you won't miss any upcoming ideas.
Any confusion, feel free to drop msg. Happy to help :)
This is only for educational purpose, please manage your risk accordingly.
