SIEMENS: High-Volume Bullish Reversal Breakout________________________________________
💹 Siemens Ltd (NSE: SIEMENS)
Sector: Capital Goods | CMP: 3232.60 | View: High-Volume Bullish Reversal Breakout
Chart Pattern: Falling Wedge
Candlestick Pattern: Bullish Marubozu
Swing High: 3368
Swing Low: 2925
________________________________________
HNI Trade Analysis:
Bullish Breakout Zone: 3232.6 - 3242
Stop Loss: 3094.44
Low-Risk Entry Zone: 3205
Stop Loss: 3051.17
A decisive wide-range bullish candle with extremely high volume signals aggressive institutional accumulation. Price has broken above the recent micro-range, validating the bullish retracement reversal.
________________________________________
STWP Trade Analysis:
Breakout Level: 3242
Stop Loss: 3094.44
Structure: Strong Bullish Candle + High Volume + Reversal Confirmation
Note: Multi-day compression has triggered a high-probability expansion phase.
________________________________________
Resistances: 3285.27 | 3337.93 | 3433.87
Supports: 3136.67 | 3040.73 | 2988.07
________________________________________
STWP Stock Analysis (Brief Synopsis):
Siemens has delivered a powerful bullish reversal breakout after weeks of consolidation and downward drift, confirmed by a strong Marubozu candle supported by 1.56M volume, significantly above the average. Price has cleanly broken above its short-term declining trendline, reclaiming key levels with strong momentum. RSI has moved into a balanced-to-bullish zone near 62, MACD has triggered a fresh bullish crossover, and Stochastic signals sustained buyer strength.
The breakout also aligns with a Bollinger Band expansion, indicating volatility release from a low-compression phase. Multiple bullish triggers are present simultaneously — RSI breakout, EMA compression to expansion shift, ADX improvement, and volume surge — all hinting that institutional activity is backing the move.
Fibonacci retracement zones remain supportive, with price reclaiming the 23.6% (3029) and 38.2% (3094) levels and heading toward 61.8% (3198) and 78.6% (3273), which aligns with the current price zone.
Trend-wise, intraday timeframes (5m–1H) are fully bullish, while the daily timeframe has turned upward after a prolonged downtrend. The weekly remains corrective but improving. As long as Siemens sustains above 3136–3040, the bullish continuation bias stays intact.
Overall, Siemens now reflects a strong reversal breakout, backed by unusually high volume, renewed momentum, and multi-indicator convergence, favouring continuation toward upper resistance bands.
________________________________________
Final Outlook:
Momentum: Strong
Trend: Bullish (Short-Term) | Improving (Medium-Term)
Risk: Low
Volume: Very High (Institutional Footprints)
________________________________________
⚠️ Disclosure & Disclaimer – Please Read Carefully
The information shared here is exclusively for learning and educational purposes. This is not investment advice and should not be considered a buy or sell recommendation.
I am not a SEBI-registered investment adviser. All views are based purely on chart analysis and publicly available market data.
Financial markets involve risk, and traders must assess their own risk tolerance before taking any trade. Please consult a SEBI-registered financial adviser for investment decisions.
________________________________________
Position Status: No active position in (SIEMENS) at the time of analysis.
Data Source: TradingView & NSE India (Past Chart Reference).
________________________________________
💬 Found this useful?
🔼 Boost this post to help more traders learn structured price-action analysis.
✍️ Share your views or setups in the comments — let’s grow as disciplined traders.
🔁 Forward this to fellow learners who want clean technical frameworks.
👉 Follow for more high-quality, structured STWP breakdowns.
________________________________________
🚀 Stay Calm. Stay Clean. Trade With Patience.
Trade Smart | Learn Zones | Be Self-Reliant 📊
________________________________________
Siemenschartanalysis

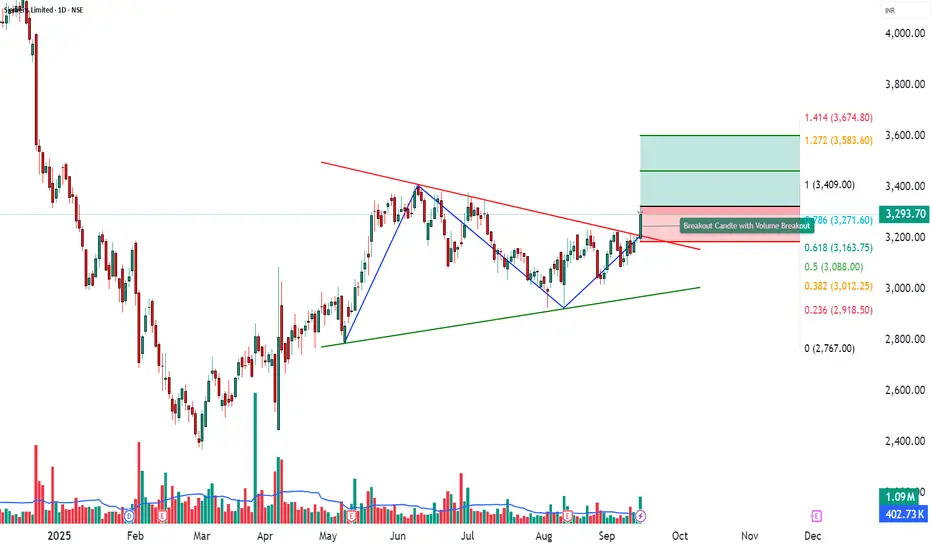
SIEMENS Analysis | Symmetrical Triangle Breakout Explained📊 SIEMENS Trade Analysis
🔎 Price Action
SIEMENS closed at ₹3293.7 with a solid +2.86% gain, backed by a volume of 10.95 lakh, well above its 20-day average of 4.02 lakh (VolX = 3.03x).
This sharp rise in activity highlights strong institutional participation, confirming bullish momentum and improving probability of continuation.
________________________________________
📉 Chart Signals – Symmetrical Triangle
Strong bullish candle backed by heavy volumes.
RSI breakout supporting positive momentum.
Bollinger Band squeeze + breakout → signals volatility expansion.
________________________________________
📍 Key Levels
Resistance: 3349 – 3404 – 3484
Support: 3214 – 3134 – 3079
________________________________________
📈 Investment Outlook
📈 Bullish Case – Why the stock could go up
Strong volume-led breakout (VolX = 3.03x).
Momentum indicators (RSI 62, CCI 193, Stochastic 89) suggest upside strength.
Sustained buying pressure may push stock toward ₹3464 – ₹3602.
📉 Bearish Case – Potential downside risks
Failure to sustain above ₹3325 could trigger profit booking.
Global or market-wide weakness may drag stock back toward supports.
Break below ₹3214 could shift bias to downside.
⚡ Momentum Case – Short-term Trading Edge
Volume surge + RSI breakout confirm short-term momentum.
Bollinger squeeze → strong volatility expansion.
Holding above 3349–3404 may open upside toward ₹3464–₹3602.
📅 Short-term vs Long-term Perspective
Short-term (1–2 weeks): Momentum-driven moves likely; watch resistances at 3349–3484 and supports at 3214–3134.
Long-term (1–3 months): Stock remains in an uptrend; sustained buying with strong volumes could establish higher base levels.
________________________________________
📝 STWP Trade Analysis
Outlook: Momentum: Strong, Trend: Bullish
Entry: 3325 – 3293.75 | Stop-loss: 3186.05
Target-1: 3463.95 | Target-2: 3602.9
Risk/Reward: 1:3.27 | Risk: Low | Volume: High
Demand zone: 3212 - 3181.50 | SL: 3177.50 - Could be a good Pullback zone
Learning Note: SIEMENS shows strong momentum with volume breakout; supports and resistances clearly define near-term trade zones.
________________________________________
⚠️ Disclaimer – Please Read Carefully
The information shared here is meant purely for learning and awareness. It is not a buy or sell recommendation and should not be taken as investment advice. I am not a SEBI-registered investment advisor, and all views expressed are based on personal study, chart patterns, and publicly available market data.
Trading — whether in stocks or options — carries risk. Markets can move unexpectedly, and losses can sometimes exceed the money you have invested. Past performance or past setups do not guarantee future results.
If you are a beginner, treat this as a guide to understand how the market works — practice on paper trades before risking real money. If you are experienced, always assess your own risk, position sizing, and strategy suitability before entering trades.
Consult a SEBI-registered financial advisor before making any real trading decision. By engaging with this content, you acknowledge full responsibility for your trades and investments.
💬 Found this useful?
🔼 Give this post a Boost to help more traders discover clean, structured learning.
✍️ Drop your thoughts, questions, or setups in the comments — let’s grow together!
🔁 Share with fellow traders and beginners to spread awareness.
👉 “If you liked this breakdown, follow for more clean, structured setups with discipline at the core.”
🚀 Stay Calm. Stay Clean. Trade With Patience.
Trade Smart | Learn Zones | Be Self-Reliant 📊
SIEMENS LTD. – INTRADAY ZONE ANALYSIS________________________________________
📈 SIEMENS LTD. – INTRADAY ZONE ANALYSIS
📆 Date: July 1, 2025 | ⏱ Timeframe: 15-Minute Chart
🔍 Educational Analysis for Learning Purposes Only
________________________________________
📊 Zone Breakdown:
• 🔴 Top Range Resistance – 3,271.90
Marked in Red: This is a clearly defined supply zone where the price faced sharp rejection after testing highs. Bearish opportunity zone if a reversal pattern appears — watch for signs like bearish engulfing, double top, or rising volume + long upper wicks.
• 🟠 No Trade Zone – Around 3,225–3,260
Marked in Orange: This range has seen volatile, choppy action without clear bias. Traders may avoid fresh positions here unless directional strength emerges with volume confirmation.
• 🟢 Demand Zone – 3,182.60 to 3,165 | SL: 3,160.35
Marked in Green: Price reversed sharply from this area in the past with strong bullish candles. Acts as a low-risk buying area on retest with bullish confirmation. Risk-managed entries possible here.
• 🟩 Bottom Support – 3,101.10
Marked in Dark Green: Crucial structural support zone. Breakdown below this level could change the short-term trend to bearish. Currently a “last line of defense” for bulls.
________________________________________
🔍 Candlestick & Chart Pattern Observation:
✅ Bearish Rejection Near Top Zone:
A strong upper rejection candle (long wick) appeared right at the top resistance (3,271.90), followed by consistent lower highs and lower closes. This confirms seller presence. No double top yet, but early signs of a potential short-term top formation are visible.
✅ Bullish Reversal from Demand Zone:
The candle near 3,170 zone shows a sharp bullish engulfing move on higher volume — signaling potential institutional interest. This zone has repeatedly offered bounce opportunities.
📉 Volume Clue:
Volume expanded during the bounce from demand zone and tapered near resistance — confirming participation during dips and caution near highs.
________________________________________
⚙️ Educational Trade Ideas (Study Purpose Only)
▶️ Reversal Setup – Bearish Bias
• Entry: Below 3,245 on bearish continuation candle
• Stop Loss: Above 3,272 (Top Range)
• Risk-Reward: 1:1 | 1:2+
________________________________________
🧠 Ideal for studying exhaustion after a resistance test and confirmation through lower highs.
▶️ Pullback Setup – Bullish Bias
• Entry: Between 3,170–3,182 (Demand Zone)
• Stop Loss: 3,160.35
• Risk-Reward: 1:1 | 1:2+
🧠 Classic demand zone bounce setup. Strong volume + engulfing candle supports bullish case.
________________________________________
⚠️ Disclaimer (SEBI-Compliant):
This content is strictly for educational and informational purposes. It is not investment advice or a recommendation to buy/sell any securities. Always consult a SEBI-registered financial advisor before making any financial decisions.
STWP | Learn. Trade. Grow.
________________________________________
💬 Do you think the top is strong enough for a short? Or will bulls take control at demand again?
Drop your thoughts and analysis below ⬇️
________________________________________

Cup & Handle Breakout + Golden Cross Confirms Bullish Megatrend Timeframe: Daily
Ticker: NSE:SIEMENS
🔥 Key Technical Setup:
Cup & Handle Pattern:
Cup Depth: ~1026 points
Breakout Level: 3414 (multi-touch resistance).
Golden Cross Confirmation: 50 EMA crossed above 200 EMA (bullish long-term momentum shift).
Volume & Price Confirmation:
- Entry Trigger: Close above 3414 with a strong green candle + above-average volume (min. 1.5x 20-day avg volume).
- False Breakout Filter: Volume must surge to validate breakout.
🎯 Trade Strategy:
Entry Zone: 3415–3430 (after confirmed breakout).
Stop Loss: 3169 (swing low of the handle, below key support).
Target 1: 3750
Target 2: 4170
Final Target: 4455 (cup depth projected from breakout: *3414 + 1026 = 4440–4455*).
The trade targets 4455, but reaching this level will take time—patience is key as price works through resistance at 3750 and 4170.
📉 Price Action Mantra:
“Price absorbs all noise! Trade the CHART, not the news.”
📊 Why This Works:
1. Golden Cross Amplifies Momentum: Post-crossover, rallies average +25% in trending stocks.
2. Cup & Handle Statistics: 85% success rate when volume confirms breakout.
3. Volume Divergence: Declining volume in handle + surge on breakout = institutional accumulation.
⚠️ Risk Management:
Position Size: Risk ≤1% capital per trade.
Trailing SL: Move SL to 3300 after Target 1 (3750) hit.
Partial Exit: Book 50% at 3750, 25% at 4170, hold 25% for 4455.
🧠 Psychology & Market Structure:
Resistance Levels to Watch:
3750: Profit-taking zone.
4170: Key options barrier (break = accelerated FOMO).
Support Floor: 3200–3169 (must hold to preserve structure).
Set alerts, follow volume, and let price lead the way!
📌 Disclaimer:
This is not financial advice. Past performance ≠ future results. Conduct your own due diligence. Technical analysis has limitations and may not account for black swan events. Manage risk aggressively.

Siemens cmp 7348.50 by Daily Chart view*Siemens cmp 7348.50 by Daily Chart view*
- Volumes surged today by demand based buying
- Price Band 7150 to 7250 is now a Support Zone earlier Resistance Zone
- Old Gap Up Opening of 15-May-2024 Filled In multiple times by Resistance Zone Breakout
- Weekly basis Support at 7005 > 6675 > 6335 with the Resistance at 7600 > 7915 > ATH 8129.90
- Multiple Bullish Rounding Bottoms done with the neckline at Support Zone earlier Resistance Zone
- Stock Price respecting the Rising Support Trendline and sustaining over the Falling Resistance Trendline
