Trend Channels and Bullish Breakouts: SIEMENS LIMITED📈 Understanding Flat Trend Channels and Bullish Breakouts: The Case of Siemens Limited
1. What is a Flat Trend Channel?
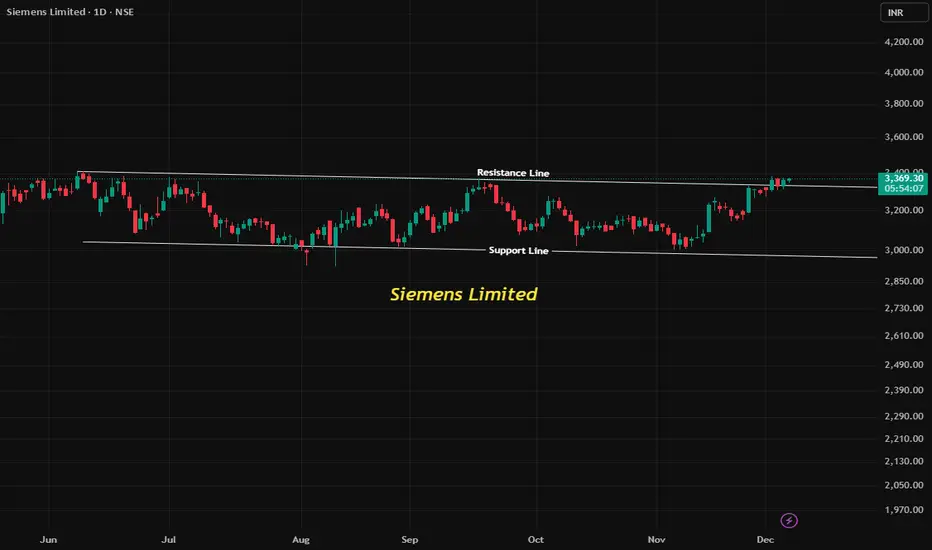
A Flat Trend Channel is a price pattern where a stock moves sideways between two parallel lines — the resistance line (upper boundary) and the support line (lower boundary).
Traders often call this a range-bound market. Prices oscillate within the channel, reflecting indecision between buyers and sellers.
Key features:
a. Resistance line: The ceiling where price repeatedly fails to move higher.
b. Support line: The floor where price repeatedly finds buying interest.
c. Flat nature: Both lines are horizontal, showing no clear uptrend or downtrend.
👉 In Siemens Limited, since June 2025, the stock was consolidating in such a flat channel, capped by resistance around ₹3350.
2. Bullish Breakout from a Flat Channel
A Bullish Breakout occurs when price decisively moves above the resistance line with strong volume and momentum.
This signals that buyers have overwhelmed sellers, often leading to a new upward trend.
Textbook confirmation includes:
Close above resistance on daily chart.
Volume expansion supporting the breakout.
Follow-through candles sustaining above the breakout zone.
👉 Siemens Limited has now closed above ₹3355, confirming a breakout from its flat channel. This shifts the bias from neutral to bullish.
3. Stop Loss and Target: How to Place ? Trading channels requires disciplined risk management. Here’s how traders typically set levels:
a) Enter on breakout candle close above resistance
b) Stop Loss Just below the support or breakout level (below channel support)
c) Target 1 Height of the channel added to breakout point
d) Target 2 Next major resistance zone/ historical supply area
Stop Loss ensures protection if breakout fails (false breakout).
Target is calculated using channel height projection — a classic method in technical analysis.
Siemens Limited’s breakout is a real-world example of how flat channels evolve into trending moves.
4. Traders can use this setup to:
a) Enter long positions above breakout.
b) Place stop loss below support to manage risk.
c) Aim for targets based on channel height and next resistance zones.
This is a textbook bullish breakout opportunity, demonstrating how theory translates into practice.
5. Key Takeaways
a) Flat channels represent consolidation and indecision.
b) Breakouts signal fresh momentum and trend initiation.
c) Stop loss and target placement are essential for disciplined trading.
d) Siemens Limited’s breakout above ₹3355 offers a practical case study of these principles.
Siemenslong
SIEMENS Analysis | Symmetrical Triangle Breakout Explained📊 SIEMENS Trade Analysis
🔎 Price Action
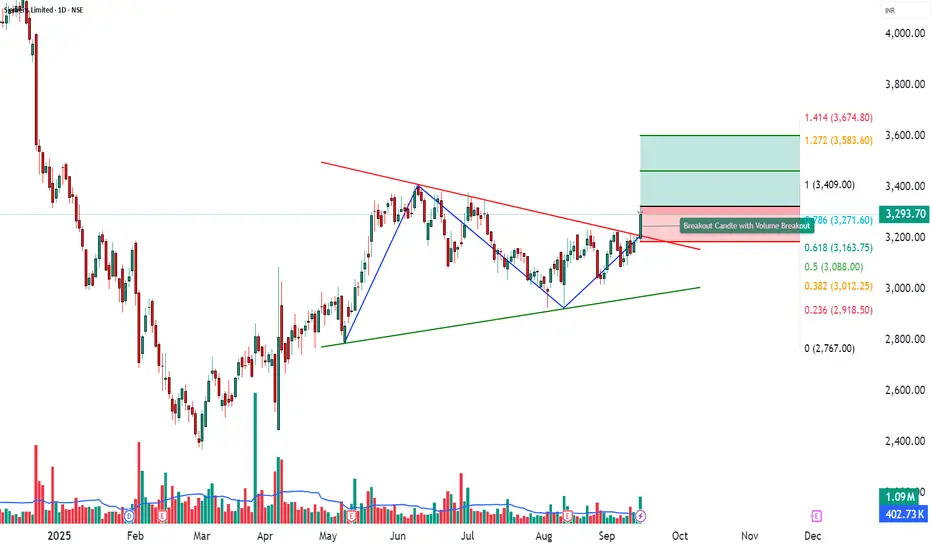
SIEMENS closed at ₹3293.7 with a solid +2.86% gain, backed by a volume of 10.95 lakh, well above its 20-day average of 4.02 lakh (VolX = 3.03x).
This sharp rise in activity highlights strong institutional participation, confirming bullish momentum and improving probability of continuation.
________________________________________
📉 Chart Signals – Symmetrical Triangle
Strong bullish candle backed by heavy volumes.
RSI breakout supporting positive momentum.
Bollinger Band squeeze + breakout → signals volatility expansion.
________________________________________
📍 Key Levels
Resistance: 3349 – 3404 – 3484
Support: 3214 – 3134 – 3079
________________________________________
📈 Investment Outlook
📈 Bullish Case – Why the stock could go up
Strong volume-led breakout (VolX = 3.03x).
Momentum indicators (RSI 62, CCI 193, Stochastic 89) suggest upside strength.
Sustained buying pressure may push stock toward ₹3464 – ₹3602.
📉 Bearish Case – Potential downside risks
Failure to sustain above ₹3325 could trigger profit booking.
Global or market-wide weakness may drag stock back toward supports.
Break below ₹3214 could shift bias to downside.
⚡ Momentum Case – Short-term Trading Edge
Volume surge + RSI breakout confirm short-term momentum.
Bollinger squeeze → strong volatility expansion.
Holding above 3349–3404 may open upside toward ₹3464–₹3602.
📅 Short-term vs Long-term Perspective
Short-term (1–2 weeks): Momentum-driven moves likely; watch resistances at 3349–3484 and supports at 3214–3134.
Long-term (1–3 months): Stock remains in an uptrend; sustained buying with strong volumes could establish higher base levels.
________________________________________
📝 STWP Trade Analysis
Outlook: Momentum: Strong, Trend: Bullish
Entry: 3325 – 3293.75 | Stop-loss: 3186.05
Target-1: 3463.95 | Target-2: 3602.9
Risk/Reward: 1:3.27 | Risk: Low | Volume: High
Demand zone: 3212 - 3181.50 | SL: 3177.50 - Could be a good Pullback zone
Learning Note: SIEMENS shows strong momentum with volume breakout; supports and resistances clearly define near-term trade zones.
________________________________________
⚠️ Disclaimer – Please Read Carefully
The information shared here is meant purely for learning and awareness. It is not a buy or sell recommendation and should not be taken as investment advice. I am not a SEBI-registered investment advisor, and all views expressed are based on personal study, chart patterns, and publicly available market data.
Trading — whether in stocks or options — carries risk. Markets can move unexpectedly, and losses can sometimes exceed the money you have invested. Past performance or past setups do not guarantee future results.
If you are a beginner, treat this as a guide to understand how the market works — practice on paper trades before risking real money. If you are experienced, always assess your own risk, position sizing, and strategy suitability before entering trades.
Consult a SEBI-registered financial advisor before making any real trading decision. By engaging with this content, you acknowledge full responsibility for your trades and investments.
💬 Found this useful?
🔼 Give this post a Boost to help more traders discover clean, structured learning.
✍️ Drop your thoughts, questions, or setups in the comments — let’s grow together!
🔁 Share with fellow traders and beginners to spread awareness.
👉 “If you liked this breakdown, follow for more clean, structured setups with discipline at the core.”
🚀 Stay Calm. Stay Clean. Trade With Patience.
Trade Smart | Learn Zones | Be Self-Reliant 📊
Cup & Handle Breakout + Golden Cross Confirms Bullish Megatrend Timeframe: Daily
Ticker: NSE:SIEMENS
🔥 Key Technical Setup:
Cup & Handle Pattern:
Cup Depth: ~1026 points
Breakout Level: 3414 (multi-touch resistance).
Golden Cross Confirmation: 50 EMA crossed above 200 EMA (bullish long-term momentum shift).
Volume & Price Confirmation:
- Entry Trigger: Close above 3414 with a strong green candle + above-average volume (min. 1.5x 20-day avg volume).
- False Breakout Filter: Volume must surge to validate breakout.
🎯 Trade Strategy:
Entry Zone: 3415–3430 (after confirmed breakout).
Stop Loss: 3169 (swing low of the handle, below key support).
Target 1: 3750
Target 2: 4170
Final Target: 4455 (cup depth projected from breakout: *3414 + 1026 = 4440–4455*).
The trade targets 4455, but reaching this level will take time—patience is key as price works through resistance at 3750 and 4170.
📉 Price Action Mantra:
“Price absorbs all noise! Trade the CHART, not the news.”
📊 Why This Works:
1. Golden Cross Amplifies Momentum: Post-crossover, rallies average +25% in trending stocks.
2. Cup & Handle Statistics: 85% success rate when volume confirms breakout.
3. Volume Divergence: Declining volume in handle + surge on breakout = institutional accumulation.
⚠️ Risk Management:
Position Size: Risk ≤1% capital per trade.
Trailing SL: Move SL to 3300 after Target 1 (3750) hit.
Partial Exit: Book 50% at 3750, 25% at 4170, hold 25% for 4455.
🧠 Psychology & Market Structure:
Resistance Levels to Watch:
3750: Profit-taking zone.
4170: Key options barrier (break = accelerated FOMO).
Support Floor: 3200–3169 (must hold to preserve structure).
Set alerts, follow volume, and let price lead the way!
📌 Disclaimer:
This is not financial advice. Past performance ≠ future results. Conduct your own due diligence. Technical analysis has limitations and may not account for black swan events. Manage risk aggressively.

SIEMENS LTD - Bullish Flag & Pole Breakout (Daily T/F)Trade Setup
📌 Stock: SIEMENS LTD ( NSE:SIEMENS )
📌 Trend: Strong Bullish Momentum
📌 Risk-Reward Ratio: 1:3 (Favorable)
🎯 Entry Zone: ₹3383.00 (Breakout Confirmation)
🛑 Stop Loss: ₹3208.00 (Daily Closing Basis) (-5 % Risk)
🎯 Target Levels:
₹3484.50
₹3589.10
₹3696.80
₹3807.70
₹3922.00 (Final Target)
Technical Rationale
✅ Bullish Flag & Pole Breakout - Classic bullish pattern confirming uptrend continuation
✅ Strong Momentum - Daily RSI >69 , Weekly RSI >59 & Monthly RSI >59 (Bullish zone)
✅ Volume Confirmation - Breakout volume 15.52M vs previous day's 4.27M (Nearly 4x surge)
✅ Multi-Timeframe Alignment - Daily and weekly charts showing strength
Key Observations
• The breakout comes with significantly higher volume, validating strength
• Well-defined pattern with clear price & volume breakout
• Conservative stop loss at recent swing low
Trade Management Strategy
• Consider partial profit booking at each target level
• Move stop loss to breakeven after Target 1 is achieved
• Trail stop loss to protect profits as price progresses
Disclaimer ⚠️
This analysis is strictly for educational purposes and should not be construed as financial advice. Trading in equities involves substantial risk of capital loss. Past performance is not indicative of future results. Always conduct your own research, consider your risk appetite, and consult a financial advisor before making any investment decisions. The author assumes no responsibility for any trading outcomes based on this information.
What do you think? Are you watching NSE:SIEMENS for this breakout opportunity? Share your views in the comments!

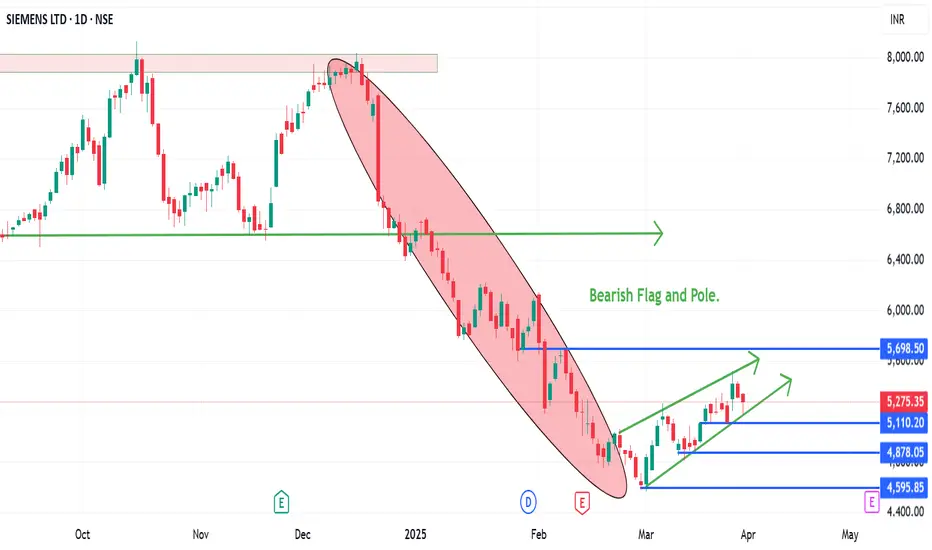
Siemen forming a Flag and Pole pattern on the bearish side.A bearish Flag and pole pattern in Siemens.
The stock has fell from 8000 to 4600 and recovered back to 5300. If there is a break down of the parallel channel, it can retest the recent low of 4600.
It is trading below 100 and 200 EMA on the daily charts. There will be resistance from the levels.
Wait for the break down and let stock price test the recent low.
Enter only once the stock has given a break down, else avoid entering the short trade.
Institutional trading strategy | Order Block | SIEMENS💡Insider Insights:
👉Siemens eyes $9.1B Altair Engineering acquisition for digital growth.
👉Expands AI partnership with Microsoft.
👉Launches Solid Edge 2025 for better design tools.
1️⃣An Order Block Area is a price zone with heavy buying or selling by institutions, Traders use these areas to identify potential price reversals or trend continuations.
✅Identifying an Order Block:
⭕️Consolidation Areas: Look for tight price ranges.
⭕️Sharp Breaks: Identify strong price moves following consolidation.
⭕️Tested Zones: Recognize areas acting as support or resistance.
2️⃣The accumulation phase with a small range is when a stock trades within a narrow price band while large investors buy shares. This indicates strong demand and often leads to a potential upward breakout.
💡Technical Analysis:
✅Inverted Head & Shoulder Chart Pattern
✅ Cup & Handle with order block confirmation
✅Prior accumulation phase
✅Rise in Volume
✅Trap Trading with Bo and fake out confirmation
💡Fundamental Analysis:
👉Revenue Growth: Steady growth, especially in Digital Industries and healthcare.
👉Earnings & Margins: High operating margins due to efficient digital solutions.
👉Dividend: Yield around 3-4%, attractive to investors.
👉Debt & Liquidity: Manageable debt levels with strong cash reserves.
✅Check out my TradingView profile to see how we analyze charts and execute trades.
🙋♀️🙋♂️If you have any questions about this stock, feel free to reach out to me.
📍📌Thank you for exploring our idea! We hope you found it valuable.
🙏FLLOW for more !
👍LIKE if useful !
✍️COMMENT Below your view !

Siemens cmp 7348.50 by Daily Chart view*Siemens cmp 7348.50 by Daily Chart view*
- Volumes surged today by demand based buying
- Price Band 7150 to 7250 is now a Support Zone earlier Resistance Zone
- Old Gap Up Opening of 15-May-2024 Filled In multiple times by Resistance Zone Breakout
- Weekly basis Support at 7005 > 6675 > 6335 with the Resistance at 7600 > 7915 > ATH 8129.90
- Multiple Bullish Rounding Bottoms done with the neckline at Support Zone earlier Resistance Zone
- Stock Price respecting the Rising Support Trendline and sustaining over the Falling Resistance Trendline

@SIEMENS AT strong support After 1 week of regular fall Siemens is standing at it's strong support zone and expecting to give good pump from this stage.

Siemens Indicates Pendent Pattern Breakout Above 8000Details:
Asset: Siemens Limited (SIEMENS)
Breakout Level: Sustaining above 8000
Potential Target: Significant upside momentum expected
Stop Loss: Below breakout level or as per risk tolerance
Timeframe: Short to medium-term
Rationale: Siemens Limited (SIEMENS) is indicating a potential breakout above the 8000 level, potentially breaking out from a pendent pattern. Sustaining above this level could signify a bullish sentiment shift and pave the way for a significant upmove.
Market Analysis:
Technical Breakout: Breaking out from the pendent pattern and sustaining above 8000 suggests a technical breakout, potentially attracting buying interest and driving the price higher.
Market Sentiment: Positive market sentiment or company-specific factors may be contributing to the anticipated breakout in SIEMENS.
Potential Target:
The potential upside target for SIEMENS is not specified but is expected to be significant given the pendent pattern breakout.
Risk Management:
Implementing a stop loss strategy below the breakout level is essential to manage risk in case of unexpected price reversals.
Timeframe:
The projected move for SIEMENS is based on a short to medium-term outlook, but actual timing may vary based on market conditions.
Risk-Reward Ratio: Consider individual risk tolerance and adjust position size accordingly to maintain a favorable risk-reward ratio.
As with any investment opportunity, conduct thorough analysis and consider factors such as market trends, company fundamentals, and risk management strategies before making trading decisions.

Daily Bullish Flag Breakout in Siemens India with 20% upsideHi,
NSE:SIEMENS has given a Bullish Flag Breakout on Daily charts with very good volume.
MACD is also on the bullish side on daily and weekly time frames. RSI is also on the bullish side on daily and weekly time frames.
In the current market scenario, I am expecting that the bullish momentum will continue.
Complete price projection like entry, stop loss and targets mentioned on the charts for educational purpose.
Please share your feedback or any queries on the study.
Disclaimer: Please consult your financial advisor before making any investment decision.

stay longkeep it simple
trendline + resistance line based trade
long entry for targets
3767, 3776, 3787
dislcaimer - trade @ own risk

SIEMENS - GFSScript - SIEMENS
- Monthly RSI - Above 60
- Weekly RSI - Above 60
- Daily RSI - At 60
Entry - between 3650/3680
SL - 3615
Target - 3870/3880 , trail above these targets if holding.

SIEMENS- Near Breakout
SIEMENS- Near Breakout
Vol Increasing
RSI above 60
Support 3080
Resistance 3300/3600

Siemens Flat BaseA good consolidation in siemens for 21 weeks. The price hasn't broken out of the range yet. Keep a close eye; added to Watchlist.
This is not a recommendation. The chart analysis is only for educational purposes. Please consult your financial advisor before making any buy or sell decision.

SIEMENS INDIA||09-12-2022||SWING AND SHORT TERMI AM NOT SEBI registered advisor please consult financial advisor for your investment.
This is only for educational purpose you can also share your thoughts on the comments
\\Representation:
**Green dashed line--Supportive line
**Red dashed line--Resistance line
**Black up and down arrow--touches of support line
**cmp:2980
In this chart, I can see good DOUBLE BOTTOM pattern
The Resistance Line was breached with very good candle
keep following We will grow like healthy society.

SIEMENS- Ichimoku Bullish Breakout Stock Name - Siemens Limited
Ichimoku Cloud Setup :
1). Today's close is above the Conversion Line
2). Future Kumo is Turning Bullish
3). Chikou span is slanting upwards
All these parameters are showing bullishness at Current Market Price
and more bullishness AFTER crossing 3065
#This is not Buy and Sell recommendation to any one. This is for education purpose and a helping hand to learn trading in Market.
# Cloud Trading
# Ichimoku Cloud
# Ichimoku Followers
I hope you all like my analysis.
Please do share your thoughts into comment section.
Please give a like, it motivates me to do analysis.

SIEMENS - Ichimoku Bullish Breakout Stock Name - Siemens Limited
Ichimoku Cloud Setup :
1). Today's close is above the Conversion Line
2). Future Kumo is Turning Bullish
3). Chikou span is slanting upwards
All these parameters are showing bullishness at Current Market Price
and more bullishness AFTER crossing 2820
#This is not Buy and Sell recommendation to any one. This is for education purpose and a helping hand to learn trading in Market.
# Cloud Trading
# Ichimoku Cloud
# Ichimoku Followers
I hope you all like my analysis.
Please do share your thoughts into comment section.
Please give a like, it motivates me to do analysis.

Target 2 achieved in Siemens | 9.5% moverThis idea is 2nd follow-up to Siemens
You can check the Link to Related Ideas - Trade activation explained at levels of 2400 ( Symmetrical Triangle BO in detail )
Talking about Targets - Target 1 was the Symmetrical Triangle Bo Top node. Target 2 was a Fibo extension created from 2530 to 2200, extended levels were Targets.
Disclaimer: The information provided is for educational purposes only. Our intention is not to provide any financial advice, don't take any decision without consulting your financial advisor.

SIEMENS: SYMMETRICAL TRIANGLETrading strategy: Buy with SL of 2280 and look for the target of 2700/2900/ and 3050 the measured target .
Theory:
The symmetrical triangle, which can also be referred to as a coil, usually forms during a trend as a continuation pattern. The pattern contains at least two lower highs and two higher lows. When these points are connected, the lines converge as they are extended and the symmetrical triangle takes shape. You could also think of it as a contracting wedge , wide at the beginning and narrowing over time.
Trend: In order to qualify as a continuation pattern, an established trend (at least a few months old) should exist. The symmetrical triangle marks a consolidation period before continuing after the breakout.
Four (4) Points: At least 2 points are required to form a trend line and 2 trend lines are required to form a symmetrical triangle. Therefore, a minimum of 4 points are required to begin considering a formation as a symmetrical triangle. The second high (2) should be lower than the first (1) and the upper line should slope down. The second low (2) should be higher than the first (1) and the lower line should slope up. Ideally, the pattern will form with 6 points (3 on each side) before a breakout occurs.
Volume: As the symmetrical triangle extends and the trading range contracts, volume should start to diminish. This refers to the quiet before the storm, or the tightening consolidation before the breakout.
Duration: The symmetrical triangle can extend for a few weeks or many months. If the pattern is less than 3 weeks, it is usually considered a pennant . Typically, the time duration is about 3 months.
Breakout Timeframe: The ideal breakout point occurs 1/2 to 3/4 of the way through the pattern's development or time-span. The time-span of the pattern can be measured from the apex (convergence of upper and lower lines) back to the beginning of the lower trend line (base). A break before the 1/2 way point might be premature and a break too close to the apex may be insignificant. After all, as the apex approaches, a breakout must occur sometime.
Breakout Direction: The future direction of the breakout can only be determined after the break has occurred. Sounds obvious enough, but attempting to guess the direction of the breakout can be dangerous. Even though a continuation pattern is supposed to breakout in the direction of the long-term trend, this is not always the case.
Breakout Confirmation: A break should be on a closing basis for it to be considered valid. Some traders apply a price (3% break) or time (sustained for 3 days) filter to confirm validity. The breakout should occur with an expansion in volume , especially on upside breakouts.
Return to Apex: After the breakout (up or down), the apex can turn into future support or resistance. The price sometimes returns to the apex or a support/resistance level around the breakout before resuming in the direction of the breakout.
Price Target: There are two methods to estimate the extent of the move after the breakout. First, the widest distance of the symmetrical triangle can be measured and applied to the breakout point. Second, a trend line can be drawn parallel to the pattern's trend line that slopes (up or down) in the direction of the break. The extension of this line will mark a potential breakout target.

Target 1 achieved in Siemens | 5% mover This idea is a follow-up to Siemens
You can check the Link to Related Ideas
Disclaimer: The information provided is for educational purposes only. Our intention is not to provide any financial advice, don't take any decision without consulting your financial advisor.

Best stocks to trade on 4 July with Logic | Index analysisI daily make market analysis videos and posts on Financial markets
Disclaimer: The information provided is for educational purposes only. Our intention is not to provide any financial advice, don't take any decision without consulting your financial advisor

SIEMENS: SYMMETRICAL TRIANGLETrading strategy: Buy with SL of 2240 and look for the target of 2600/2700. later on the measured target .
Theory:
The symmetrical triangle, which can also be referred to as a coil, usually forms during a trend as a continuation pattern. The pattern contains at least two lower highs and two higher lows. When these points are connected, the lines converge as they are extended and the symmetrical triangle takes shape. You could also think of it as a contracting wedge, wide at the beginning and narrowing over time.
Trend: In order to qualify as a continuation pattern, an established trend (at least a few months old) should exist. The symmetrical triangle marks a consolidation period before continuing after the breakout.
Four (4) Points: At least 2 points are required to form a trend line and 2 trend lines are required to form a symmetrical triangle. Therefore, a minimum of 4 points are required to begin considering a formation as a symmetrical triangle. The second high (2) should be lower than the first (1) and the upper line should slope down. The second low (2) should be higher than the first (1) and the lower line should slope up. Ideally, the pattern will form with 6 points (3 on each side) before a breakout occurs.
Volume: As the symmetrical triangle extends and the trading range contracts, volume should start to diminish. This refers to the quiet before the storm, or the tightening consolidation before the breakout.
Duration: The symmetrical triangle can extend for a few weeks or many months. If the pattern is less than 3 weeks, it is usually considered a pennant. Typically, the time duration is about 3 months.
Breakout Timeframe: The ideal breakout point occurs 1/2 to 3/4 of the way through the pattern's development or time-span. The time-span of the pattern can be measured from the apex (convergence of upper and lower lines) back to the beginning of the lower trend line (base). A break before the 1/2 way point might be premature and a break too close to the apex may be insignificant. After all, as the apex approaches, a breakout must occur sometime.
Breakout Direction: The future direction of the breakout can only be determined after the break has occurred. Sounds obvious enough, but attempting to guess the direction of the breakout can be dangerous. Even though a continuation pattern is supposed to breakout in the direction of the long-term trend, this is not always the case.
Breakout Confirmation: A break should be on a closing basis for it to be considered valid. Some traders apply a price (3% break) or time (sustained for 3 days) filter to confirm validity. The breakout should occur with an expansion in volume, especially on upside breakouts.
Return to Apex: After the breakout (up or down), the apex can turn into future support or resistance. The price sometimes returns to the apex or a support/resistance level around the breakout before resuming in the direction of the breakout.
Price Target: There are two methods to estimate the extent of the move after the breakout. First, the widest distance of the symmetrical triangle can be measured and applied to the breakout point. Second, a trend line can be drawn parallel to the pattern's trend line that slopes (up or down) in the direction of the break. The extension of this line will mark a potential breakout target.

Simple Trade Setup | SIEMENS | 01-04-2022 [INTRADAY]NSE:SIEMENS
Observations:
1) 15min chart, we can see resistance channel and it also kind of formation of inverse head and shoulder pattern.
Please refer below chart : 15min Time Frame.
-------------------------------------
Trade Setup for 01-04-2022
1) Don't Jump in to trade at the beginning of the market. Let it get settle for 15-20min first and judge the price action.
2) Everything is mentioned on the chart. I hope it is easy to understand.
3) All the levels will work as support, resistance, entry and exit w.r.t price action near that level.
4) Avoid gap up or gap down chase. Wait and trade between levels.
Please refer below chart for levels.
Hope I made it easy to understand it.
Do comment your doubt or suggestion.
Note: Trade with Strict SL. It may or may not hit all the levels. So one can book profit / loss at respective level considering how price action works near that level.
