Sigachi Ind (Weekly Timeframe) - Is this the trend reversal?After a period of decline following its February 2024 peak, Sigachi Industries has shown a dramatic burst of momentum. However, the stock has now reached a critical juncture, and confirmation is required to suggest a sustainable trend reversal.
## Recent Price Action
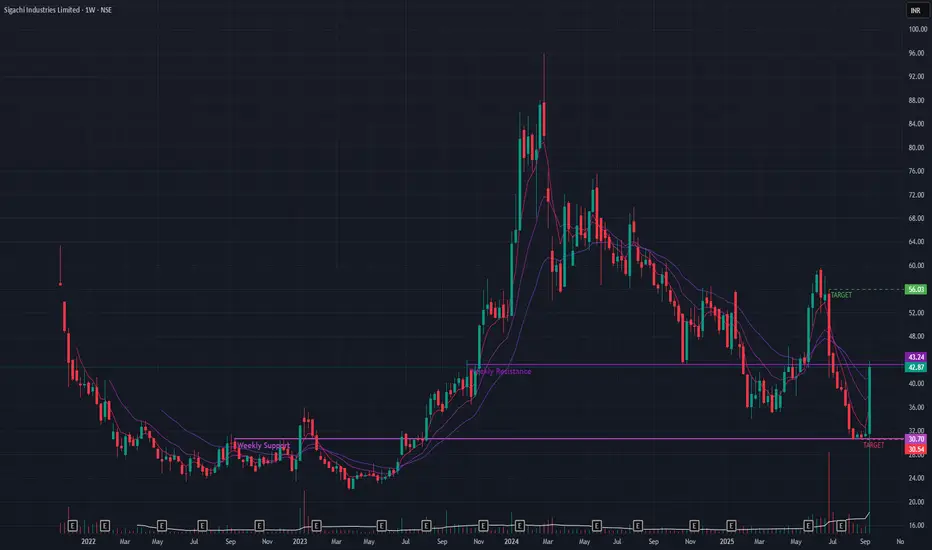
A massive +36.27% rally last week, backed by exceptionally high volume , has put the stock back on the radar. This surge has pushed the price directly against a significant long-term resistance trendline . A breakout above this level would be a major technical victory for the bulls.
## Cautionary Signals to Consider
Despite the powerful rally, several indicators suggest a "wait-and-see" approach:
Trend Confirmation: The stock has not yet formed a higher low , a key technical signal required to confirm a reversal from a downtrend to an uptrend.
EMA Posture: The short-term Exponential Moving Averages (EMAs) have not yet achieved a Positive Crossover (PCO) . This indicates that the recent surge, while strong, has not yet been sustained long enough to reverse the short-term trend momentum.
## Key Levels and Outlook
The stock is at a clear decision point.
Bullish Scenario: A decisive breakout above the current resistance trendline, again on high volume , would be a strong bullish signal. If this occurs, the next potential upside target is the ₹56 level.
Bearish Scenario: If the stock fails to breach this resistance and the momentum fades, it could fall back to test support near the ₹30 level.
Wait for further price-action !!
Sigachiindustries
Sigachi Inds cmp 58.43 by Weekly Chart views since listedSigachi Inds cmp 58.43 by Weekly Chart views since listed
- Support Zone at 53.75 to 55.75 Price Band
- Volumes are seen to be gradually increasing
- Bullish Rounding Bottom with neckline at Support Zone
- Weekly basis Support at 44 > 31 > 22 with Resistance at 71 > 84 > ATH 95.90
- *Probable Descending Triangle Breakout in the attempt basis Test Retest at the Support Zone*

Sigachi Industries (IPO Base Breakout)Sigachi Industries is giving IPO base breakouts on the weekly and monthly charts. Closing above 63.40 every week can open gates for 77, 93, and 107 levels. Also, a rounding bottom structure has formed on the weekly and monthly charts.
Disclaimer: I am not a SEBI registered analyst. All the stocks are for educational purposes. Investors must consult a financial advisor before making any investment. It is not a buy or sell recommendation.

SIGACHI - Flag & Pole BOEntry: above 314
Target: 360
SL: Below 300
Pattern: FLAG & POLE
EMA's : EMA 10 > EMA 21 > EMA 50
Flag: Price breaking out from 4 Week Flag.
Pole: Price Up by 25% before forming Flag pattern.

SIGACHI Nice Swing Opportunity!!!Chart pattern suggests a good swing opportunity in SIGACHI INDUSTRIES !!!
Reasons
1. Breakout with Extra ordinary volume
2. Low & Higher Low gives a clue about bulls entry into Sigachi !!
3. Target & SL levels mentioned @ chart
4. Best SL- 280
Let's see how it moves!!!
Fundamentally, Good stock(parameters showing it) and improving cashflow!!!
NOTE - Just sharing my view....not a tip nor advice!!!!

SIGACHI INDUSTRIES - DAY CHART - 14.01.2023 - BAHAVAN CAPITALSIGACHI INDUSTRIES as per day chart analysis
Stock ABOVE 339 TARGET 342
Wishing you a very Happy Pongal...

SIGACHI INDUSTRIES - DAY CHART - 07.01.2023 - BAHAVAN CAPITALSIGACHI INDUSTRIES as per Day Chart Analysis Stock
ABOVE 331 TARGET 335
Three consecutive days market fall due to increased selling pressure by FII Net selling 2902.46 Cr and DII Net Buying at 1083.17 Cr.
Monday Nifty may take a support at 17771 and Bank Nifty may take a support at 41677 then form a bullish or an inside bar candle.
So next week onwards market may move upwards due to quartely results announcement of various companies like TCS, HCL, WIPRO, INFOSYS etc...
Happy Weekend...

Sigachi Industries Ltd buy callbuy @345
tgt-400\500\700
buy @345
tgt-400\500\700
buy @345
tgt-400\500\700

SIGACHI INDUSTRIES - DAY CHART - 03.01.2023 - BAHAVAN CAPITALSIGACHI INDUSTRIES as per day chart analysis
STOCK ABOVE 281 TARGET 285
Happy Profitable Trading to all..
