Gold Technical Retracement Before Continuing Main Uptrend⏰ Timeframe: 30m
📅 Update: 11/14/2025
🔍 Market Context
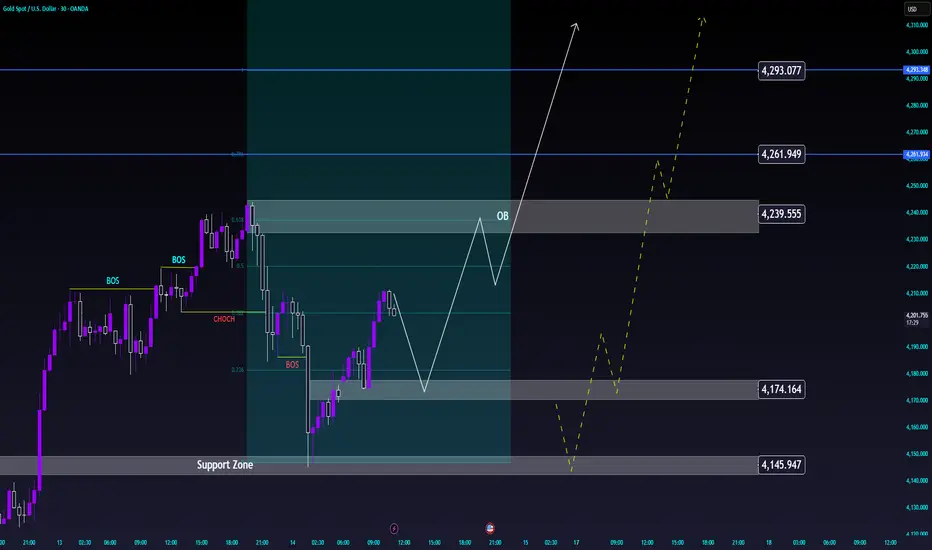
After establishing a short-term peak around 4,239 USD, gold is undergoing a technical retracement to rebalance its structure.
The most recent decline formed a Break of Structure (BOS), but the Support Zone around 4,145–4,174 USD continues to serve as a foundation for the medium-term uptrend.
The current price structure indicates the market is re-accumulating momentum before expanding again.
📊 Technical Structure
Order Block (4,239 USD): a short-term resistance zone where the price may react slightly before continuing upward.
Support Zone (4,145–4,174 USD): a confluence zone with Fibo 0.236–0.382, playing a balancing role in the current cycle.
Liquidity Targets:
• 4,261 USD – intermediate liquidity zone.
• 4,293 USD – main expansion target if the uptrend is maintained.
🎯 Market Outlook
High probability scenario:
1️⃣ The price may retrace to the Support Zone or form a higher low around 4,174 USD, then recover to the OB zone at 4,239 USD.
2️⃣ If the uptrend structure breaks, the market may test deeper towards 4,145 USD before bouncing back.
As long as the price holds above this support zone, the primary trend remains bullish continuation.
🧠 Analyst’s View
This is a phase of market re-accumulation after a rapid increase.
Maintaining a higher low structure will be a confirmation signal for the next expansion phase towards 4,261–4,293 USD.
Buyers are still controlling the cash flow, while sellers mainly participate in the short-term resistance zone.
🛡️ Risk Note
The market is in a slight correction phase – avoid impulsive actions when the price has not completed the accumulation zone.
Signalfree
XAU/USD – Gold Technical Adjustment Before Continuing Uptrend⏰ Timeframe: 30m
📅 Updated: 11/11/2025
🔍 Market Context
After a strong rally from the start of the Asian session, gold paused around 4,130–4,140 USD, indicating a temporary cooling off after a series of consecutive Break of Structure (BOS).
The current price is situated between a short-term resistance zone and a technical support (Order Block) – clearly reflecting a rebalancing behavior after a rapid expansion.
📊 Technical Structure
Resistance Zone (4,145 USD): a short-term reaction area, coinciding with a Weak High. If the price surpasses this, the uptrend structure will continue towards the Liquidity Zone around 4,198 USD.
Order Block (4,111 USD): a confluence area between 0.382–0.5 Fibonacci, likely to attract buying interest when the price adjusts.
OB Deep (4,081 USD): a deep support area, coinciding with the 0.618 Fibonacci level — where buyers might defend the main trend.
Liquidity Zone (4,198 USD): a potential expansion target if the uptrend structure is reconfirmed.
🎯 Market Outlook
High probability scenario:
1️⃣ Price technically adjusts to OB 4,111 or OB Deep 4,081, creating a reaction at the Discount area.
2️⃣ As buying momentum returns, the price may retest the Resistance Zone 4,145, then expand towards the Liquidity Zone 4,198 USD.
3️⃣ Breaking below 4,081 USD will weaken the short-term structure, shifting to a deeper rebalancing state.
🧠 Analyst’s View
This is a natural “cooldown” phase after a strong rally — the market is seeking liquidity before establishing the next upward move.
As long as the price holds above the 4,081 USD area, the main trend remains bullish.
Observing reactions at the OB will help determine if the upward momentum will continue to dominate in the US session.
🛡️ Risk Note
The market is adjusting within a larger trend — avoid emotional actions when the price has not completed the retracement phase.

GOLD 28/6 - Can the bulls hold the $1900 mark?The US Dollar experienced significant gains towards the end of last week as the Federal Reserve adjusted its perception of the interest rate trajectory.
The reaction of Treasury yields will play a crucial role in determining the outcome. If they surpass the inflation rates priced in by the market, real yields may increase slightly, potentially leading to a decline in gold prices.
Although there seems to be a double bottom pattern forming for gold at the H4 timeframe, confirmation of this pattern requires the market to break through the resistance level at $1932. Once this barrier is breached, the short-term target for gold would be $1950.
We will be monitoring the resistance level at the H4 EMA 34 for a potential selling opportunity.
SELL GOLD zone at: $1926 - $1928 - $ SL $1934 (It is best to carefully review the FOMC news before entering the order)
SELL GOLD zone at: $1942 - $1945 SL $1953
Based on technical analysis indicators EMA 34, EMA 89 with strong resistance zone $1940 - $1943

Powergrid : PSU and Power sector tail windPOWERGRID CMP 227.15
May go up to 250+, below 210 is invalid
Breaking from Triangle pattern
expecting Good R:R
Disclaimer - All information on this page is for
educationaland learning purpose only. We are not SEBI registered financial advisor.
Please think twice before investing your money and do proper research before investing in Share
market.
#powergrid
#swingtrade
#SwingTrading
#swingtrader
#NSE
#StocksToBuy
#StockToWatch
#StocksToTrade
#StocksInFocus
#stockstrading
