XAUUSD Double Bull Flag — Danger AheadHello my dear traders, Laura here.
This week, the market has been extremely tense, and the price action reflects it well.
As I mentioned before, we are currently seeing the formation of a large bull flag. Just above it, a smaller flag is developing, and this smaller structure is the key trigger for any potential continuation. The bullish outlook remains valid only if this smaller flag breaks cleanly.
The recent pullback dipped deeper than expected, which signals hesitation from buyers. When confidence fades, even a promising breakout can turn into a sweet trap that lifts briefly before falling sharply.
Because of this, patience becomes essential. Before entering, we need a clear and decisive breakout that confirms strength. Specifically, we should look for a candle that breaks through resistance with firmness and clarity. If such a confirmation appears, the path toward the 4,300 level becomes structurally supported.
On the other hand, if the price falls below the lower trendline, the bullish scenario is invalidated immediately. At that point, the setup no longer holds and should not be traded.
For now, the principle is straightforward.
No breakout means no entry. Stay disciplined and avoid letting the market pull you into unnecessary risk.
Signals

XAUUSD: Continuing Uptrend with Potential Expansion to $4,280OANDA:XAUUSD has shown strong performance in the ascending channel, and I expect this trend to continue as shown in my chart, with a target price of $4,280.
The current area represents a key turning point, where prices could find support allowing them to rise, or they may break down, which could lead to a further downward movement.
If I were to choose the most likely direction, I would lean towards upward price movement. However, only market action will determine whether the channel will continue or not.
If the downtrend line is breached strongly, it will invalidate the bullish scenario, meaning that the bullish momentum could weaken or even reverse in the short term.
These are just my personal forecasts based on technical analysis, and they do not represent financial advice. Always make sure to verify your setups and manage risks wisely.
Wishing you successful and profitable trading!

Gold Technical Retracement Before Continuing Main Uptrend⏰ Timeframe: 30m
📅 Update: 11/14/2025
🔍 Market Context
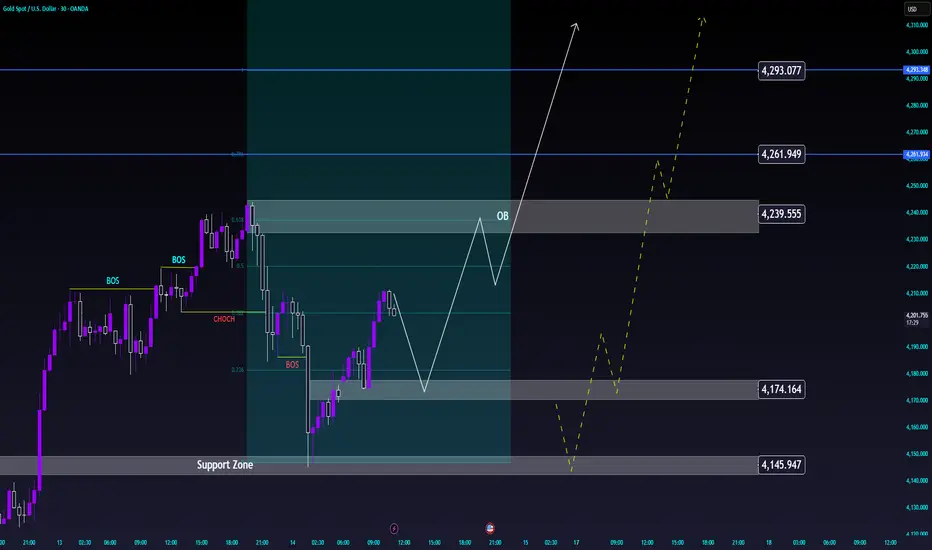
After establishing a short-term peak around 4,239 USD, gold is undergoing a technical retracement to rebalance its structure.
The most recent decline formed a Break of Structure (BOS), but the Support Zone around 4,145–4,174 USD continues to serve as a foundation for the medium-term uptrend.
The current price structure indicates the market is re-accumulating momentum before expanding again.
📊 Technical Structure
Order Block (4,239 USD): a short-term resistance zone where the price may react slightly before continuing upward.
Support Zone (4,145–4,174 USD): a confluence zone with Fibo 0.236–0.382, playing a balancing role in the current cycle.
Liquidity Targets:
• 4,261 USD – intermediate liquidity zone.
• 4,293 USD – main expansion target if the uptrend is maintained.
🎯 Market Outlook
High probability scenario:
1️⃣ The price may retrace to the Support Zone or form a higher low around 4,174 USD, then recover to the OB zone at 4,239 USD.
2️⃣ If the uptrend structure breaks, the market may test deeper towards 4,145 USD before bouncing back.
As long as the price holds above this support zone, the primary trend remains bullish continuation.
🧠 Analyst’s View
This is a phase of market re-accumulation after a rapid increase.
Maintaining a higher low structure will be a confirmation signal for the next expansion phase towards 4,261–4,293 USD.
Buyers are still controlling the cash flow, while sellers mainly participate in the short-term resistance zone.
🛡️ Risk Note
The market is in a slight correction phase – avoid impulsive actions when the price has not completed the accumulation zone.
Gold Holds Firm Near $4,180 as Markets Await Fed Signal Gold prices are holding steady around $4,184 per ounce, maintaining strong momentum after last week’s sharp rebound of nearly $250 from the $3,930 low. On the 4-hour chart, the uptrend remains intact with multiple Fair Value Gaps acting as key support zones. The nearest support is seen between $4,150–4,120, while resistance lies at $4,220–4,260.
According to Kitco and Reuters, the rally is largely supported by growing expectations that the Federal Reserve may cut rates in December, amid signs of a cooling U.S. economy. The reopening of the U.S. government after a 35-day shutdown means crucial data such as CPI, NFP, and GDP will soon be released — which could reinforce the market’s belief that a dovish shift is near.
Adding to the intrigue, the U.S. Supreme Court is set to review former President Donald Trump’s authority to dismiss Fed Governor Lisa Cook in early 2026. Analysts warn that if this threatens the Fed’s independence, it could trigger a sharp decline in the U.S. dollar and push gold up by as much as $500 per ounce.
Meanwhile, UBS forecasts global gold demand in 2025 could reach its highest level since 2011, as central banks continue increasing reserves. Heightened geopolitical risks — including the upcoming U.S. election in 2026, the Middle East conflict, and renewed U.S.–China trade tensions — are further strengthening gold’s appeal as a safe haven.
In the near term, gold could correct slightly towards $4,150–4,120 before resuming its advance towards $4,260. A decisive break above that level could open the path to $4,300–4,340. With a weakening dollar, potential rate cuts, and global uncertainty, gold appears well-positioned for the next medium-term bullish cycle.

XAU/USD – Price Accumulating in a Narrow Range, Ready to Expand⏰ Timeframe: 30m
📅 Update: 11/12/2025
🔍 Market Context
Gold maintains a neutral structure after forming a Change of Character (CHoCH) around the 4,144 USD area.
Yesterday's session witnessed a narrow fluctuation between the Demand Zone – Support Zone, indicating the market is absorbing liquidity before determining the next direction.
The medium-term upward momentum remains unbroken, but the price needs a clear balancing phase before continuation.
📊 Technical Structure
Demand Zone (4,144 USD): a short-term supply – demand area where the market previously reacted strongly, now becoming a potential testing zone.
Support Zone (4,099 USD): confluence structure – an area where buying flows may return when the price retests.
Order Block (4,081 USD): a deep defensive zone, corresponding to the main Discount area in the current cycle.
Equal Lows (EQL) & CHoCH: indicate a short-term transition between two sides, but the overall bias slightly leans towards an increase.
🎯 Market Outlook
High probability scenario for the day:
1️⃣ Price may fluctuate within the 4,099–4,144 USD balance zone to attract liquidity.
2️⃣ If a strong reaction occurs from the Support Zone or Order Block, gold may establish a new upward move towards 4,165–4,180 USD.
3️⃣ Conversely, if the price closes below 4,081 USD, the short-term structure will temporarily shift to neutral, prioritizing a re-accumulation phase.
🧠 Analyst’s View
Current price behavior reflects a “pause phase” in the larger upward structure.
When the market balances at lower levels, the key observation is not the bounce, but the reaction when liquidity is swept — where the true momentum of the trend is reignited.
As long as the price does not break the 4,081 USD mark, the medium-term upward trend remains intact.
🛡️ Risk Note
This is a technical analysis, not investment advice.
The market can change rapidly during US sessions – wait for clear confirmation from price action before participating.

XAU/USD – Gold Technical Adjustment Before Continuing Uptrend⏰ Timeframe: 30m
📅 Updated: 11/11/2025
🔍 Market Context
After a strong rally from the start of the Asian session, gold paused around 4,130–4,140 USD, indicating a temporary cooling off after a series of consecutive Break of Structure (BOS).
The current price is situated between a short-term resistance zone and a technical support (Order Block) – clearly reflecting a rebalancing behavior after a rapid expansion.
📊 Technical Structure
Resistance Zone (4,145 USD): a short-term reaction area, coinciding with a Weak High. If the price surpasses this, the uptrend structure will continue towards the Liquidity Zone around 4,198 USD.
Order Block (4,111 USD): a confluence area between 0.382–0.5 Fibonacci, likely to attract buying interest when the price adjusts.
OB Deep (4,081 USD): a deep support area, coinciding with the 0.618 Fibonacci level — where buyers might defend the main trend.
Liquidity Zone (4,198 USD): a potential expansion target if the uptrend structure is reconfirmed.
🎯 Market Outlook
High probability scenario:
1️⃣ Price technically adjusts to OB 4,111 or OB Deep 4,081, creating a reaction at the Discount area.
2️⃣ As buying momentum returns, the price may retest the Resistance Zone 4,145, then expand towards the Liquidity Zone 4,198 USD.
3️⃣ Breaking below 4,081 USD will weaken the short-term structure, shifting to a deeper rebalancing state.
🧠 Analyst’s View
This is a natural “cooldown” phase after a strong rally — the market is seeking liquidity before establishing the next upward move.
As long as the price holds above the 4,081 USD area, the main trend remains bullish.
Observing reactions at the OB will help determine if the upward momentum will continue to dominate in the US session.
🛡️ Risk Note
The market is adjusting within a larger trend — avoid emotional actions when the price has not completed the retracement phase.

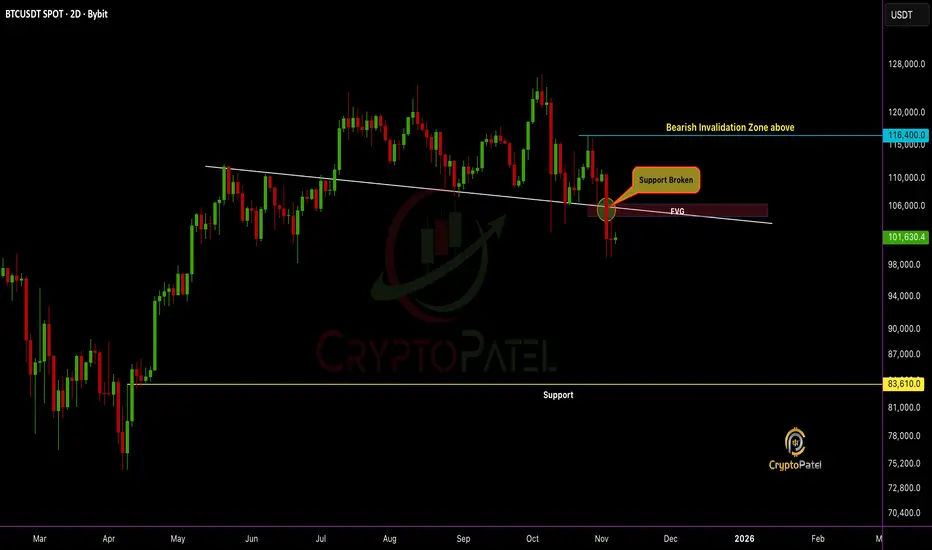
BTC Breakdown Confirmed, Structure Flipped Bearish: Next $88610?BTC Breakdown Confirmed, Structure Flipped Bearish: Next Stop $83,610?
Support is broken and the structure confirms a clear bearish shift.
#Bitcoin failed to reclaim the Fair Value Gap (FVG) zone, turning it into strong resistance.
High chances CRYPTOCAP:BTC could fill the FVG and continue the downside move toward $83,610.
Bulls remain trapped unless price reclaims $116,400, the bearish invalidation zone.
Trend bias remains bearish. Liquidity targets below are in play.
NFa & DYOR
XAUUSD Forms a Cup and Handle PatternOANDA:XAUUSD has been steadily rising, maintaining strong and consistent upward momentum. If you’ve been following my previous analyses, you’ll notice a familiar pattern developing on the chart — the classic Cup and Handle formation.
Looking closer, the left side of the chart reveals a strong supply zone, forming the cup. Then, we see the market building a potential handle on the right, indicating that the price is accumulating strength for the next move.
Now, here’s where things get interesting: if buying pressure aligns with Dow Theory waves and the Fibonacci retracement levels at 0.786 and 0.618 hold steady, with the price breaking through the neckline, this setup could push gold to 4500 USD.
However, if selling pressure comes in stronger than expected, the pattern may fail, and we could see a price pullback.

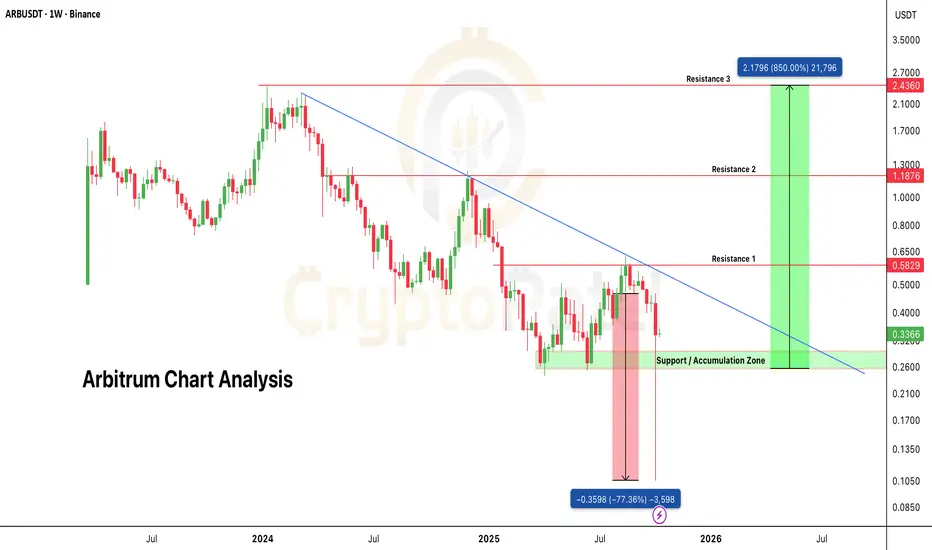
Whales loading $ARB – next 10x play in the makingWhales loading AMEX:ARB – next 10x play in the making
ARB/USDT faced a heavy sell-off during the recent crash, dropping over 77% within hours. But here’s the twist, it bounced back 238% from that low, showing strong market confidence.
What’s even more impressive: price never closed below the key support at $0.25, confirming this zone as a strong accumulation area for the long term.
Technical Overview:
Structure: Higher highs and higher lows forming after reclaiming demand zone
Support Held: $0.25 zone defended multiple times
Momentum: Bullish recovery with strong volume inflow
Bias: Long-term accumulation
Spot Accumulation Zone: $0.30 – $0.25
Targets: $0.58 / $1.18 / $2.43
Long-Term Potential: If the upcoming Altcoin Season kicks in, AMEX:ARB has the strength to deliver up to 10x returns from the current range.
NFA & DYOR
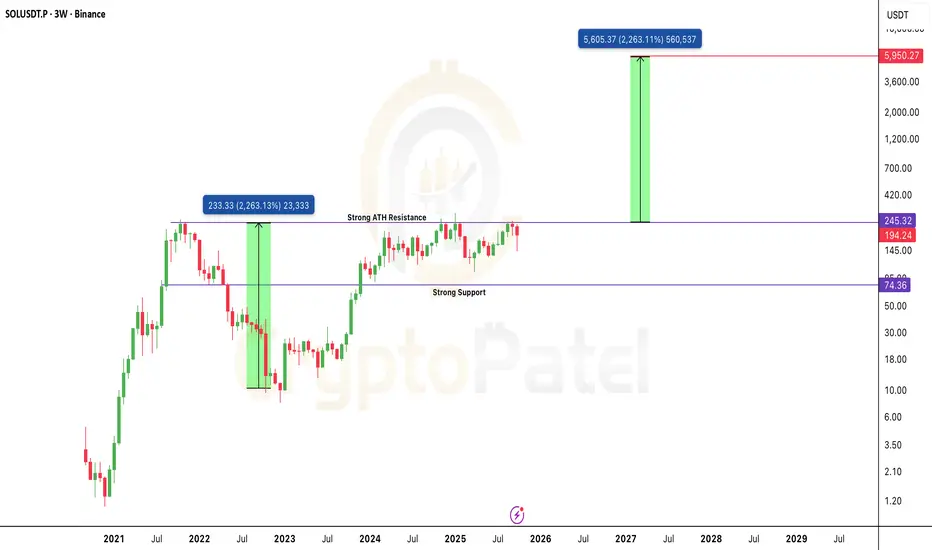
The Chart That Could Send $SOL to $6,000: Cup & Handle on 3W TFThe Chart That Could Send CRYPTOCAP:SOL to $6,000: Cup & Handle on 3W Timeframe
Solana is shaping one of the cleanest Cup & Handle patterns on the 3-Week chart, a formation that often signals the start of a massive long-term rally.
Technical Structure
🔹 Cup formed: $260 → $8 → back to $245 — a perfect rounded recovery base.
🔹 Handle forming: Price consolidating between $140–$245, building pressure before breakout.
🔹 Breakout trigger: Clean close above $245 (ATH zone) will confirm the move.
🔹 Targets:
– First target: $480–$500
– Extended target: $2,000–$6,000 if momentum mirrors the last 2200% run.
🔹 Major Support: $74–$90 zone.
What this really means: Solana is quietly preparing for its next macro expansion phase.
A confirmed breakout above ATH could kickstart one of the strongest alt rallies of this cycle.
Bias: Bullish on breakout confirmation
Timeframe: 3W / Long-Term Swing Setup
Plan: Watch $245 zone closely, breakout with volume = game on.
Note: NFA & DYOR
XAU/USD: Targeting $4,100! Where to Buy Before the FOMC Minutes?Hello TradingView community! 🚀
Gold (XAU/USD) continues to demonstrate incredible strength, consistently breaking past old highs and forming a solid upward price channel. This robust uptrend is not only technically reinforced but also awaits a potential catalyst from today's significant fundamental news.
In this analysis, we will combine two crucial perspectives: an in-depth look at the technical charts to identify optimal entry points, and an examination of the key fundamental event that could significantly impact Gold prices during the US session.
1. Fundamental Perspective: All Eyes on the FOMC Minutes
Today's market highlight, Wednesday, October 8, is the release of the FOMC Meeting Minutes at 2:00 PM ET
Why is this important? This document provides a detailed record of the latest policy meeting of the US Federal Reserve (FED) in September. Traders will scrutinise the text for any hints about the future interest rate path.
Potential scenarios:
"Dovish" Tone: If the minutes reveal FED officials' concerns about economic growth and the possibility of further rate cuts, the US Dollar might weaken. This would create a strong push for Gold (XAU/USD), potentially driving the next price surge.
"Hawkish" Tone: If the minutes emphasise that inflation remains a concern and the FED is not in a hurry to cut rates, the USD might see a short-term recovery, causing Gold to have a corrective dip.
This event is a top catalyst for volatility. Our strategy is to prepare technical zones to capitalise on the market's reaction.
2. Technical Analysis: Detailed Trading Plan
The bullish structure on the 2H timeframe is undeniable. Prices are creating a series of higher highs, confirmed by each "BoS" (Break of Structure), signalling that the Buyers are in full control. Here are the key zones to watch:
Potential Buy Zones (Key Points):
FVG Zone ($4,004): The nearest support is this Fair Value Gap, an area of price imbalance that the market often seeks to fill. Prices may retest this area before or during the news release.
"Buy Break BoS" Zone ($3,981): This is the nearest swing high that has been broken. Now it has turned from resistance into a crucial support level. This zone offers a solid entry point if prices correct slightly deeper.
"Bullish Order Block" Zone ($3,951): This is the last major "stronghold" of the Buyers—a powerful buy order block that initiated the latest push wave. This is an ideal area to look for buy orders if the market experiences a strong liquidity sweep downwards.
Upside Targets:
Short-term Target (Scalping): $4,070 - This level coincides with the 0.786 Fibonacci level.
Main Target: "Liquidity Sell" Zone at $4,103. This is a large "liquidity pool" where the Sellers' stop-loss orders are likely concentrated. Smart money often drives prices to such areas.
Strategy Summary
Main Trend: Bullish.
Core Strategy: Look for "Buy the dip" opportunities at the key support zones mentioned.
Critical Timing: Be cautious around the FOMC Minutes release (18:00 UTC). Volatility can be high, and the market may whip in both directions to sweep stop-losses before following the main trend.
Pro Tip: Patience is key. Waiting for prices to pull back to a confirmed support zone will provide a much better Risk/Reward ratio than chasing the market at the top.
WHAT'S YOUR VIEW?
How do you think Gold will react to today's FOMC minutes? And where are you looking to place your buy orders—at the FVG zone $4,004, the BoS level $3,981, or are you patiently waiting for the Order Block $3,951?
Share your views in the comments below!
👇 Don't forget to leave a Like 👍 and Follow the channel for the latest XAU/USD analysis updates!

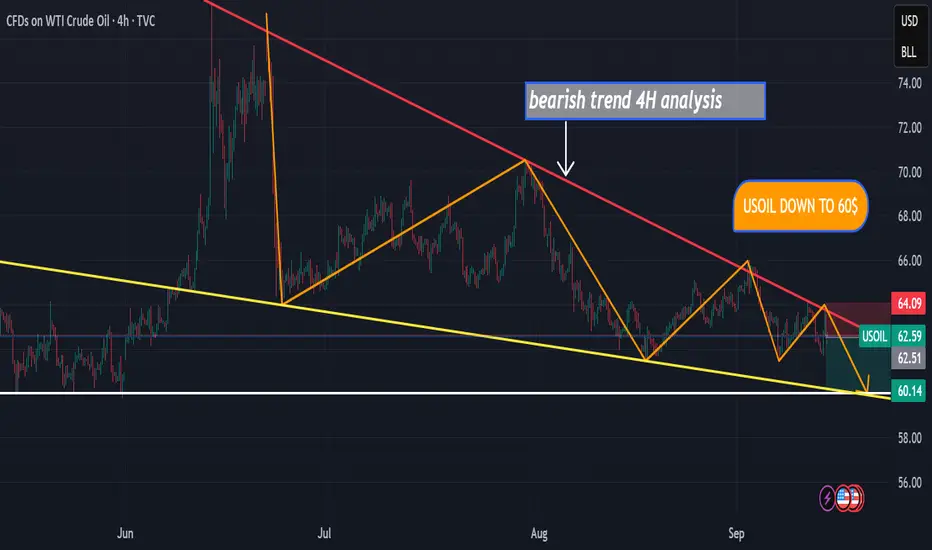
USOIL DOWN TO 60$hello,
I hope you’re doing well. I’ve identified a high-probability short setup on USOIL in the 4H timeframe. The chart is showing a clear downtrend, and based on the current momentum, I expect USOIL to reach the $60 level in the coming days
IBROURI Abdessamad
XAUUSD Gold Trading Strategy September 15, 2025XAUUSD Gold Trading Strategy September 15, 2025: Weekly trend outlook, gold still has enough conditions for the possibility of continued price increases.
Basic news: After surpassing the 3670 USD/ounce mark, the highest level in history, the gold price has entered a correction phase, in the context of the market focusing on monitoring the policy moves of the US Federal Reserve (Fed). According to CME's FedWatch tool, investors are almost certain that the Fed will cut interest rates by 25 basis points, bringing the margin to 4 - 4.25%. However, the scenario of the Fed cutting 50 basis points is still considered, because this could cause the USD to plummet and push gold to skyrocket.
Technical analysis: The sideway range of 3600 - 3660 is still holding. Currently, we will wait for trading points at the 2 edges of the sideway range, but the priority is still mainly trading according to the trend.
Important price zones today: 3600 - 3605 and 3660 - 3665. Today's trading trend: Sideway.
Recommended orders:
Plan 1: BUY XAUUSD zone 3600 - 3602
SL 3597
TP 3605 - 3615 - 3635 - 3665 - OPEN.
Plan 2: BUY XAUUSD zone 3618 - 3620
SL 3615
TP 3623 - 3630 - 3650 - 3665.
Plan 3: SELL XAUUSD zone 3663 - 3665
SL 3668
TP 3660 - 3650 - 3640 - 3630 (small volume).
Wish you a new week of safe, effective and profitable trading.🥰🥰🥰🥰🥰

PUNJAB NATIONAL BANKHello & welcome to this analysis
In my previous post on the bank I had suggested the likelihood of it declining to 103 where it had double bullish harmonic patterns. (link to that post is given)
Now the bullish harmonic Bat & reciprocal ABCD patterns are indicating the probability of a rally till 106 & 109 as long as it sustains above 100.
Immediate resistance at 104 with strong support near 102.50
All the best

Gold Trading Strategy XAUUSD September 5, 2025Gold Trading Strategy XAUUSD September 5, 2025: Gold rebounds after correction, market eyes on NFP data and Donald Trump's surprise statement for the week.
Fundamentals: Spot gold prices experienced extreme volatility on Thursday, with intraday swings reaching $53 before closing lower, currently trading at $3,557/oz, representing a gain of about $11 on the day. Gold's slight decline also reflects traders taking profits from the recent incredible rally. Investor focus now shifts to today's Non-Farm Payrolls report, which is expected to provide clues on the Federal Reserve's policy direction.
Technical analysis: Yesterday's strong decline showed investors' short-term profit-taking, but the current gold price is still trading above 3500. We continue to trade according to the main trend, waiting for support areas for long-term trading.
Important price zones today: 3525 - 3520 and 3495- 3500.
Today's trading trend: BUY.
Recommended orders:
Plan 1: BUY XAUUSD zone 3515 - 3517
SL 3512
TP 3520 - 3530 - 3550 - 3580.
Plan 2: BUY XAUUSD zone 3498 - 3500
SL 3495
TP 3503 - 3513 - 3530 - 3550.
Wishing you a safe, effective and profitable weekend trading day.🥰🥰🥰🥰🥰

Gold Trading Strategy XAUUSD September 4, 2025Gold Trading Strategy XAUUSD September 4, 2025: New all-time high of $3,578, gold eases to $3,536/oz as US ADP data takes center stage.
Fundamentals: Spot gold hit a record high on Wednesday as weaker-than-expected US jobs data weighed on the US dollar. Gold bulls are betting on further gains. The US Department of Labor's Bureau of Labor Statistics released its Job Openings and Labor Turnover Survey (JOLTS) report on Wednesday, showing that job vacancies, an indicator of labor demand, fell by 176,000 to 7.181 million on the last day of July. Economists surveyed by Reuters had previously forecast the number of vacant jobs in the United States at 7.378 million in July.
Technical analysis: After creating the latest ATH of 3578, the gold price corrected strongly to the 3511 area and then continued to increase; this can be considered a short-term profit-taking wave of the gold price. However, the selling pressure is still not strong. The multi-frame RSI is in the overbought area and shows signs of entering the buying zone. We continue to wait at the support areas combined with MA, Fib and FVG zones.
Important price zones today: 3495 - 3500 and 3475 - 3480.
Today's trading trend: BUY.
Recommended order:
Plan 1: BUY XAUUSD zone 3495 - 3497
SL 3492
TP 3500 - 3510 - 3530 - 3550 - OPEN.
Plan 2: BUY XAUUSD zone 3475 - 3477
SL 3472
TP 3480 - 3490 - 3520 - 3550 - OPEN.
Plan 3: SELL XAUUSD zone 3549 - 3551
SL 3554
TP 3546 - 3536 - 3516 - 3500. (small volume, effective before US session).
Wish you a safe, effective and profitable trading day.🌟🌟🌟🌟🌟

XAUUSD Gold Trading Strategy September 3, 2025XAUUSD Gold Trading Strategy September 3, 2025: Gold prices are stable, heading towards the $3,550 mark with ETF capital flows boosting and the market is also waiting for employment data and developments from the FED.
Basic news: Spot gold prices remained stable in today's Asian trading session, after rising sharply in the previous session. The current international gold price is around $3,531/ounce, according to CMC Group's FedWatch Tool, the market is pricing in nearly 92% of the possibility that the Fed will cut 25 basis points at the meeting on September 17.
Technical analysis: Spot gold prices continue to increase strongly. The rising price channel remains. Currently, the MA lines and the Fib frame are still very good support areas for prices, however, the RSI is in the overbought area; we should be careful that prices will have a correction first and then increase again. We limit FOMO, continue to wait at support zones combined between MA, Fib and FVG zone.
Important price zones today: 3500 - 3505 and 3475 - 3480.
Today's trading trend: BUY.
Recommended orders:
Plan 1: BUY XAUUSD zone 3500 - 3502
SL 3497
TP 3505 - 3515 - 3530 - 3550.
Plan 2: BUY XAUUSD zone 3475 - 3477
SL 3472
TP 3480 - 3490 - 3500 - 3530.
Wish you a safe, effective and profitable trading day.💯💯💯💯💯

XAUUSD Gold Trading Strategy September 1, 2025XAUUSD Gold Trading Strategy September 1, 2025: Gold reversed its decline and surged to its weekly target, boosted by U.S. PCE data and concerns about Fed independence.
Fundamentals: Gold prices reversed course in the U.S. trading session last week, erasing all losses and rising to a new high. After the US Personal Consumption Expenditures (PCE) inflation report largely met expectations, the precious metal traded near $3,454, its highest level since June 16. The weakening dollar supported gold prices, while traders continued to bet on the Federal Reserve's monetary easing measures in September.
Technical analysis: Gold prices, after breaking the 3,420 - 3,425 area, rose sharply to the 3,485 area and are heading towards the old ATH area of 3,500. We will now trade in an uptrend, waiting for a trading point at the combined support zones of MA, Fib and FVG.
Important price zones today: 3,420 - 3,425 and 3,445 - 3,450.
Today's trading trend: BUY.
Recommended orders:
Plan 1: BUY XAUUSD zone 3445 - 3447
SL 3442
TP 3450 - 3460 - 3480 - 3500.
Plan 2: BUY XAUUSD zone 3420 - 3422
SL 3417
TP 3425 - 3435 - 3455 - 3500.
Wish you a new week of safe, effective trading and lots of profit.🌟🌟🌟🌟🌟

XAUUSD Gold Trading Strategy August 27, 2025XAUUSD Gold Trading Strategy August 27, 2025: Gold prices remain in the rising price channel, trading opportunities for investors.
Basic news: CB Consumer Confidence Report (August) is 97.4, higher than the forecast of 96.4 but lower than last month's 98.7. News that President Trump decided to remove Federal Reserve Governor Lisa Cook still has a strong impact on the US Dollar, creating upward momentum for gold.
Technical analysis: Gold prices continue to fluctuate in the rising price channel, however, after approaching the 3395 area, gold prices are currently adjusting. MA lines, liquidity zones combined with Fib frames and price channels are still supporting the upward momentum for gold prices. We continue to wait for transactions in these support areas. There is a high possibility that spot gold prices will approach the 3410 - 3420 area and continue to be held.
Important price zones today: 3358 - 3363 and 3347 - 3352.
Today's trading trend: BUY.
Recommended orders:
Plan 1: BUY XAUUSD zone 3358 - 3360
SL 3355
TP 3363 - 3373 - 3393 - 3410.
Plan 2: BUY XAUUSD zone 3347 - 3349
SL 3344
TP 3352 - 3362 - 3382 - 3400.
Plan 3: SELL XAUUSD zone 3418 - 3420
SL 3423
TP 3415 - 3405 - 3395 - 3380 (small volume).
Wish you a safe, effective and profitable trading day.🥰🥰🥰🥰🥰

XAUUSD Gold Trading Strategy August 26, 2025XAUUSD Gold Trading Strategy August 26, 2025:
Gold surged after Trump's move, initial short-term bullish technical conditions in the trend of accumulation status.
Basic news: Gold surged after Trump's move, US President Donald Trump decided to remove Federal Reserve Governor Lisa Cook due to allegations that she falsified mortgage documents. This news affected the US Dollar index to fall sharply at the beginning of today's Asian trading session, while spot gold prices increased by nearly 35 USD.
Technical analysis: Gold prices returned to the support area of 3345 - 3350 after increasing sharply as previously predicted. The rising price channel on the H1 frame has been formed, currently the MA lines and liquidity zones are still supporting the increase in gold prices. In addition, the Fib frames are still effective trading areas. Gold prices may approach the area of 3410 - 3420 this week.
Important price zones today: 3353 - 3358 and 3340 - 3345.
Today's trading trend: BUY.
Recommended orders:
Plan 1: BUY XAUUSD zone 3353 - 3355
SL 3350
TP 3358 - 3368 - 3388 - 3410.
Plan 2: BUY XAUUSD zone 3340 - 3342
SL 3338
TP 3345 - 3355 - 3375 - 3400.
Plan 3: SELL XAUUSD zone 3420 - 3422
SL 3425
TP 3417 - 3410 - 3400 - 3390 (small volume).
Wish you a safe, successful and profitable trading day.🥰🥰🥰🥰🥰

Bearish Trade Setup for ETH/USDOverview:
The setup for this trade is based on a bearish outlook for Ethereum (ETH) against the US Dollar (USD) on the 1-hour chart. The entry, stop loss, and take profit levels are carefully defined to provide a balanced risk-to-reward ratio. Here's why this setup is a solid trade idea:
1. Trade Entry:
Entry Price: 4574.87
The entry point is set based on a recent price retracement within the prevailing downtrend. The price has shown signs of rejection from key resistance levels, and the trade is positioned to capitalize on further downside momentum.
2. Target Price:
Target Price: 4241.87
The target level is derived from technical analysis, where price is expected to move toward previous support levels, presenting a logical exit point for profits.
3. Stop Loss:
Stop Loss Price: 4741.37
The stop loss is placed above recent swing highs, ensuring the trade has enough room to breathe while minimizing the risk of false breakouts. This level is a protective measure to ensure that a reversal or unexpected price movement does not lead to unnecessary losses.
4. Risk-to-Reward Ratio:
RRR: The trade has an acceptable risk-to-reward ratio, where the potential reward outweighs the risk by more than 1:1. This is crucial for maintaining profitability over the long term.
5. Trend Analysis:
The market is currently in a bearish phase, as seen in the price action and the overall downtrend. The setup capitalizes on this momentum with a proper risk management strategy.
The use of indicators like moving averages can further confirm the downtrend, though they are not displayed here, they should align with the bearish trend.
6. Volume Confirmation:
The volume should ideally be decreasing during the retracement phase and increase during the move towards the target price, confirming the bearish continuation.
7. Conclusion:
This trade is well-positioned to take advantage of a continuation of the bearish trend. The entry, stop loss, and target are all logically placed based on key price levels and risk management principles. As always, ensure to monitor the trade, and be ready to adjust if market conditions change unexpectedly.

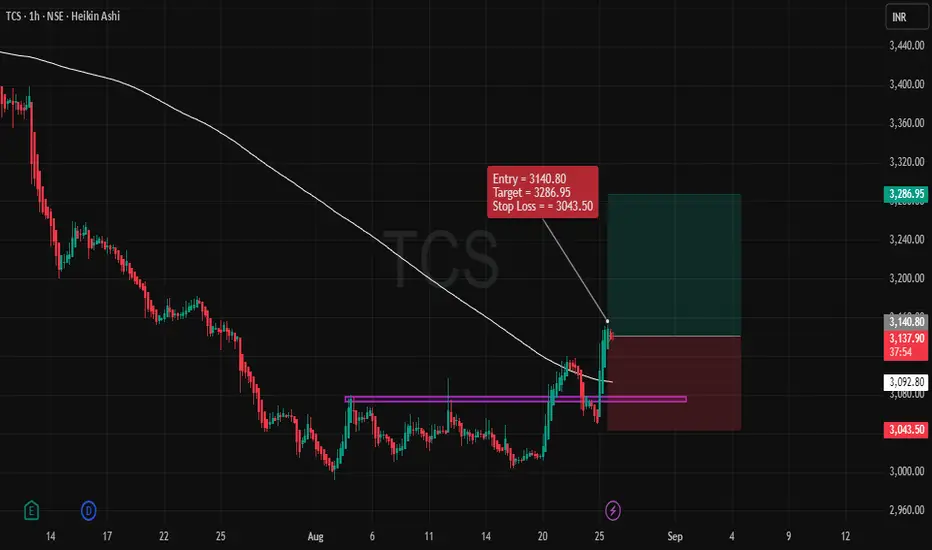
TCS – Bullish SetupSummary:
This trade setup is based on a bullish momentum seen in the recent price action of TCS. We are entering the position with the expectation that the price will continue to rise, following a significant upward breakout. The entry, stop loss (SL), and target price (TP) levels are set, and the risk-to-reward ratio (RRR) is favorable.
Key Points of the Trade:
Entry Point:
The entry for this position is at 3140.80, which is above the recent support level, indicating the continuation of the upward trend. The entry is triggered as the price has recently started to break through a key resistance zone, suggesting that the bullish momentum is likely to continue.
Stop Loss (SL):
The stop loss is set at 3043.50, just below the recent support zone. This ensures that we have a protective exit if the market reverses. Placing the stop loss here helps mitigate risk in case the trade goes against us.
Target Price (TP):
The target for this trade is 3286.95, a price level that corresponds to a recent resistance point. This target has been chosen based on the potential upside movement following the breakout, providing a good area for price to reach based on historical price action.
Risk-Reward Ratio (RRR):
With the entry at 3140.80, the stop loss at 3043.50, and the target at 3286.95, the RRR stands at 1:1.5. This is a healthy ratio, ensuring that the potential reward outweighs the risk, which is crucial for effective swing trading.
Market Context:
The price has recently bounced off a support level, and we are observing strong bullish momentum as the price moves above the resistance area. This suggests the market may continue its upward movement, making the trade setup valid.
Confirmation:
The recent price action and the movement above key levels provide confirmation of the trade. Additionally, the overall market sentiment for TCS is positive, which further validates the bullish trade idea.
Conclusion:
This trade setup is a bullish scenario for TCS, with a clear entry, stop loss, and target price. The risk-to-reward ratio is favorable, making this a logical and worthwhile trade to consider for swing trading on the 1-hour timeframe. Keep an eye on any changes in momentum or price action that may suggest a reversal, but as of now, the trend looks strong.
XAUUSD Gold Trading Strategy August 25, 2025XAUUSD Gold Trading Strategy August 25, 2025:
The market revolved around the FED and Trump, gold rose at the end of last week and was limited by the 0.236% Fib level.
Fundamental news: Mr. Powell's unexpectedly dovish remarks reinforced the market's hopes for a rate cut in September. As a result, the US Dollar Index fell sharply on Friday, reversing the upward trend of the first 4 trading days of the week. Moreover, the strong increase on Friday also pushed the gold price to skyrocket nearly 36 USD during the week.
Technical analysis: After a strong increase when it had compressed enough force in the bullish pattern and broke the downtrend channel on the H1 frame, the gold price at the beginning of this week's trading session is having a correction phase. The uptrend of gold is still maintained. The liquidity zones combined with FIB support and MA lines will now be our trading area. The gold price is very likely to return to the old ATH zone of 3500 this week.
Important price zones today: 3345 - 3350 and 3330 - 3335.
Today's trading trend: BUY.
Recommended orders:
Plan 1: BUY XAUUSD zone 3345 - 3347
SL 3342
TP 3350 - 3360 - 3370 - 3390.
Plan 2: BUY XAUUSD zone 3330 - 3332
SL 3327
TP 3335 - 3345 - 3355 - 3390.
Wish you a safe, successful and profitable trading week.🌟🌟🌟🌟🌟
