Ethereum Wyckoff Accumulation – Weekly Chart BreakdownEthereum Wyckoff Accumulation – Weekly Chart Breakdown
ETH is showing a textbook Wyckoff Accumulation pattern playing out on the 1W timeframe — and if it holds, we could be gearing up for a major breakout rally in the coming months.
Phase Breakdown:
✅ Phase A: Selling Climax (SC) marked the bottom. Automatic Rally (AR) set the resistance. Secondary Tests (ST) confirmed demand at lower levels.
✅ Phase B: Smart money accumulated heavily within the range — no directional move, just shakeouts and traps.
✅ Phase C: The Spring — price dipped below support to liquidate weak hands. Classic bear trap.
✅ Phase D (NOW): Recovery begins. If we see a Sign of Strength (SOS) above resistance with volume, Phase E (markup) is confirmed.
✅ Phase E: Full breakout mode. Higher highs, higher lows. Price discovery.
🟢 Accumulation Zone: $1,600–$1,300
🟢 Key Resistance: ~$3,600–$4,000
🟢 Projection Zone: $4,800 to $7,800+ (if SOS confirms)
✅ Bias: Bullish
Note: Watch for a clean breakout above the resistance zone. Low volume pullbacks = strength.
This is the kind of setup you don’t want to ignore.
Signals

Bitcoin Ready to Dump Again till $85000?CRYPTOCAP:BTC just tapped a key Short POI near resistance!
Bears stepping in hard below $99,550 — this is prime sniper zone.
▶️ Trade Setup (SMC x ICT):
▶️ Entry: $93,800–94,200
▶️ Targets: $90,000 → $86,000
▶️ Stop Loss: $99,600 (above structure)
Liquidity swept ✅
FVGs below ✅
Momentum shifting ✅

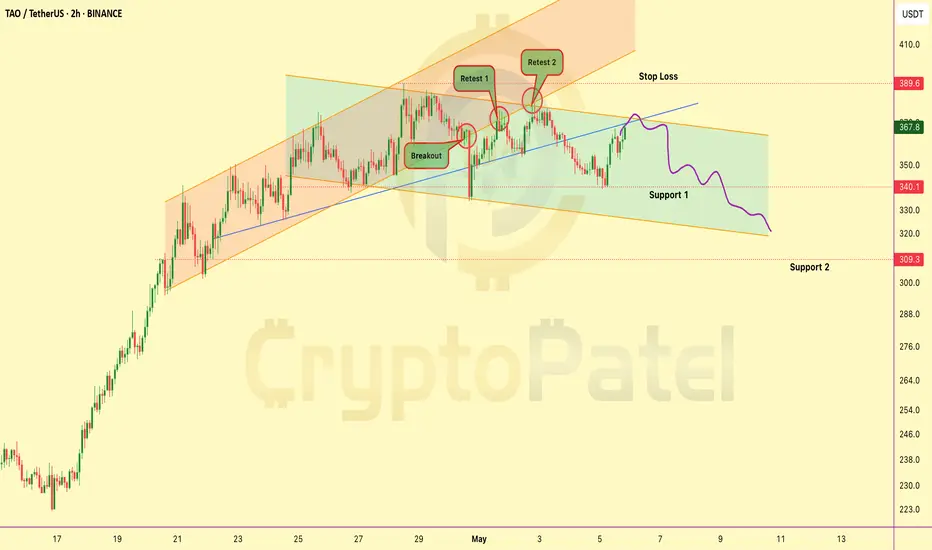
TAO/USDT Short Trade setup with Minimum Risk ZoneGETTEX:TAO looks like it's testing strong resistance at $369-$375. I'm planning to short at this level with targets at $340 and $310.
Risk management: Stop loss set at $389 for a safe exit if the price moves against the trade.
Technical setup shows a potential down move from this resistance zone. Watching for a drop to $240/$310 in the coming days. Stay cautious and trade safely!
Gold surges thanks to China buying goods, waiting for FED waveInternational gold prices jumped to 3,332 USD/ounce, up more than 72 USD compared to the bottom of last night's session. The main driving force came from the wave of gold buying in China, when concerns about the weakening economy caused people to massively turn to gold as a safe haven. The H4 chart shows a strong increase, EMA34 has crossed EMA89, establishing a clear short-term uptrend. If gold surpasses 3,340 USD, it is likely to head towards the old peak around 3,420–3,500 USD.
Crude oil prices are still fluctuating strongly around 57.2 USD/barrel, creating an unstable foundation for the commodity market. The FED will announce its policy in the early morning of May 8. Although it is expected to not change interest rates, any statement can move the market. This will be the next big catalyst for gold.

Gold price suddenly accelerates, approaching the 3,300 USD/ounceAfter two consecutive weeks of decline, the world gold price is showing strong signs of recovery when it skyrocketed to 3,266 USD/ounce - an increase of 25 USD in just one session. Although still quite far from the peak of 3,500 USD/ounce, the increase this morning shows that investor sentiment has begun to change direction.
The increase occurred at the beginning of the session despite previous negative forecasts, reflecting the sensitivity of gold to geopolitical and economic information such as US-China trade negotiations or the strength of the USD. The daily chart shows that gold has bounced strongly from the EMA34 support zone and returned to the resistance zone around 3,320–3,340 USD, opening up an opportunity to retest the 3,400 USD mark if the current increase is maintained.

Will Ethereum hit $12000 in current Bull Market?CRYPTOCAP:ETH just confirmed a monthly hammer close — strongest bullish signal of 2025 so far.
Last similar structure led to a +60% rally.
Price action + volume = Strong reversal setup.
Bias: Long | Accumulation Phase Activated 🚀
Note: NFA & DYOR

Gold recovers after deep fallWorld gold prices recovered to 3,238 USD/ounce on the morning of May 2 after hitting a bottom of 3,205 USD/ounce last night. The reason came from the sell-off when the Chinese market was on a long holiday, causing a lack of physical buying power.
However, investors quickly took advantage of this opportunity to buy, amid expectations that the FED would lower interest rates and central banks would continue to collect gold as a safe haven asset. The 4-hour chart shows that the price has bounced back from EMA89, heading towards the EMA34 resistance zone - a positive sign for a short-term recovery.

Gold continues to lose value, pressured by USD and China dataWorld gold prices fell to $3,279/ounce, down $31 from the previous session's peak. The USD increased slightly along with the decline of crude oil and US stocks, making gold less attractive.
In addition, weak economic data from China raised concerns about falling physical gold demand - contributing to the price decline. On the daily chart, gold is falling from the peak, approaching the EMA34, warning of the risk of a deeper correction if it fails to hold this support level.

Gold weakens under pressure from USD and bonds
On the morning of April 30, the world gold price fell to 3,318 USD/ounce, down 20 USD compared to the same time the previous day. The strong increase in USD and high US bond yields at 4.23% made gold lose its appeal in the eyes of investors.
The recovery of US stocks and the decline in oil prices further depressed market sentiment. On the H4 chart, gold has not yet escaped the sideways zone around EMA34 - a sign that buying power is weakening.

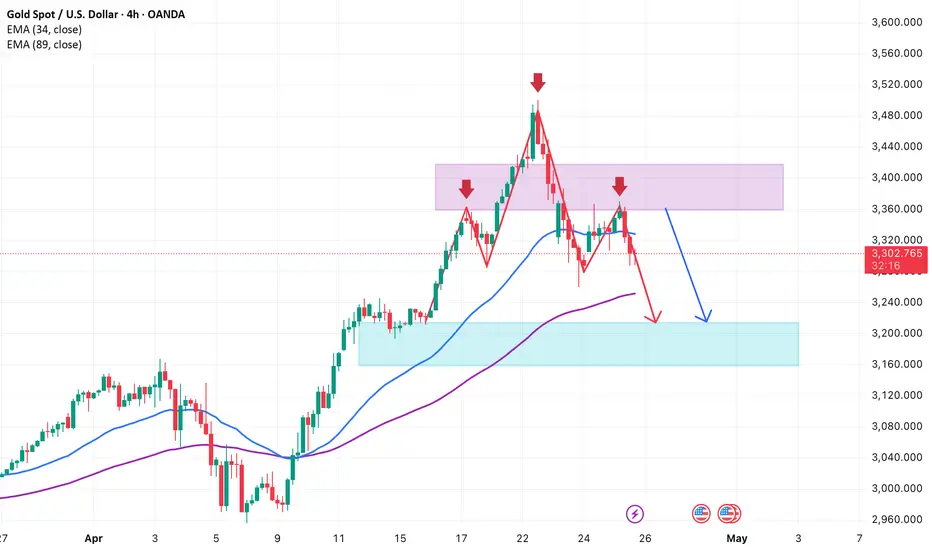
Gold forms a top patternOn the H4 chart, the gold price chart is forming a clear bearish structure after forming a three-peak pattern in a row around the $3,435–$3,470 range. Each time the price touches this range, it is strongly rejected, indicating that selling pressure controls the market. The fact that the price cannot maintain above the EMA34 and EMA9 at the same time is also a sign of confirmation of a weakening trend in the short term.
Although gold recovered slightly to the $3,365 range in the Asian session on April 25 thanks to news of PBOC money injection and a weakening USD, the buying pressure was not enough to break the bearish structure. The price quickly reversed and fell below the $3,300 mark, confirming the possibility of further correction in the near future.
Currently, the price has cut below the two EMAs and broken the nearest bottom at $3,290, triggering a bearish signal according to the “small head and shoulders” pattern on the H4. The next target is the strong support zone of $3,180–$3,220. If this zone is broken, the correction trend may extend deeper to the $3,100 area.
The appropriate short-term strategy at this time is to wait for the price to retrace to the $3,310–$3,330 area, cut losses above $3,350 and take profits around $3,200. The bullish scenario will only happen if the price breaks above $3,370 and closes above the old resistance – then the bearish structure will be broken.
Gold falls below $3,300International gold prices are currently trading around $3,290/ounce, down $40 from last week and far from the record high of $3,500. The bearish structure still prevails as gold is below the EMA34 and EMA89, while failing many times to regain the $3,300 mark.
Strong profit-taking pressure, a recovering USD and rising bond yields are dragging gold prices down, despite the previous optimistic expectations from the Kitco survey. If gold continues to weaken below $3,300, it could head towards $3,250, deeper into the $3,200–$3,220 range. Conversely, only when it surpasses $3,320 will the downtrend be challenged.
Short-term strategy: Prioritize selling when gold recovers weakly.

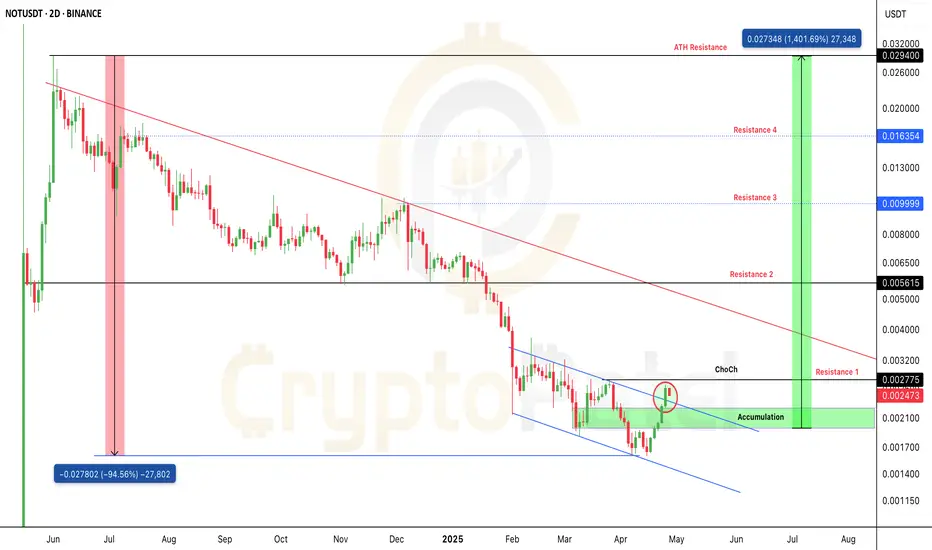
$NOT: Bottomed Out, Breakout Confirmed — Bulls Getting Stronger!GETTEX:NOT : Bottomed Out, Breakout Confirmed — Bulls Getting Stronger! Is This the Last Chance Before $0.03 and New ATH? 🚀
🔰 Current Status:
GETTEX:NOT has corrected -92% from its ATH and recently showed a strong bounce from the bottom, accompanied by a surge in volume.
🔰 Structure Analysis:
▪️ Price is currently forming Lower Lows (LL) and Lower Highs (LH).
▪️ A Change of Character (ChoCh) is identified around $0.0028.
➔ A breakout and candle close above $0.0028 would confirm a major trend reversal.
🔰 Pattern Breakout:
The price has also broken out from a falling wedge pattern, indicating that bullish momentum is building up.
🔰 Accumulation Zone:
Key accumulation area: $0.0022–$0.0019.
🔰 Targets:
Immediate resistance zones will act as the first targets post-breakout.
Major rally potential toward a New ATH if $0.0028 flips into support.
🔰 Risk Management:
Stop Loss suggested at: $0.001590 (below previous support structure).
Key Question:
Can GETTEX:NOT hit $0.03 in this altseason?
If ChoCh breakout and resistance flip are confirmed, $0.03+ becomes a highly probable target during strong altseason momentum.
DYOR — Trade Safe.
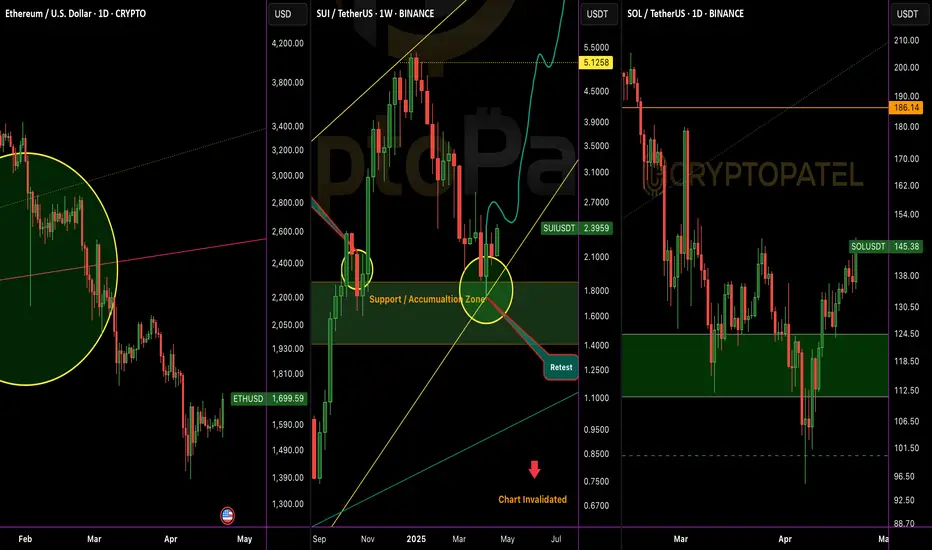
Bitcoin And Altcoins Price Difference🚨 2 months ago, #Bitcoin hit $90K and alts were flying:
CRYPTOCAP:ETH – $2,850
CRYPTOCAP:SUI – $3.50
CRYPTOCAP:SOL – $180
Today, BTC is BACK above $90K… but alts are in the dip!
CRYPTOCAP:ETH – $1,700
CRYPTOCAP:SUI – $2.40
CRYPTOCAP:SOL – $145
Never Forget to Buy at F*** Dip you Planning for Long Run
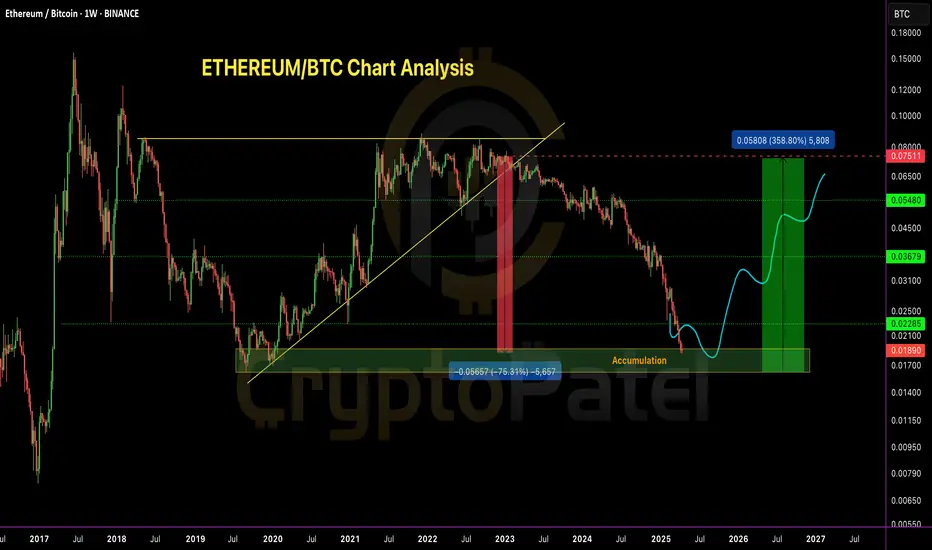
ETH/BTC Profit Update – As Predicted! ( 75% Down From Level )ETH/BTC Profit Update – As Predicted!
Many was Laughing But ETH/BTC is now down 75% from my previous exit call at 0.075 BTC — hope you enjoyed the ride and took profits when it mattered ✅
Current Price: ~0.019 BTC
We are now entering a strong accumulation zone between 0.019–0.015 BTC.
What to do now?
Start accumulating ETH slowly — build a position by buying dips to get a solid average entry for the next cycle.
Bull Market Targets: 0.05 BTC/0.07 BTC/0.09 BTC
Pro tip : Keep these Targets in mind not just for ETH/BTC… but also to plan exits on ETH/USDT during altseason!
This zone could be a game-changer. Act smart. Accumulate patiently.
NZDUSD Daily Timeframe, SellPrice has taken out the previous higher high, followed by a break/sweep below the swing low, indicating a potential shift in market structure. We're now seeing a strong bearish move to the downside, suggesting the formation of a new trading range.
Currently, price has retraced approximately 90% of this range and entered a key daily supply (sell) zone.
Points of concern: The pullback is relatively deep, which slightly weakens the setup.
The last three daily candles have closed bullish, indicating short-term buying pressure.
This setup may play out at the market open, which increases risk due to potential Sunday night spreads or gaps.
Positive Aspects:
The overall structure favors a short position, aligning with both higher and lower timeframes.
Bullish volume appears to be decreasing, signaling potential exhaustion of buyers.
The setup offers a great risk-to-reward ratio with several TP's.
Let's see how the setup will preform.
Blessings, T

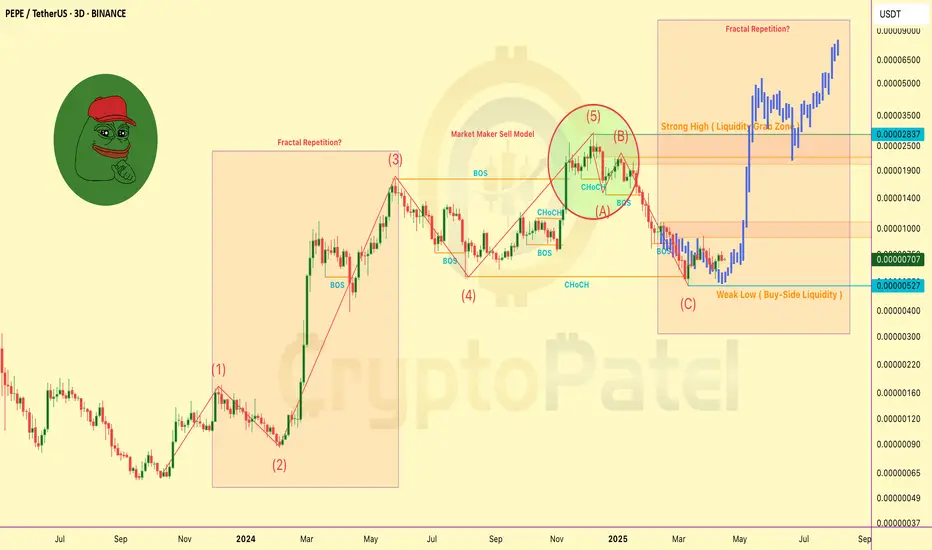
PEPE/USDT – 3D Chart Technical Breakdown (April 2025)PEPE/USDT – 3D Chart Technical Breakdown (April 2025)
Based on SMC, ICT, Elliott Wave, and Fractal Analysis
Major Structure Insights:
▪️ PEPE completed a 5-wave Elliott impulsive rally followed by an ABC corrective wave.
▪️ Wave C swept the buy-side liquidity near 0.00000527, triggering potential reversal.
▪️ Recent CHoCH and BOS suggest a trend shift back to bullish.
Fractal Repetition Detected!
▪️ Previous bullish pattern is repeating – similar structure and accumulation signs.
▪️ Market Maker Sell Model played out perfectly at the top before correction began.
Key Liquidity Zones:
🔵 Weak Low: 0.00000527 (swept)
🟠 Strong High: 0.00002837 (targeted)
▪️ Intermediate Levels: 0.00001000, 0.00001900, 0.00002837
▪️ Final Expansion Projection: 0.000065–0.000090
Smart Money Concepts Confirmed:
▪️ Liquidity engineered and swept at lows
▪️ Institutional entry signs after BOS
▪️ Fractal structure supports a bullish continuation phase
Outlook:
If structure holds and price continues above 0.00000600, next leg toward 0.000019–0.00002837 could be explosive.
Below 0.00000500 = Invalidation zone.
Note: This is a technical viewpoint for educational purposes.
DYOR – Not Financial Advice.
Gold’s New All-Time High Could Be #Bitcoin Signal🚨 Gold’s New All-Time High Could Be #Bitcoin Signal 🟡
And if history repeats, Bitcoin could be next.
Every time #Gold moves first, Bitcoin usually follows with a major rally. If that happens again, we could see a new Bitcoin ATH in Q2-Q4 of 2025.
Are you ready for the next big move? 🚀
CRYPTOCAP:BTC #BullMarket

Bitcoin Ready for New ATH or New LowBitcoin Update:
If Bitcoin Price Break $83000 and 4H Close above then It Turned into Bullish Mode Otherwise Ready for New Low Again....

Ethereum Still down from 2018 ATHIf you had invested in Ethereum exactly 7 years ago (2,646 days),
you would be at a 7.5% loss at today’s lowest price. 😳
Yes, even ETH — one of the biggest and strongest cryptos — is down.
That’s how tough the market is right now. 🩸

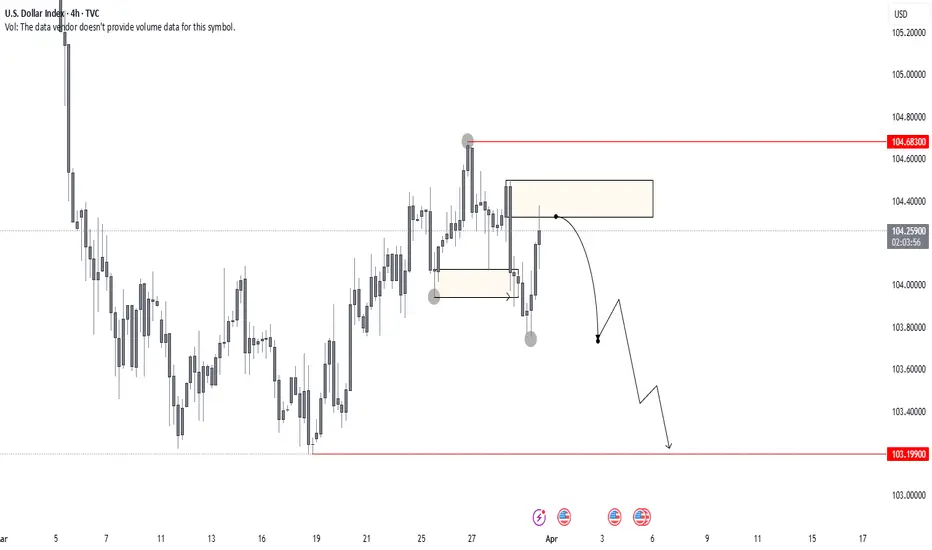
US DOLLARTo confirm my EU view, here is DXY.
The buy zone didn’t hold—price broke through, sustained below, and established a strong new trading range. It just reacted off the 4H sell zone, confirming weakness. Now, all eyes on DXY for a sell-off.
With that being said, fundamentals are heavy this week, so keeping risk in check is key.
Blessings, T
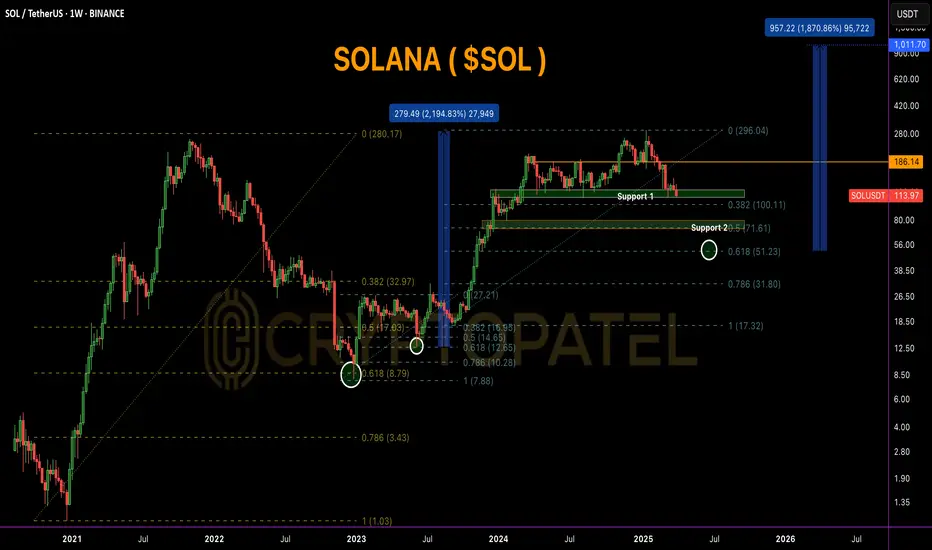
SOLANA Weekly Chart Breakdown–2020 Fractal Signals Massive Bull#SOLANA Weekly Chart Breakdown – 2020 Fractal Signals Massive Rally Ahead!
CRYPTOCAP:SOL is trading at $114.35, currently sitting on a key Fibonacci 0.382 support zone ($100–$115). This area has historically acted as a strong bounce level and is perfect for early accumulation.
If this zone fails, the next major support is the golden pocket ($50–$72) — also marked as Support 2, aligning with the 0.618 Fib retracement.
Historically, this level triggered a 2,100% rally back in 2020-21. If this fractal pattern repeats, we could be looking at a future target near $1,000+.
Breakout level to watch:
▪️ $186 = Bullish confirmation
▪️ $296 = Previous ATH
▪️ $1,011 = Fibonacci-based bull cycle target
Accumulation Plan:
▪️ Zone 1: $100–$115 → Light spot entries
▪️ Zone 2: $50–$72 → Heavy long-term accumulation
✅ Holding above $100 keeps the bullish structure intact.
✅ Break above $186 = start of the next bull wave.
Smart accumulation now can lead to 10x+ returns in the upcoming cycle!
It's All About SO/USDT Overview.
Bitcoin Short played out perfectly and Down 7%Bitcoin Short played out perfectly.
Price respected the SMC chart structure — 4H candle failed to close above FVG + -OB zone.
Post Trump Tariff news, market triggered high-leverage stop hunts with a fake pump before a sharp dump.
📉 Entry: $88,440 ✅
📈 Exit: $82,200 ✅
✅ ~7% move captured. Trade closed in profit.

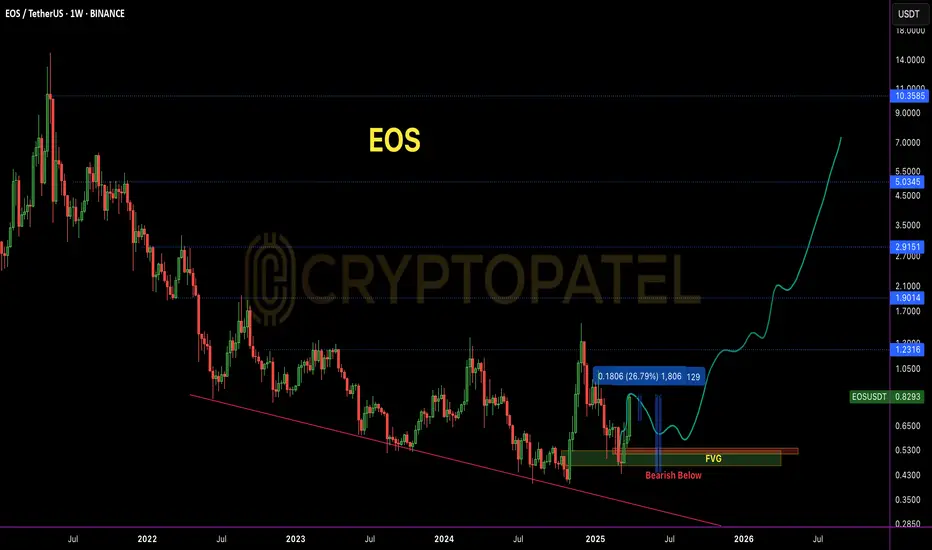
EOS Broke Out After Months — But Is This Just the Beginning?NYSE:EOS Broke Out After Months — But Is This Just the Beginning?
#EOS was once a top-tier asset, trading above $15. However, due to consistent development delays and unmet commitments, the price structure gradually broke down, eventually bottoming near the $0.40 zone — a key historical demand area.
Recent Development: EOS witnessed a sharp rally of +94% in the last month, with a strong +26% daily candle, backed by bullish news:
✅ Formation of Vaulta Banking Advisory Council (includes ex-Binance Canada CEO)
✅ CMO Tristan Dickinson teased a major upcoming announcement
Current Market Structure:
▶️ Price broke out of a long-term accumulation range
▶️ Volume spike confirms genuine interest
▶️ However, one FVG (Fair Value Gap) is still unfilled between $0.60–$0.50 zone on the 4H chart
Ideal Entry Zone (Pullback Play):
▶️ Watch for a retest near $0.60–$0.50
▶️ FVG fill + potential bullish OB (Order Block) = Confluence zone for long setups
🛑 Invalidation / Stop-Loss:
▶️ Breakdown below $0.43 on high volume will invalidate the structure
▶️ SL is wide, but RR (Risk-Reward) setup is favorable for swing traders
Long-Term Upside Targets:
First target: $0.95–$1.10 (range high breakout)
Mid-term target: $1.45+
Long-term potential if fundamentals sustain
⚠️ Manage your position size. NFA | DYOR | Risk Management is Key