Ethereum Still down from 2018 ATHIf you had invested in Ethereum exactly 7 years ago (2,646 days),
you would be at a 7.5% loss at today’s lowest price. 😳
Yes, even ETH — one of the biggest and strongest cryptos — is down.
That’s how tough the market is right now. 🩸
Signals

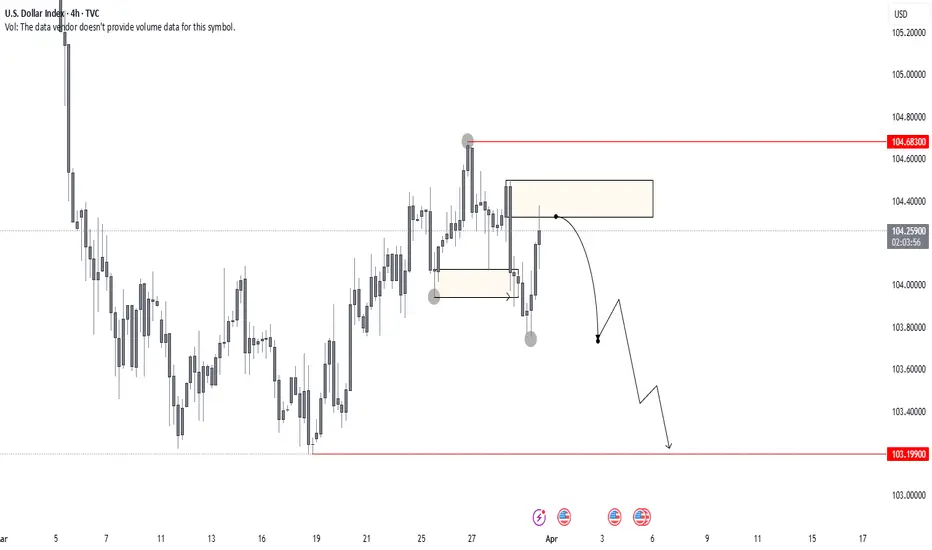
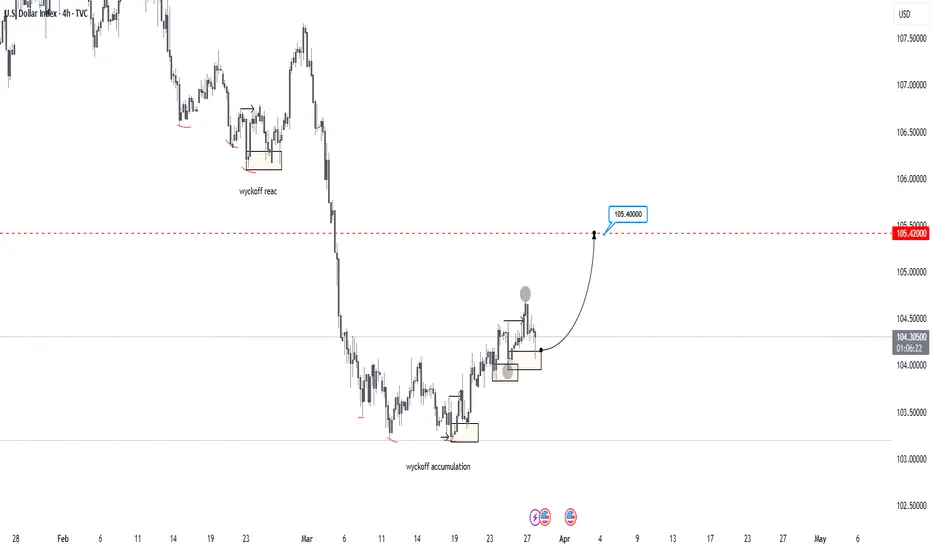
US DOLLARTo confirm my EU view, here is DXY.
The buy zone didn’t hold—price broke through, sustained below, and established a strong new trading range. It just reacted off the 4H sell zone, confirming weakness. Now, all eyes on DXY for a sell-off.
With that being said, fundamentals are heavy this week, so keeping risk in check is key.
Blessings, T
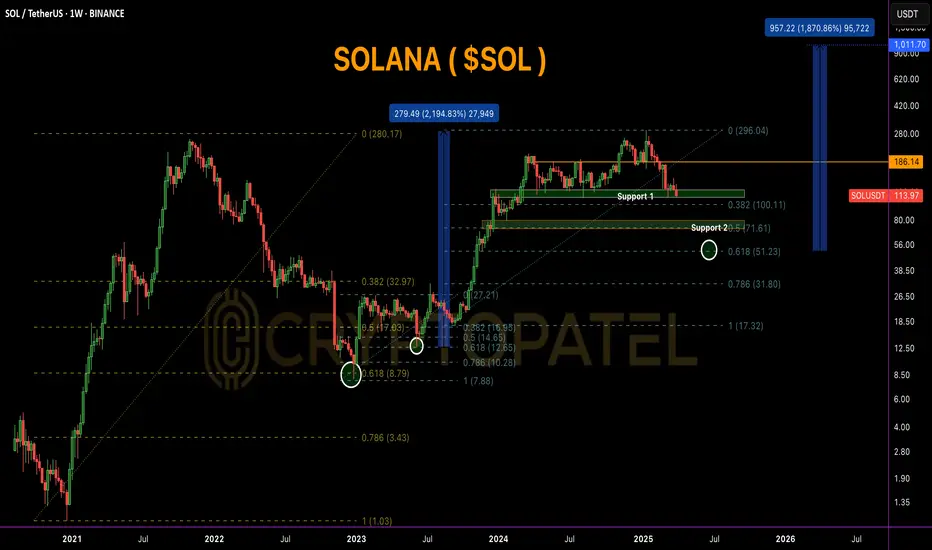
SOLANA Weekly Chart Breakdown–2020 Fractal Signals Massive Bull#SOLANA Weekly Chart Breakdown – 2020 Fractal Signals Massive Rally Ahead!
CRYPTOCAP:SOL is trading at $114.35, currently sitting on a key Fibonacci 0.382 support zone ($100–$115). This area has historically acted as a strong bounce level and is perfect for early accumulation.
If this zone fails, the next major support is the golden pocket ($50–$72) — also marked as Support 2, aligning with the 0.618 Fib retracement.
Historically, this level triggered a 2,100% rally back in 2020-21. If this fractal pattern repeats, we could be looking at a future target near $1,000+.
Breakout level to watch:
▪️ $186 = Bullish confirmation
▪️ $296 = Previous ATH
▪️ $1,011 = Fibonacci-based bull cycle target
Accumulation Plan:
▪️ Zone 1: $100–$115 → Light spot entries
▪️ Zone 2: $50–$72 → Heavy long-term accumulation
✅ Holding above $100 keeps the bullish structure intact.
✅ Break above $186 = start of the next bull wave.
Smart accumulation now can lead to 10x+ returns in the upcoming cycle!
It's All About SO/USDT Overview.
Bitcoin Short played out perfectly and Down 7%Bitcoin Short played out perfectly.
Price respected the SMC chart structure — 4H candle failed to close above FVG + -OB zone.
Post Trump Tariff news, market triggered high-leverage stop hunts with a fake pump before a sharp dump.
📉 Entry: $88,440 ✅
📈 Exit: $82,200 ✅
✅ ~7% move captured. Trade closed in profit.

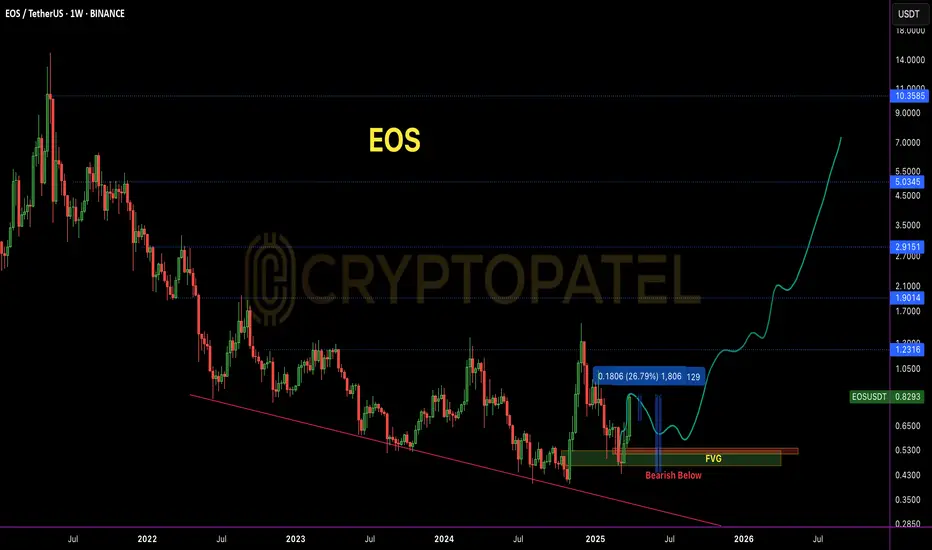
EOS Broke Out After Months — But Is This Just the Beginning?NYSE:EOS Broke Out After Months — But Is This Just the Beginning?
#EOS was once a top-tier asset, trading above $15. However, due to consistent development delays and unmet commitments, the price structure gradually broke down, eventually bottoming near the $0.40 zone — a key historical demand area.
Recent Development: EOS witnessed a sharp rally of +94% in the last month, with a strong +26% daily candle, backed by bullish news:
✅ Formation of Vaulta Banking Advisory Council (includes ex-Binance Canada CEO)
✅ CMO Tristan Dickinson teased a major upcoming announcement
Current Market Structure:
▶️ Price broke out of a long-term accumulation range
▶️ Volume spike confirms genuine interest
▶️ However, one FVG (Fair Value Gap) is still unfilled between $0.60–$0.50 zone on the 4H chart
Ideal Entry Zone (Pullback Play):
▶️ Watch for a retest near $0.60–$0.50
▶️ FVG fill + potential bullish OB (Order Block) = Confluence zone for long setups
🛑 Invalidation / Stop-Loss:
▶️ Breakdown below $0.43 on high volume will invalidate the structure
▶️ SL is wide, but RR (Risk-Reward) setup is favorable for swing traders
Long-Term Upside Targets:
First target: $0.95–$1.10 (range high breakout)
Mid-term target: $1.45+
Long-term potential if fundamentals sustain
⚠️ Manage your position size. NFA | DYOR | Risk Management is Key
Bitcoin Next move?#Bitcoin reclaimed $85,000, but structurally a deeper retrace remains possible.
Classic TA suggests sustainable rallies often revisit key Fib levels:
1⃣ 0.618 Fib: $69,646
▪️ FVG: $75,582 – $69,916
2⃣ 0.786 Fib: $61,524
▪️ FVG: $64,789 – $63,435
A sweep of these zones could fuel the next leg toward $150K–$180K.
#BTC CRYPTOCAP:BTC

NZDJPY BUYS?As you can see, NJ retraced deeply into the OTS (Optimal Trading Segment) on the daily timeframe. The red line, where the price is currently sitting, can be seen as a daily demand zone.
Looking at the 4H price action, you can observe strong bearish pressure, which is why I need confirmations on a smaller timeframe. What I like is how the price has stopped at this level and is now consolidating, forming new structure points on lower timeframes. The 15-minute structure looks clean to me and Flip happened so I will be looking for buys there.
Blessings, T

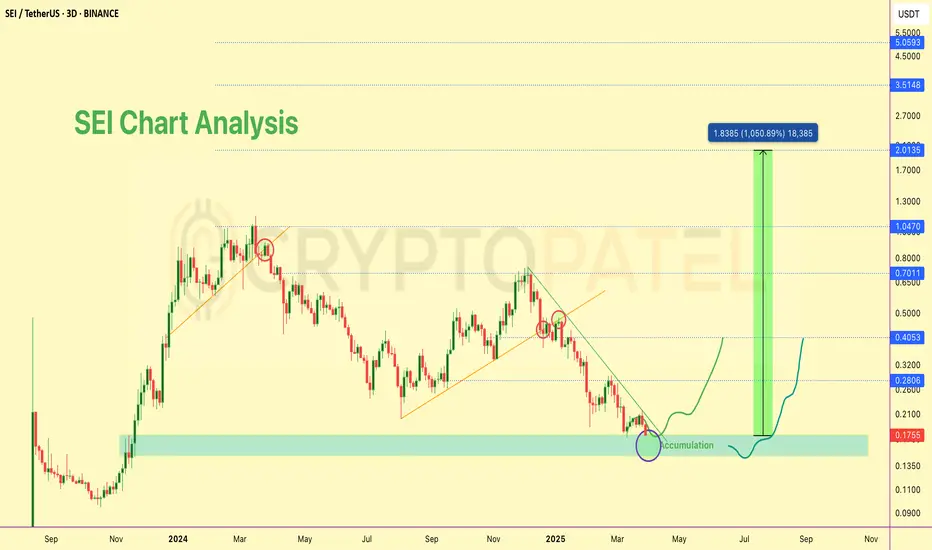
$SEI/USDT- Long-Term Technical Setup and $5 Potential in BullRun📊 $SEI/USDT – Long-Term Technical Setup
NYSE:SEI is holding strong at the $0.18 support zone, showing early signs of accumulation. This level has historically acted as a demand area, making it a key zone to watch.
🔹 Structure: Forming higher lows – bullish trend intact
🔹 Volume: Accumulation pressure building
🔹 Sentiment: Backed by large-scale buyers (e.g., Trump’s World Liberty)
📈 Long-Term Targets:
➡️ $0.45 → $1.00 → $2 / $3 / $5 (macro targets similar to CRYPTOCAP:SUI )
🛑 Invalidation: Close below $0.15
⚠️ Not financial advice. DYOR.
#SEI #CryptoTA #Altcoins #DYOR #TechnicalAnalysis
$ETH has dropped -40% since Eric Trump recommended buying it.JUST IN : CRYPTOCAP:ETH has dropped -40% since Eric Trump recommended buying it.
Just a gentle reminder to always DYOR (Do Your Own Research) before making investment decisions.
#Ethereum

Will Ethereum Drop below $1000 or Hit $10,000 in This Bull Run?One Golden Rule in Trading: Always buy the dip on fundamentally strong projects with 5x–10x potential in the near future.
Patience + conviction = profits.
#Ethereum CRYPTOCAP:ETH

BULLISH ON US DOLLAR!As you can see on the chart, I am bullish on DXY. If you look at it from a technical perspective, you can see that after the accumulation schematic was complete, the dollar started gaining value. Price now needs to enter the markup phase. Looking at the current structure, price has formed a new trading range while breaking the high/structure to the left. A sharp reaction from that zone is a good sign. If the 4H candle closes bullish like this, it could be a strong indicator of bullish momentum building. Let's see. Overall, a pretty straightforward read.
Blessings, T
USDJPYA textbook setup. As you can see price came int the 4H Demand zone. It made push down and 15min trading range. Now waiting for the high of that range to be taken out and price to sustain above for a while and then return back and continue higher.
If you look on 5min, price already provided intraday setup to the left but to get odds into my favour I waut for 15min BOS. Lets wait and see what happens. If not you know, when price does not break the high it will break the low.
Blessings, T

Gold Facing Market Storm: Will The Uptrend Continue?The gold market is witnessing strong fluctuations as money flows continuously between safe-haven assets. Gold prices briefly jumped above $3,030/ounce in overnight trading, but profit-taking pressure quickly appeared, pushing prices down to $3,018 this morning. However, the overall trend is still leaning towards the uptrend as supportive factors continue to dominate the market.
Bank of America forecasts that gold could reach an average of $3,063/ounce this year and go further to $3,350/ounce in 2026. The main driving force comes from central banks increasing their gold reserves, especially from China. At the same time, economic instability and strong adjustments in the US stock market are stimulating money flows to precious metals.
On the technical chart, gold is fluctuating in the accumulation zone after the previous strong increase. If the price stays above $3,030 and breaks short-term resistance, the possibility of rising to higher levels is completely possible. However, fluctuations will still occur when investors take advantage of price increases to take short-term profits. Overall, with a solid support foundation from the macro economy, gold still has room to continue its upward momentum in the coming time.

NZDCHFAs you can see, the price is trading in a swing buy level if you look to the left. The current 4H structure shows that the price has finally made a strong move to the upside after a long consolidation. This indicates that order flow is clear, and there are more buyers present in the market.
I have marked the 4H buy zone and am expecting the price to give me an opportunity to buy from there. There are several targets, but overall, it looks like a textbook setup.
Let’s wait and see. Blessings, T.

EURUSDIf you go on 4H you can see to the left in the last couple of months EurUsd has consistantly been making HH and it has been in an up trend, however on Monday market open price has made an important new leg and new Trading range was made. Not the strongest one yet, however suitable for looking for trades. On the rigth side of the screen you can see I where I have looked for a trade opportunity. If you zoom in on an 15 min time frame you can see great short opportunities today, 2 to be exact. Waiting for price to drop and take out the most recent low. Now there is more of a educational explenation while on 15min you can go and see what is happening into the region where the price is currently sitting at.
Blessings, T

Will TON/USDT Hit $100 in Near Future? $TONCOIN – Technical Analysis Update
CRYPTOCAP:TON is currently displaying a bullish structure, following a strong bounce from the key support/retest zone at $2.50.
🔹 Support Zone: $2.50
🔹 Accumulation Range: $3.50 – $2.50
🔹 Trend Outlook: As long as price sustains above $2.30–$2.50 zone, the structure remains bullish.
📈 Potential Upside Targets:
▪️ $20
▪️ $30
▪️ $40
▪️ $50
▪️ $100 (macro target on long-term breakout)
🔻 Invalidation Level (Bearish Bias):
If CRYPTOCAP:TON breaks below $2.30 and fails to reclaim it, bearish momentum may resume.
📝 Disclaimer: This is a technical analysis view, not financial advice. Always DYOR before making any investment decisions.

Will Bitcoin Fill FVG Before the Next Leg Up?Will Bitcoin Fill FVG Before the Next Leg Up?
📌 FVG 1: $74,483 - $70,796
📌 FVG 2: $64,800 - $62,033
With liquidity gaps below, will BTC retrace before resuming its uptrend? Or are we heading straight for new highs?
Drop your thoughts! 👇 #Bitcoin #Crypto #BTC

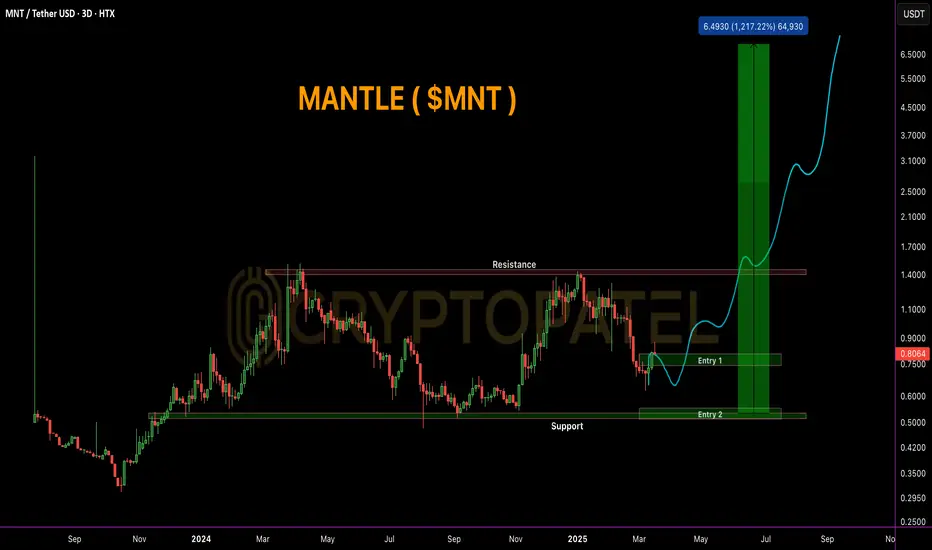
$MNT Technical Analysis – Road to $8? 🚨 TSX:MNT Technical Analysis – Road to $8? 🚨
🔹 Market Sentiment: High potential in #Altseason with TSX:MNT being a key contender. Likely $TRUMP's World Liberty Pick, adding more bullish conviction.
🔹 Best Accumulation Zones:
📍 Entry 1: $0.80 - $0.70
📍 Entry 2: $0.55 - $0.50
🔹 Targets:
✅ $1.40 – First breakout test
✅ $3.00 – Mid-range bullish target
✅ $5.00 – Major resistance flip
✅ $8.00 – Full altseason target
⚠️ Risk Management: Below $0.50, I do not recommend holding. Always manage risk & secure profits at key levels.
💡 Conclusion: TSX:MNT has strong upside potential, but NFA – DYOR before investing.
#Mantle #MNT #Crypto #Altseason
Ethereum Accumulation Alert! 🚀 Ethereum Accumulation Alert! 🔥
Ethereum is entering a potential spring accumulation zone, presenting a solid long-term opportunity.
📉 Buy Zone: $1,900 – $1,550
🎯 Targets: $5,000 / $7,500 / $10,000
🔹 Key Support: $1,550 – Holding above this level keeps the bullish structure intact.
🔹 Breakdown Risk: If ETH loses $1,550, expect further downside toward sub-$1,000, where the next strong entry lies.
📊 Smart money is accumulating—don’t miss the dip!
#Ethereum #CryptoTrading #Accumulation #ETH #NFA #DYOR

SEI/USDT 20x Potential from Accumulation ZoneNYSE:SEI Accumulation Zone – High Potential Trade
🔹 -76% from recent high, making it a prime accumulation zone.
🔹 My Accumulation Zone: $0.20 – $0.15
🔹 Upside Potential: Chart indicates an easy move to $0.50—if it breaks, expect a major rally!
🔹 Long-Term Targets: $1/$3/$5/$10
🔹 Catalyst Alert: Even #TRUMP is accumulating #SEI adding strong bullish momentum!
Strategy: Accumulate on dips, take profits strategically, and hold a portion for long-term gains.
#Altcoins #NFA

#Ethereum Wyckoff Re-Accumulation#Ethereum Wyckoff Re-Accumulation
If this level holds, it could be the ideal accumulation zone for long-term investments.
CRYPTOCAP:ETH

Will BNB hit $5000 in future?Back in 2020, I said GETTEX:BNB will hit $500 when it was just $16… and y’all laughed. 🤡
But guess what? It didn’t just hit $500… it went all the way to $800—a 50x from my entry! 😎💰
And yeah, right after I entered, GETTEX:BNB dumped almost 62%! 💀😂 But diamond hands win in the end! 💎🙌
Now, it won’t even drop below $500! 😏
Just wait… GETTEX:BNB → $5000 is only a matter of time! ⏳🚀
Not financial advice, so don’t blame me later. DYOR! 😆

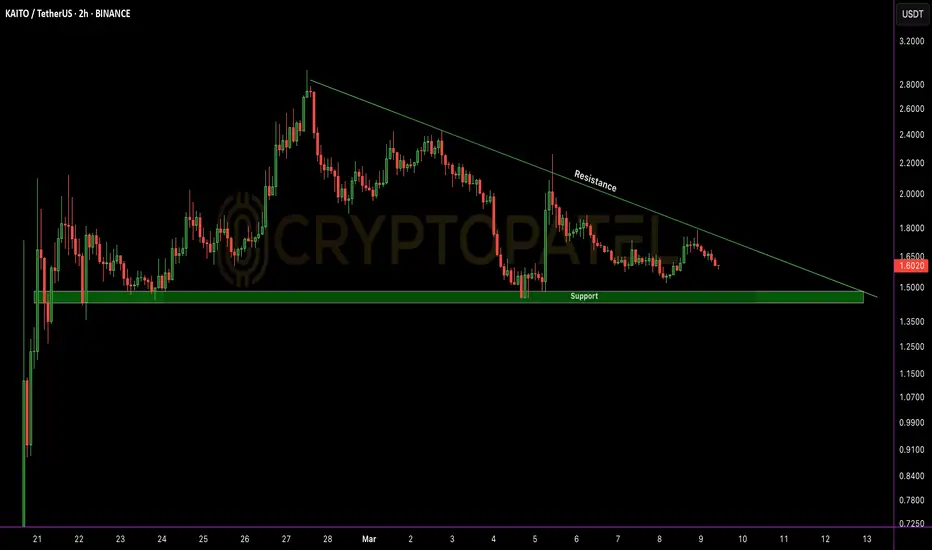
Will $KAITO go down -50% downside move?$KAITO Price Action Update
$KAITO is currently trading at $1.58, holding strong above the key $1.45 support level.
🔹 Key Levels to Watch:
✅ Support: $1.45 – Holding above this level could trigger a strong upside rally, targeting the $1.75 resistance and beyond.
❌ Break Below Support: If $1.45 fails, a 30-50% downside move is possible.
🚀 A decisive move above $1.75 could open doors for further gains. Keep a close watch on these levels for potential opportunities.
🔍 Stay informed, manage risk, and trade wisely.
📢 DYOR – This is not financial advice!
#KAITO #CryptoTrading #MarketUpdate #TechnicalAnalysis