Gold Fluctuates in Support Range; Accumulation Signals Rise⏰ Timeframe: 30m
📅 Update: 24/11/2025
🔍 Market Context
After a corrective decline from the 4,104 USD area, gold is moving within a range-bound structure with strong support at the 4,003–4,023 USD area.
The market is in a short-term re-accumulation phase, as consecutive CHoCH movements appear around the bottom area — reflecting the buying side's effort to absorb liquidity.
The selling side temporarily controls, but balancing signals are becoming clearer as the price continuously rejects breaking deeply below the Demand Zone.
📊 Technical Structure
Resistance Zone (4,090–4,104 USD): main supply area, confluence with Fibo 1.0, where profit-taking reactions are likely if the price rebounds.
Support Zone (4,023 USD): intermediate support, playing a key role in the current sideways structure.
Demand Zone (4,003 USD): potential demand area, confluence with previous liquidity bottom – main BUY Zone area.
Structure Bias: still inclined towards accumulation – recovery, as long as the price maintains above 4,003 USD.
🎯 Market Outlook
1️⃣ Priority Scenario (Buy setup):
• The price may continue to retest the Demand Zone (4,003–4,023 USD).
• When a clear reaction signal appears, expect a recovery to the Fibo 0.618 → 1.0 area, corresponding to 4,075–4,104 USD.
2️⃣ Secondary Scenario (Breakdown):
• If the price breaks below 4,003 USD, the recovery structure will be invalidated, bringing gold back to the lower liquidity area around 3,985 USD.
💎 Key Zones
BUY Zone: 4,003 – 4,023 USD
SELL Zone: 4,090 – 4,104 USD
🧠 Analyst’s View
Gold is currently in a liquidity re-accumulation phase, as both sides are testing the lower boundary of the main support area.
The buying side needs confirmation with a break above 4,075 USD, while the selling side still holds the advantage if the price cannot maintain above the balance area.
In the current context, price behavior leans towards the “Sweep – Retest – Expansion” model, with the potential for forming a short-term technical recovery wave.
🛡️ Risk Note
The market is in a low volatility area – avoid emotional actions without clear structural confirmation.
Signaltrading

Gold Technical Retracement Before Continuing Main Uptrend⏰ Timeframe: 30m
📅 Update: 11/14/2025
🔍 Market Context
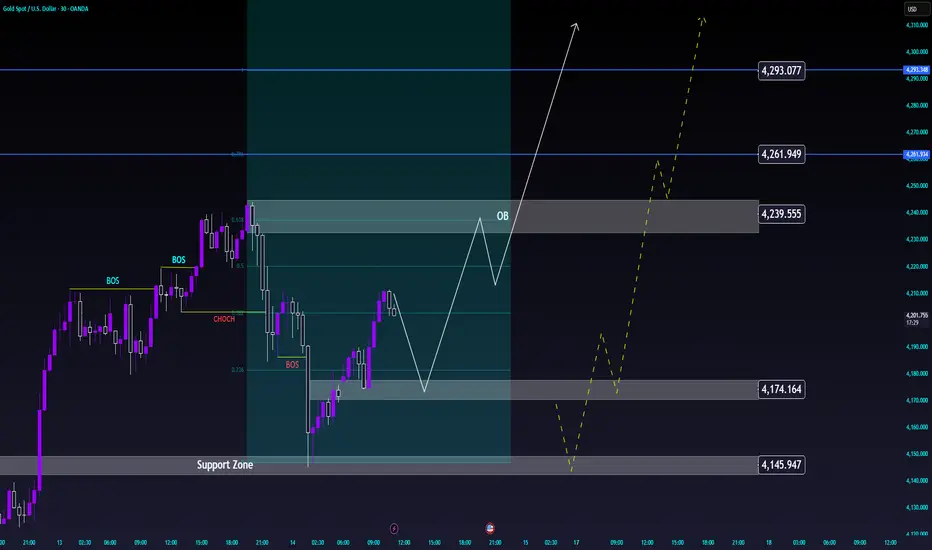
After establishing a short-term peak around 4,239 USD, gold is undergoing a technical retracement to rebalance its structure.
The most recent decline formed a Break of Structure (BOS), but the Support Zone around 4,145–4,174 USD continues to serve as a foundation for the medium-term uptrend.
The current price structure indicates the market is re-accumulating momentum before expanding again.
📊 Technical Structure
Order Block (4,239 USD): a short-term resistance zone where the price may react slightly before continuing upward.
Support Zone (4,145–4,174 USD): a confluence zone with Fibo 0.236–0.382, playing a balancing role in the current cycle.
Liquidity Targets:
• 4,261 USD – intermediate liquidity zone.
• 4,293 USD – main expansion target if the uptrend is maintained.
🎯 Market Outlook
High probability scenario:
1️⃣ The price may retrace to the Support Zone or form a higher low around 4,174 USD, then recover to the OB zone at 4,239 USD.
2️⃣ If the uptrend structure breaks, the market may test deeper towards 4,145 USD before bouncing back.
As long as the price holds above this support zone, the primary trend remains bullish continuation.
🧠 Analyst’s View
This is a phase of market re-accumulation after a rapid increase.
Maintaining a higher low structure will be a confirmation signal for the next expansion phase towards 4,261–4,293 USD.
Buyers are still controlling the cash flow, while sellers mainly participate in the short-term resistance zone.
🛡️ Risk Note
The market is in a slight correction phase – avoid impulsive actions when the price has not completed the accumulation zone.
XAU/USD – Price Accumulating in a Narrow Range, Ready to Expand⏰ Timeframe: 30m
📅 Update: 11/12/2025
🔍 Market Context
Gold maintains a neutral structure after forming a Change of Character (CHoCH) around the 4,144 USD area.
Yesterday's session witnessed a narrow fluctuation between the Demand Zone – Support Zone, indicating the market is absorbing liquidity before determining the next direction.
The medium-term upward momentum remains unbroken, but the price needs a clear balancing phase before continuation.
📊 Technical Structure
Demand Zone (4,144 USD): a short-term supply – demand area where the market previously reacted strongly, now becoming a potential testing zone.
Support Zone (4,099 USD): confluence structure – an area where buying flows may return when the price retests.
Order Block (4,081 USD): a deep defensive zone, corresponding to the main Discount area in the current cycle.
Equal Lows (EQL) & CHoCH: indicate a short-term transition between two sides, but the overall bias slightly leans towards an increase.
🎯 Market Outlook
High probability scenario for the day:
1️⃣ Price may fluctuate within the 4,099–4,144 USD balance zone to attract liquidity.
2️⃣ If a strong reaction occurs from the Support Zone or Order Block, gold may establish a new upward move towards 4,165–4,180 USD.
3️⃣ Conversely, if the price closes below 4,081 USD, the short-term structure will temporarily shift to neutral, prioritizing a re-accumulation phase.
🧠 Analyst’s View
Current price behavior reflects a “pause phase” in the larger upward structure.
When the market balances at lower levels, the key observation is not the bounce, but the reaction when liquidity is swept — where the true momentum of the trend is reignited.
As long as the price does not break the 4,081 USD mark, the medium-term upward trend remains intact.
🛡️ Risk Note
This is a technical analysis, not investment advice.
The market can change rapidly during US sessions – wait for clear confirmation from price action before participating.

XAU/USD – Gold Technical Adjustment Before Continuing Uptrend⏰ Timeframe: 30m
📅 Updated: 11/11/2025
🔍 Market Context
After a strong rally from the start of the Asian session, gold paused around 4,130–4,140 USD, indicating a temporary cooling off after a series of consecutive Break of Structure (BOS).
The current price is situated between a short-term resistance zone and a technical support (Order Block) – clearly reflecting a rebalancing behavior after a rapid expansion.
📊 Technical Structure
Resistance Zone (4,145 USD): a short-term reaction area, coinciding with a Weak High. If the price surpasses this, the uptrend structure will continue towards the Liquidity Zone around 4,198 USD.
Order Block (4,111 USD): a confluence area between 0.382–0.5 Fibonacci, likely to attract buying interest when the price adjusts.
OB Deep (4,081 USD): a deep support area, coinciding with the 0.618 Fibonacci level — where buyers might defend the main trend.
Liquidity Zone (4,198 USD): a potential expansion target if the uptrend structure is reconfirmed.
🎯 Market Outlook
High probability scenario:
1️⃣ Price technically adjusts to OB 4,111 or OB Deep 4,081, creating a reaction at the Discount area.
2️⃣ As buying momentum returns, the price may retest the Resistance Zone 4,145, then expand towards the Liquidity Zone 4,198 USD.
3️⃣ Breaking below 4,081 USD will weaken the short-term structure, shifting to a deeper rebalancing state.
🧠 Analyst’s View
This is a natural “cooldown” phase after a strong rally — the market is seeking liquidity before establishing the next upward move.
As long as the price holds above the 4,081 USD area, the main trend remains bullish.
Observing reactions at the OB will help determine if the upward momentum will continue to dominate in the US session.
🛡️ Risk Note
The market is adjusting within a larger trend — avoid emotional actions when the price has not completed the retracement phase.

Gold 30/09 - Safe-haven flows surge | Gold sails toward new ATH 🟡 XAU/USD – 30/09 | Captain Vincent ⚓
🔎 Captain’s Log – Context & News
US Politics : Meeting between Trump and bipartisan leaders ended without agreement → growing risk of a US government shutdown by Wednesday.
Conflict : Democrats demand concessions, Republicans fiercely oppose → wide gap remains, both sides blaming each other.
Market : Investors watch JOLTS data and speeches from 3 FED members, but political risks are the strongest catalyst for Gold.
Trend : Safe-haven flows keep pouring into Gold → increasing likelihood of testing new ATH.
⏩ Captain’s Summary : US political seas are stormy, Gold becomes the fortress of safety. The voyage toward ATH is widening.
📈 Captain’s Chart – Technical Analysis (H1)
EMA : EMA 34 (yellow) > EMA 89 (red) → bullish trend clearly dominant.
Golden Harbor (Support / Buy Zone)
Big Volume Dock: 3,827
Storm Breaker (Resistance / Sell Zone)
ATH test: 3,916 – 3,917
Market Structure : Gold broke out strongly, now trading around 3,870. Main trend remains bullish, with 3,842 – 3,827 as key anchor zones.
🎯 Captain’s Map – Trade Plan
✅ Buy (main priority)
Buy Zone 2 – Big Volume
Entry: 3,827 – 3,824
SL: 3,815
TP: 3,870 – 3,899 – 3,916
⚡ Sell (short scalp – high risk)
Sell Zone – ATH test
Entry: 3,917 – 3,920
SL: 3,925
TP: 3,899 – 3,870 – 3,856
⚓ Captain’s Note
“The Golden sails are filled by safe-haven winds, pushing the ship close to ATH. Golden Harbor 🏝️ (3,842 – 3,827) is the ideal dock for sailors to position Buys. Storm Breaker 🌊 (3,916 – 3,920) may unleash violent waves, suitable only for short Quick Boarding 🚤 scalps. If the political storm from Washington breaks out, Gold’s voyage could surpass the peak and expand its horizon.”
📢 If you find the Captain’s Log useful, don’t forget to Follow for the earliest updates.
💬 What’s your view, crew? Will Gold conquer ATH around 3,917 this week?

Gold awaits PCE | EMA squeeze, big waves ahead🟡 XAU/USD – 26/09 | Captain Vincent ⚓
🔎 Captain’s Log – Context & News
Trump : Announced a 100% tariff on branded drugs if not produced in the US → escalating trade tensions.
PCE tonight : The FED’s most important inflation gauge, key to shaping October rate cut expectations (current probability 91.09%).
The market is in “hold breath” mode, awaiting the PCE spark to decide the next direction.
⏩ Captain’s Summary : Gold is squeezed between two winds – short-term EMA pressure and major expectations from PCE.
📈 Captain’s Chart – Technical Analysis
EMA : EMA 34 (yellow) remains below EMA 89 (red) → short-term bearish pressure persists, but narrowing gap signals big volatility ahead.
Golden Harbor (Support / Buy Zone)
3,738 – 3,730
3,718
3,687
3,651
Storm Breaker (Resistance / Sell Zone)
3,755 – 3,773
🎯 Captain’s Map – Trade Plan
⚡ Sell (scalp at resistance)
Entry: 3,773 – 3,776
SL: 3,783
TP: 3,755 – 3,745 – 3,734
✅ Buy (trend-follow priority)
Buy Zone 1 (Scalping)
Entry: 3,72x – 3,718
SL: 3,710
TP: 3,750 – 3,769 – 3,776
Buy Zone 2 (Deeper OB)
Entry: 3,685 – 3,683
SL: 3,675
TP: 3,690 – 3,695 – 3,700 – 3,705 – 3,7xx
⚓ Captain’s Note
“The Golden sails are being squeezed between EMA 34 & 89. Golden Harbor 🏝️ (3,734 – 3,683) remains the safe dock for sailors to await the big wave. Storm Breaker 🌊 (3,773 – 3,776) is raising fierce waves, only suitable for short Quick Boarding 🚤 scalps. Tonight’s PCE will be the decisive wind – either pushing the ship beyond 3,78x or forcing it back to retest 3,72x.”
📢 If you find Captain’s Log useful, don’t forget to Follow for the latest updates.
💬 What do you think? Will Gold break through 3,78x or retest 3,72x first?

After a slight decrease, XAU suddenly turned aroundUS Federal Reserve (FED) Chairman Jerome Powell and expect US employment data to be released later this week for further signals on US interest rate cuts.
Yields on 10-year Treasury notes hit a one-month high and remained high, making non-yielding bullion less attractive.
The market remains very sensitive to any discussion about interest rates or anything related to FED policy. So I think the market is still in the wait-and-see phase."

GOLD 28/6 - Can the bulls hold the $1900 mark?The US Dollar experienced significant gains towards the end of last week as the Federal Reserve adjusted its perception of the interest rate trajectory.
The reaction of Treasury yields will play a crucial role in determining the outcome. If they surpass the inflation rates priced in by the market, real yields may increase slightly, potentially leading to a decline in gold prices.
Although there seems to be a double bottom pattern forming for gold at the H4 timeframe, confirmation of this pattern requires the market to break through the resistance level at $1932. Once this barrier is breached, the short-term target for gold would be $1950.
We will be monitoring the resistance level at the H4 EMA 34 for a potential selling opportunity.
SELL GOLD zone at: $1926 - $1928 - $ SL $1934 (It is best to carefully review the FOMC news before entering the order)
SELL GOLD zone at: $1942 - $1945 SL $1953
Based on technical analysis indicators EMA 34, EMA 89 with strong resistance zone $1940 - $1943
