Silver Analysis $Silver Price Prediction For Long-Term
Cup & Handel Pattern
BUYING ZONE- 25% - 32% Down from current price
Silvercharts

Breakout in Silver (Ag)...Chart is self explanatory. Levels of breakout, possible up-moves (where silver may find resistances) and support (close below which, setup will be invalidated) are clearly defined.
Disclaimer: This is for demonstration and educational purpose only. This is not buying or selling recommendations. I am not SEBI registered. Please consult your financial advisor before taking any trade.

Silver at a Critical Inflection Point [25% DOWNSIDE EXPECTED]Silver has delivered a powerful rally this year , but key Technical Milestones will now complete. in the 72-75 zone
🔹 Multiple Cup & Handle targets achieved on the log chart
🔹 ~300% Fibonacci extension of the post-COVID move reached
🔹 Decades-long $50 resistance broken — a major structural event
🔹 Using price symmetry, $75 now stands out as a heavy resistance zone
🔹Possible Retracement zone: 46 to 54
📉 With pattern completion and long-term resistance converging, risk-reward strongly favors caution at current levels.
Markets move in cycles — and Silver may be entering the next phase.
NOT SEBI REGISTERED. ⏐ ALL VIEWS ARE PERSONAL⏐ NOT AN INVESTMENT ADVICE

MCX Silver Mar-26 — Short Setup IdentifiedMCX:SILVER1!
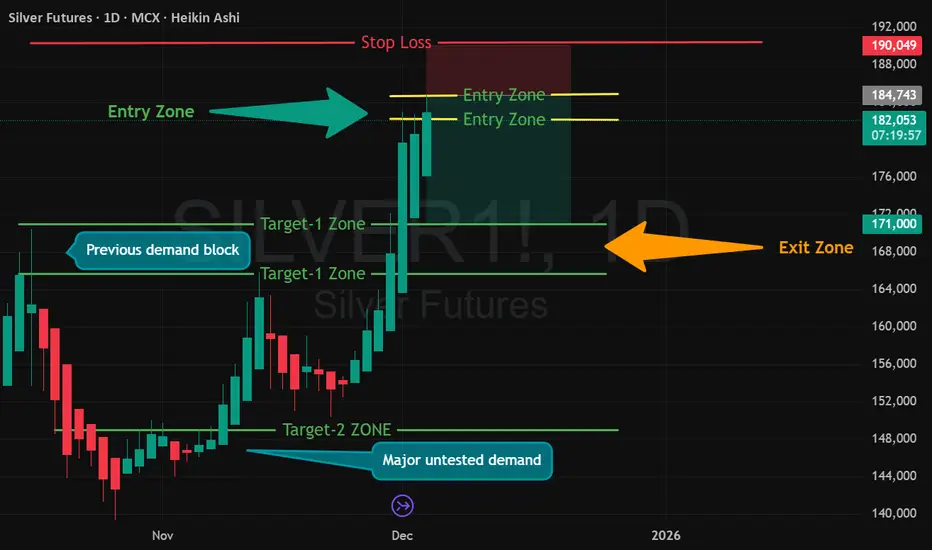
Silver Futures (MCX Mar-26) has formed 3 strong bullish candles with equal body size, which often signals momentum exhaustion. Price is now consolidating near resistance, creating a short-biased educational setup as per my analysis.
🔽 Short Setup (Educational Technical Analysis)
📌 Short Entry Zone:
₹185000 – ₹182000
🔴 Stop Loss:
₹190000
🎯 Target Zones (As per my analysis)
Target 1: ₹171000 – ₹165000
Target 2: ₹149000
Target-1 aligns with the current Exit Zone shown in chart.
Target-2 is for advanced traders with trailing SL to Cost-to-Cost.
📊 Why This Setup?
3 equal-sized bullish candles = possible buyer exhaustion
Price hitting resistance zone
Fresh consolidation indicating distribution
Strong mean-reversion probability
⚠️ SEBI Advisory Note
I am not a SEBI-registered investment advisor.
This analysis is only for educational learning, not buy/sell signals.
#Silver #MCXSilver #SilverFutures #MCX #CommodityTrading
#ShortSetup #PriceActionTrading #TechnicalAnalysis
#HeikinAshi #SupplyDemand #TrendReversal #BearishSetup
#TradingEducation #ChartAnalysis #MarketPsychology
#RiskManagement #AdijhonAnalysis
Silver Levels For October 2025Important support and Resistance Levels For Silver.
When Market touches the level, the price action plays important roles.
For More Learning Reach out to us.
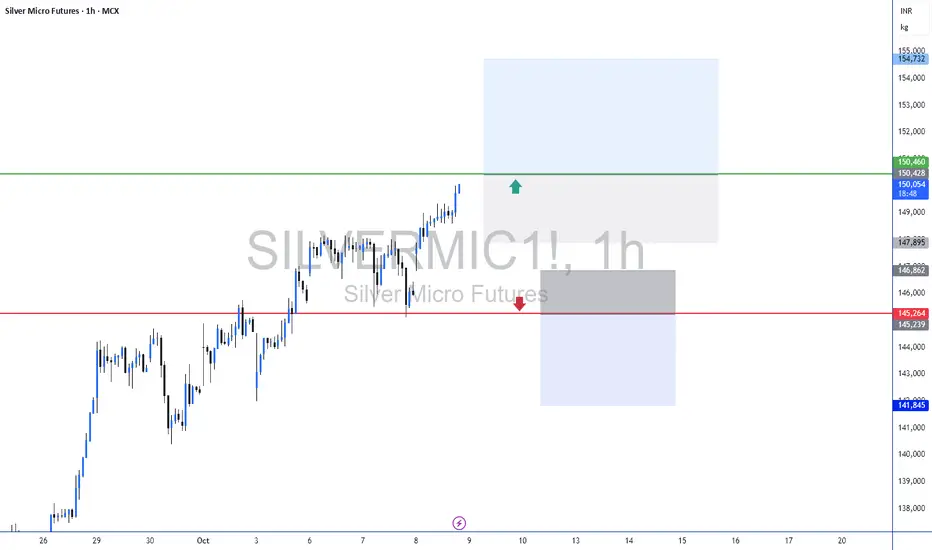
Silver Reversal In PlayLast trade delivered 12R.
Now positioned again in MCX:SILVERMIC1! .
Reversal signs clear, momentum building.
Risk defined, rules followed, no guessing.
Stops trail, trend decides.
Let’s see where this one runs.


SILVER (MONTHLY- BULLISH )Price has given a proper breakout and restet of zone of
27.9156-30.2570
and again given a breakout of 27.9156-30.2570
Point To Note
- EMA 21.50.200 Lined Up Bullish
- Breakout And Retest
Next Resistance
-41.8665--44.2079
Till Then, Keep Learning

XAG/USD 4H Weekly Analysis: Silver Aiming for $35.59?Key Observations:
📍 Current Price: $33.724 📉 (-0.07%)
🟢 Support Zones:
H4 Support: 📌 $33.000 🔵
Major Support: 📌 $31.000 🔵 (Highlighted with 🔥⚡ and news icons 📊📅)
🔴 Resistance Levels:
$34.000 Resistance 🛑
Target: 🎯 $35.591 📈
📈 Expected Price Movement:
✅ Bullish Scenario:
The price bounces off the support and pushes past $34.000 🚀
A move towards $35.59 target 📊💰
⚠️ Bearish Scenario:
If price fails to break $34.000, it may drop back to $33.000 or even $31.000 ⬇️🛑
Economic events (📅📉) may cause high volatility
🎯 Final Thought:
Likely bullish movement toward $35.59 if support holds 💹📈
Watch for price action at $34.000 – key level for breakout 🔍⚡

SILVER VIEW⚠️Education Purpose only!!!!
Key Support area:-87,100
Key Resistance area:-96,200
Silver has long been considered a 🏦 store of value and a 🛡️ hedge against inflation.
Riskier but suitable for speculation and hedging.
🔧 Industrial Demand – Used in ⚡ tech, ☀️ solar, 🚗 EVs
💰 Monetary Hedge – Safe-haven in 🔥 inflation & 📉 downturns
⛏️ Supply Constraints – Limited mining, rising demand 📊
📊 Growing Investment – ETFs & retail piling in 🚀
⏳ Long-Term View
If industrial demand and inflation persist, silver could see 📈 strong appreciation over the next decade.
🔍 Investors should monitor global economic trends, 📉 interest rates, and ⛏️ mining supply data to make informed decisions. 🚀
Price Action applied :-
⭕️50 Day Moving averages
⭕️Channel Pattern Formation
⭕️Range Breakout
⭕️Triangle Pattern Formation
⭕️Demand Zone
⭕️Major Resistance area
✅Check out my Trading View profile to see how we analyze charts and execute trades.
🙋♀️🙋♂️If you have any questions about this stock, feel free to reach out to me.
📍📌Thank you for exploring our idea! We hope you found it valuable.
🙏FLLOW for more !
👍LIKE if useful !
✍️COMMENT Below your view

Commodity Analysis: Silver – Potential Short-Term UpsideHello, Traders! 👋
Silver is shaping up for an interesting move:
📈 Technical Overview:
🔹 Higher low formed on the weekly chart, suggesting potential accumulation.
🔹 My ILTF indicator has already signaled a BUY, but the price remains sideways for now.
🔹 A breakout above 92,000 could trigger a short-term upmove toward the all-time high (ATH).
💡 Current Plan:
I’m not holding any position currently but closely watching for momentum on the daily chart. If a breakout occurs, I may consider initiating a pilot position to capture the move.
⚠️ Disclaimer:
🔹 I am not a SEBI-registered advisor.
🔹 This analysis reflects my personal views and is not a recommendation to buy or sell.
🔹 Shared purely for learning purposes—please conduct your own research or consult a professional before trading.
Keep an eye on Silver—things might get shiny soon! 💡

SILVER Breakout Confirmed........Silver broke weekly resistance and weekly close confirmed it.
Next target is 35$ and 37$. It may pullback from there before reaching 48-50$.
Trade as per risk management.
NOTE : ALreay silver view was given before at 27-28$ with target of 32$. This is an update actually. You can find previous chart idea below in link


XAGUSD/SILVER 4H BUY PROJECTION 06.09.24In this latest upward cycle of the silver market, Fed interest rate moves are playing an oversized role in pumping up silver prices. In early July, as analysts factored in the rising potential for interest rate cuts in the remainder of 2024, silver prices were once again testing May's nearly 12-year high.

SILVERHello & Welcome to this analysis
Silver has activated a Bullish Harmonic Gartley in daily time frame
MCX Silver due to budget day duty cut has seen the pattern gone invalid but appears likely to bounce back along with Comex Silver
Possible upside levels
Silver (Comex) 4hr close above $27.10 opens for $28.65 / $ 29.40 / $30.40, SL would be today's low (provided it goes and sustains above $27.10
Silver (MCX) 4hr close above INR 82750 opens for INR 85000 / INR 86500 / INR 88000, SL would be today's low (provided it goes and sustains above 82750)
Regards

SILVER is it positive?Above chart of SILVER is self explanatory....
heading towards pivot... need to see what happens
If it breaks both over head resistances, then 35$ is Target.

SILVER LONG IDEAPositives
SILVER chart in 4hr looks good for me.
It is near Trendline support and also Monthly breakout retest zone.
More chances it goes up as per chart and Target may be 30-32$.
Negitives
If it breaks down, next support is 26$.

SILVERSilver could test below support red line and from 28 it could bounce 📈 📈 to 31 within 20th June
Closing above 31 in Weekly is bullish 📈 📈 📈
Disclaimer:
It's a personal view not a financial advice and I assume no responsibility and liability whatever outcome arises.

SILVER 🚀 👨🚀 Support on 31.68 on 20th June will trigger price upwards to 43.35 within or on 20th Oct 2025 marked on the chart
31.68 ( 20th june 2024 )
43.35 ( 20th Oct 2025 )
Disclaimer:
It's a personal view not a financial advice and I assume no responsibility and liability whatever outcome arises.

SILVER LONG IDEASilver looks good.
Silver Brokeout of Monthly Trendline and Horizontal Resitance also.
I will take more silver expecting 35$ and 50$ as Targets if it closes monthly above 30$.
Lets see and plan accordingly.

Silver 📈 📈 If it sustains above 27.67 or that line ( Red ) then it could pump to the line ( green) or to the price 31.75 marked on the chart
31.75 --- ( 24th June 2024 expected time )
Disclaimer:
Its a personal view not a financial advise and I assume no responsibility and liability whatever outcome arises.


silver confused trade on levelsif silver sustain above 70k or 70050 level for today's close = 1d candle
then it will news based just liquid sweep from rd number of 70k
the price will rush towards the upper liquidity lvl of 71250 and 72750
as of trade on long side keep stop loss of 70k or below and target mentioned i.e. 71250 and 72750
