SILVER (XAGUSD) – Weekly Projection Analysis (24-01-26)
Overall Bias: 🔥 Strong Bullish
🔹 Market Structure
Price is clearly inside a bullish channel
Previous trendline break → clean retest
Retest aligns perfectly with 50% Fibonacci level
👉 This is a high-probability continuation zone
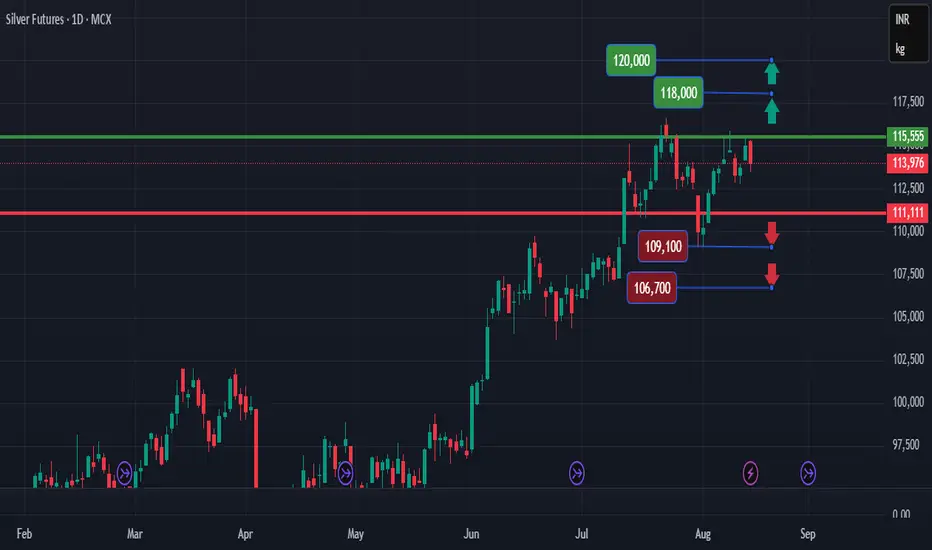
🔹 Key Levels
Support S2: ~96
Support S1: ~99–100
Entry Zone: Broken trendline + 50% Fibo (around 100)
Stop Loss: Below ~96 (structure protection)
Resistance R1: ~112–114
Target Zone: 115 – 120+ (New ATH zone) 🚀
🔹 Candle Strength
Strong bullish impulse candle confirms buyers’ dominance
No major rejection wick → momentum intact
🔹 Projection Logic
Trend continuation inside channel
Higher highs & higher lows
Retest confirmation + momentum breakout = buy-on-dips strategy
🧠 Trading Plan Summary
✅ Buy on retracement
✅ SL below structure
✅ Partial booking near R1
✅ Hold runner for ATH expansion
Silverforecast

Silver Price Technical Analysis & Forecast November 2025 Get the latest Silver technical analysis and price forecast for November 2025. Discover critical support and resistance levels, bullish and bearish scenarios, and market momentum. Find out if Silver (XAG/USD) will break higher or see a pullback, with expert insights on trend direction and potential price targets.

Silver Forecast - Elliott Wave AnalysisThis Rally continue possible up to Around $80 without break trendline support or Invalidation level so go long ...

Breakout in Silver (Ag)...Chart is self explanatory. Levels of breakout, possible up-moves (where silver may find resistances) and support (close below which, setup will be invalidated) are clearly defined.
Disclaimer: This is for demonstration and educational purpose only. This is not buying or selling recommendations. I am not SEBI registered. Please consult your financial advisor before taking any trade.

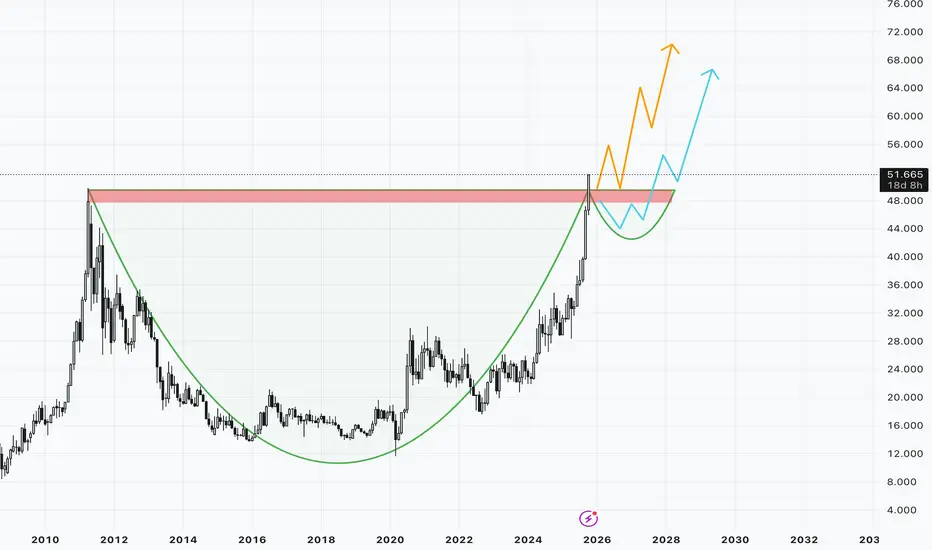
Silver at a Critical Inflection Point [25% DOWNSIDE EXPECTED]Silver has delivered a powerful rally this year , but key Technical Milestones will now complete. in the 72-75 zone
🔹 Multiple Cup & Handle targets achieved on the log chart
🔹 ~300% Fibonacci extension of the post-COVID move reached
🔹 Decades-long $50 resistance broken — a major structural event
🔹 Using price symmetry, $75 now stands out as a heavy resistance zone
🔹Possible Retracement zone: 46 to 54
📉 With pattern completion and long-term resistance converging, risk-reward strongly favors caution at current levels.
Markets move in cycles — and Silver may be entering the next phase.
NOT SEBI REGISTERED. ⏐ ALL VIEWS ARE PERSONAL⏐ NOT AN INVESTMENT ADVICE

Silver breakout above ATH. What to expect next?Chart Analysis:
Silver gave a breakout above its all time high and major psychological level of 50$. All the technicals are very strong in the short run.
Looking at the monthly chart it looks like C recovery and breakout above major resistance without the H formation making the C&H pattern incomplete.
13 trading days still left for the monthly close and for the breakout to become valid if closes above 50$.
What next? :
Curently looks like a clean breakout on charts. Wait for the monthly close above 50$ which will then make the breakout valid. If the breakout is valid we will wait for a retest near the zone for fresh longs. If it doesn't close the the C&H pattern can come into play. Expecting some cooldown in the prices in the coming weeks but closing is most imp. Wait and watch is current scenario.
Key Levels :
Major Support : 50$/46$ Clbs
Minor Support zones : 48.5-48.6$/47.5-47.6$
Long Run View :
Buy on dips is the best strategy to play out in Silver making entries on crucial levels. Expecting Silver to outperform Gold in the long run.
Disclaimer :
I am not SEBI registered. This analysis is for educational purposes only and not investment advice. Please do your own research before trading or investing.
MCX Silver Ready For Big Dhamaka - Neal Bhai ReportsMCX Silver Prices Ready For Big Dhamaka, What you think up or down? - Neal Bhai Reports

GOLD / SILVER SPREADSHello & welcome to this analysis
GOLD/SILVER (COMEX) ratio charts has done 1.62 Fibonacci of its Inverse Head & Shoulder breakout.
It has immediate parallel channel resistance near 109, if it breaks above it then next resistance is at 118 where it has a Bearish Harmonic Bat.
Current support is at 102, below that it could test the breakout level at 92

SILVER Breakout Confirmed........Silver broke weekly resistance and weekly close confirmed it.
Next target is 35$ and 37$. It may pullback from there before reaching 48-50$.
Trade as per risk management.
NOTE : ALreay silver view was given before at 27-28$ with target of 32$. This is an update actually. You can find previous chart idea below in link

XAGUSD/SILVER 4H BUY PROJECTION 06.09.24In this latest upward cycle of the silver market, Fed interest rate moves are playing an oversized role in pumping up silver prices. In early July, as analysts factored in the rising potential for interest rate cuts in the remainder of 2024, silver prices were once again testing May's nearly 12-year high.

SILVER is it positive?Above chart of SILVER is self explanatory....
heading towards pivot... need to see what happens
If it breaks both over head resistances, then 35$ is Target.

SILVER LONG IDEAPositives
SILVER chart in 4hr looks good for me.
It is near Trendline support and also Monthly breakout retest zone.
More chances it goes up as per chart and Target may be 30-32$.
Negitives
If it breaks down, next support is 26$.

SILVERSilver could test below support red line and from 28 it could bounce 📈 📈 to 31 within 20th June
Closing above 31 in Weekly is bullish 📈 📈 📈
Disclaimer:
It's a personal view not a financial advice and I assume no responsibility and liability whatever outcome arises.

SILVER 🚀 👨🚀 Support on 31.68 on 20th June will trigger price upwards to 43.35 within or on 20th Oct 2025 marked on the chart
31.68 ( 20th june 2024 )
43.35 ( 20th Oct 2025 )
Disclaimer:
It's a personal view not a financial advice and I assume no responsibility and liability whatever outcome arises.

Silver 📈 📈 If it sustains above 27.67 or that line ( Red ) then it could pump to the line ( green) or to the price 31.75 marked on the chart
31.75 --- ( 24th June 2024 expected time )
Disclaimer:
Its a personal view not a financial advise and I assume no responsibility and liability whatever outcome arises.

Silver sell on risejust like gold silver gap up on 20th march the price is fading its buying momentum and with that bias im looking for sell on rise setup
which i think 75300 could be the short entry and sl will be 75500 with the target of 74300 and second target of 73600
conclusion the target area are possible area to boost the buying liquidity again there will be exiting the trade

silver confused trade on levelsif silver sustain above 70k or 70050 level for today's close = 1d candle
then it will news based just liquid sweep from rd number of 70k
the price will rush towards the upper liquidity lvl of 71250 and 72750
as of trade on long side keep stop loss of 70k or below and target mentioned i.e. 71250 and 72750

Silver expected to fall by 5-7% - #2after the gap up of 29nov
there is price imbalance and buyer's liquidity is laying down under @ 68000 to 66000 zone
simple if you the candle from december month youll see reds are more dominat then green and green pullbacks came from previous value zone that were not tested are acting as order block triggering the buy order of buyers
BUT.....
there are two more level that need to consider is 68-66000 where we can see good buying as of now while recording this analysis
waiting for buy opportunity instead of going short

SILVER TREND NOWTREND - POSITIVE
But unable to break above weekly downward trend line.
PRESENT ZONE- At SUPPLY ZONE 3.Encountering yearly supply zone.
New 1 hour zone formed.
FORECAST -As per ZONE SUPPLY ZONE 3
If breaks above SUPPLY ZONE 3 will go to 25$.
if breaks below SUPPLY ZONE 3 will target below 1 hour demand zone/weekly zone.
MY TAKE
As lots of supply zones are there requires strong momentum/news.
Probably may go down.
IF FOUND USEFUL KINDLY CLICK BOOST ICON & follow me for more updates and trends

silver value buying levels the 3rd oct uptrend is more likely a pullback from the previous downtrend that we had analysed and played well
currently the price has reached to the fib golden zone of 0.6 and 0.7 and there is another confluence of previous rejection zone
price started making lower high and lower low
68000 - 67000 will be area of order blocks
lets wait for the price to react on this

silver update and long setupsilver has reached the fib zone and our golden zone looking price need to make a pullback and we have two fair value zone 69000 and 68300
go long based on higher high and higher low formation

silver could fall 3-4% ?? The Gap up of 30th aug was not Bullish case in the price
gap just grabed all the pending liqduidity from old order block (from 20 and 27 july)
due to gap up price face hard selling liquidity and buyer liquidity made a stretch of (15 or more than !%) which created the imbalance
with all this conditions it is clear that price will be dropping lower to find more buyer liqudity
the red arrow highlighting the buyer liqudity lvls
for long entry only from 70600 - 70400 & main point of interest will be 70,000 - 69350
