Gold in Decision Zone – GAP Reaction Defines Next MoveMarket Context (Fundamentals → Flow)
Recent sessions continue to be driven by elevated geopolitical and macro uncertainty. Risk sentiment remains fragile as markets reassess global political tensions and their implications for trade, energy routes, and monetary stability.
As a result:
USD remains under pressure, lacking strong follow-through buying.
Equities show signs of fatigue near highs.
Gold continues to attract defensive flows, keeping the broader bullish structure intact.
This environment supports trend continuation, but not without technical pullbacks.
Technical Structure (H1–H4)
Gold is trading within a well-defined ascending channel.
Multiple BOS (Break of Structure) confirm the bullish trend.
The recent impulsive leg created a bullish GAP / imbalance.
Price is now reacting near the mid-channel decision zone, where continuation vs. deeper retrace is decided.
➡️ Trend is bullish, but location matters.
Key Levels to Watch
Current resistance: 5,080 – 5,100
GAP / reaction zone: 5,020 – 5,000
Major demand (FVG): 4,960 – 4,940
Invalidation: H1 close below 4,940
Scenarios (If – Then)
Scenario 1 – GAP Holds (Primary Bias)
If price holds above 5,000
Buyers defend the imbalance
→ Continuation toward 5,120 – 5,180 within the channel.
Scenario 2 – Deeper Pullback (Healthy Correction)
If price loses 5,000
Expect a retrace into 4,960 – 4,940 FVG.
Bullish reaction here keeps the higher-timeframe trend intact.
Only a clean break and acceptance below 4,940 would weaken the bullish structure.
Summary
Gold is not topping — it is pausing at a decision zone. In a risk-sensitive environment, pullbacks are opportunities, not threats.
Smartmoneyconcepts

Overtrading Gold – Biggest Account KillerOvertrading Gold – Biggest Account Killer
🧠 What Overtrading REALLY Means in Gold
Overtrading is not just trading too often — it’s trading without edge, patience, or contextual alignment.
In XAUUSD, overtrading usually looks like:
Multiple entries in the same range
Chasing price after impulsive candles
Trading every wick, every breakout, every news spike
📌 Gold gives the illusion of opportunity every minute — but institutions trade very selectively.
🧨 Why Gold Is the Perfect Trap for Overtraders
Gold is engineered (by behavior, not conspiracy) to punish impatience 👇
🔥 Extreme volatility
🔥 Fast candles & long wicks
🔥 Sudden reversals
🔥 News-driven manipulation
🔥 Liquidity sweeps above & below range
💣 Result?
Retail traders feel forced to trade — and end up trading against structure and liquidity.
🧩 The Overtrading Cycle (Account Destruction Loop)
Most gold traders repeat this cycle unknowingly ⛓️
1️⃣ Enter early (no confirmation)
2️⃣ Stop-loss hit by wick
3️⃣ Re-enter immediately (revenge)
4️⃣ Increase lot size
5️⃣ Ignore bias & HTF context
6️⃣ Emotional exhaustion
7️⃣ Big loss → account damage
📉 This cycle has nothing to do with strategy — it’s pure psychology.
🧠 Why Strategy Stops Working When You Overtrade
Even a 60–70% win-rate strategy will fail if:
❌ Trades are taken outside optimal time
❌ Entries ignore higher-timeframe direction
❌ Risk increases after losses
❌ Rules are bent “just this once”
📌 Gold exposes discipline weakness faster than any other market.
⏰ Time Is the Hidden Edge in Gold
Gold does NOT move efficiently all day ⏱️
🟡 Asian Session → Range & traps
🟡 London Open → Liquidity grab
🟢 New York Session → Real direction
Overtraders:
❌ Trade Asian noise
❌ Enter mid-range
❌ Chase NY expansion late
Smart traders:
✅ Wait for liquidity first
✅ Trade after manipulation
✅ Enter once direction is clear
📉 Statistical Damage of Overtrading
Let’s talk numbers 📊
🔻 More trades = more spread & commission
🔻 Lower average R:R
🔻 Lower win probability
🔻 Higher emotional stress
🔻 Faster drawdowns
💡 One A-grade setup can outperform 10 random gold trades.
🧠 Psychology: The Real Root Cause
Overtrading is driven by internal pressure 👇
😨 Fear of missing out
😡 Anger after stop-loss
😄 Overconfidence after win
😴 Boredom during ranges
Gold feeds emotions — and then punishes them.
📌 Institutions wait. Retail reacts.
🛑 How Professionals Control Overtrading
Real solutions — not motivational quotes 👇
✅ Maximum 1–2 trades per session
✅ Trade only at predefined time windows
✅ Fixed risk per trade (no exceptions)
✅ Daily stop after 2 losses max
✅ Journal every impulsive entry
📘 If it’s not planned before price moves, it’s emotional.
🏆 Golden Rule of XAUUSD
💎 Gold is not hard because it’s random
💀 Gold is hard because it exposes impatience
You don’t need more trades.
You need more discipline.
📌 Final Truth
Most XAUUSD accounts don’t blow because of:
❌ Bad indicators
❌ Bad analysis
❌ Bad strategy
They blow because of overtrading driven by emotion.
📉 Overtrading is the biggest account killer in gold trading.

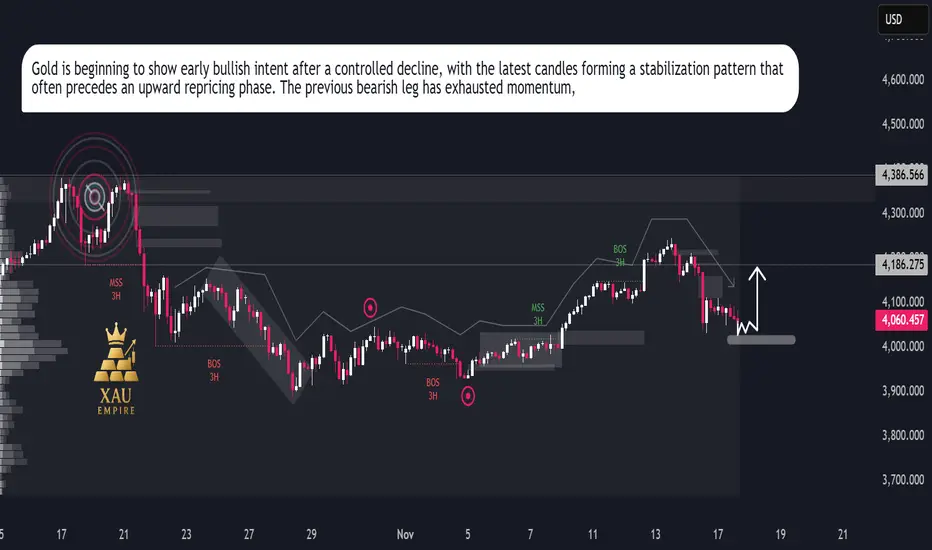
XAUUSD Repricing MoveXAUUSD Repricing Move
Gold continues to trade inside a broader corrective cycle, with price action showing a clear transition from prior strength into a short-term distribution phase. The chart highlights repeated breaks in market structure and shifts in order flow, signalling a controlled decline built on institutional rebalancing.
After the recent downside sweep, price is now hovering around a key reaction zone where liquidity has already been absorbed. Sellers dominated the previous swing, but the latest candles show a slowdown in bearish momentum, indicating that the market may be preparing for a corrective repricing attempt.
The volume footprint on the left side of the chart reflects previous heavy activity from major participants, and the current area sits beneath an inefficiency pocket that remains unmitigated. This opens the door for a short-term bullish rotation if buyers defend this accumulation region. The marked arrow in your chart aligns with a potential internal shift where gold could attempt a short retracement toward the mid-range of the prior move.
Momentum indicators embedded in the structure show reduced volatility, meaning the market may be positioning itself for a liquidity-driven bounce rather than continuing straight lower. The next sessions will reveal whether this zone becomes a launch point for a recovery leg or if the broader trend resumes its downward trajectory.
EURUSD – Bullish Setup Toward 1.16EURUSD – Bullish Setup Toward 1.17
EURUSD is showing strong signs of a bullish reversal after an extended period of downside movement. The 3H chart highlights several Market Structure Shifts (MSS) and Breaks of Structure (BOS) suggesting that bearish momentum is fading and buyers are regaining control near the 1.1500 demand zone.
The price is forming a solid accumulation base, indicating that smart money may be positioning for a move higher. A clean break above the 1.1680–1.1730 resistance area could confirm a trend reversal, opening the way for a sustained bullish rally toward the mid-1.18 region.
With momentum strengthening and structure turning positive, EURUSD looks poised for a potential breakout continuation in the days ahead.
📈 Key Insights:
Structure: Bullish reversal forming on 3H timeframe
Support zone: 1.1500 – strong accumulation base
Upside targets: 1.1680 → 1.1730 → 1.1800
Outlook: Buyers regaining control; bullish continuation likely

XAU Empire | Bullish FlowXAU Empire | Bullish Flow
The market maintains a bullish structure after confirming a break of structure (BOS). Price is currently retracing into a short-term demand zone near 4,100, showing healthy correction within trend. This zone is acting as accumulation before potential continuation.
Momentum supports a move toward 4,316 – 4,386, aligning with unfilled imbalance and previous supply area. Institutional flow remains on the buy side as long as price holds above 4,080.
---
Market Bias: Bullish
Short-Term Range: 4,100 – 4,386
Key Focus: Retracement for continuation

Gold – Distribution Before DropGold – Distribution Before Drop
Gold is showing signs of exhaustion after the recent corrective bounce. The 3H market structure highlights a clear distribution pattern, as price continues to reject from the 4,100–4,250 supply zone. Repeated Break of Structure (BOS) signals that bearish momentum remains dominant.
Institutional activity suggests that liquidity is being built above local highs, preparing for another downside leg. The current market sentiment stays bearish as long as price trades below the key premium area. A confirmed rejection from this zone could trigger a decline toward the 3,904 liquidity pool.
Only a breakout and hold above 4,250 would invalidate this scenario and shift bias back to bullish accumulation.

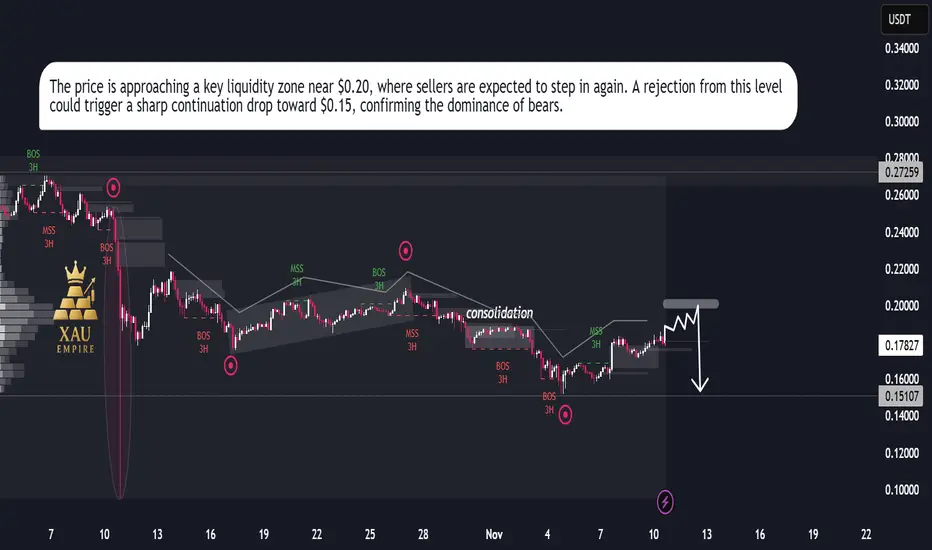
DOGEUSDT – Bearish Setup Toward $0.15DOGEUSDT – Bearish Setup Toward $0.15 📉
Dogecoin remains under strong bearish pressure, following multiple Breaks of Structure (BOS) and Market Structure Shifts (MSS) on the 3H timeframe. After a brief consolidation phase, price continues to respect the descending trend, indicating a lack of bullish strength.
Currently, DOGEUSDT is attempting a minor upward correction, likely to retest the $0.20 supply zone — a region that could act as a liquidity grab before the next major downside move. If price fails to hold above that zone, the market may trigger a sharp drop toward the $0.15 level, confirming continuation of the broader bearish trend.
Momentum remains weak, and sellers continue to dominate short-term rallies — suggesting further downside pressure in the coming sessions.
GOLD LIKELY TO RETRACE INTO DEMAND BEFORE EXTENDING HIGHER📅 November 10, 2025 | XAUUSD Daily Trading Plan 💰
🧭 Market Structure Overview
Gold continues to trade within a bullish structure, confirmed by multiple Breaks of Structure (BOS) and a Change of Character (CHoCH) on the 30M timeframe.
The market recently printed a Weak High at 4070, indicating that liquidity remains above and buyers are still in control.
After a strong impulsive leg to the upside, price is expected to retrace into the nearest demand zones before resuming the bullish leg. The unmitigated order blocks around 4001–3999 and 3969–3967 present high-probability re-entry areas.
📊 Technical Breakdown
Structure: Bullish
Liquidity: Equal highs at 4070 likely to be swept before deeper retracement.
Zones of Interest:
Demand #1 → 4001–3999
Demand #2 → 3969–3967
Fair Value Gap: Between 4005–3990 offers potential rebalancing area.
🎯 Trading Plan (LONG Bias)
Entry Zone 1: 4001 – 3999
Entry Zone 2: 3969 – 3967
Take Profit (TP): 4078
Stop Loss (SL): 3994 (6$ risk)
Bias: ✅ LONG
🧩 Rationale
The recent bullish impulse following the CHoCH confirms a structural shift to the upside.
With liquidity resting above the Weak High, we anticipate a short-term retracement to fill imbalance and tap into discount demand zones.
From these zones, bullish continuation towards 4078 remains the most probable scenario — unless price breaks below 3965, which would invalidate the setup.
📌 Summary
Price remains bullish with strong momentum.
Wait for retracement into the identified demand zones for a high-probability long continuation setup.

GOLD SHOWS WEAKNESS – SELL THE RALLY TOWARD DEMAND!📅 WEEKLY PLAN – November 8, 2025
🚀 HOOK TITLE:
🔥 GOLD SHOWS WEAKNESS – SELL THE RALLY TOWARD DEMAND! 🔥
📊 Market Analysis:
Gold continues to respect a bearish market structure, showing clear Break of Structure (BOS) and Change of Character (CHoCH) patterns on the 2H chart.
After multiple rejections from the upper zones, price is likely forming a lower high before heading to retest the demand below.
The market is currently consolidating between 4020–3980, suggesting a potential liquidity grab before the next impulsive drop.
🎯 Trade Plan:
🔹 Setup 1 – Sell Zone (4037–4039)
Entry: 4037–4039
SL: 4043
TP1: 4018
TP2: 3976
TP3: 3931
🔹 Setup 2 – Sell Zone (4018–4020)
Entry: 4018–4020
SL: 4024
TP1: 3976
TP2: 3931
TP3: 3929
🔹 Setup 3 – Buy Reaction Zone (optional scalp)
Entry: 3931–3929
SL: 3923
TP1: 3974
TP2: 4018
(Only consider if strong bullish rejection or FVG fill appears)
📈 Outlook:
Bias remains bearish unless price breaks and closes above 4043 (invalidating lower-high structure).
Smart traders should sell into strength, waiting for confirmation wicks or bearish engulfing on lower timeframes (M15–M30) inside the marked zones.
📌 Weekly Bias: 🟥 SHORT / SELL MODE
Targeting the imbalance fill toward 3930 area.

GOLD IS SETTING UP FOR ANOTHER BULLISH RUN — BUY THE DIP BEFORE November 7, 2025 — GOLD Daily Trading Plan 💰
🎯 Bias: LONG Setup (Buy the Dip)
Gold continues to show bullish market structure after multiple BOS (Break of Structure) confirmations on both intraday and H1 charts.
Price has reacted from the previous demand area 3969–3977, leaving a clean FVG below, suggesting unfilled imbalance and potential liquidity resting underneath.
At the moment, XAUUSD is hovering near 4007, approaching a minor supply zone at 4018–4020. I expect price to potentially sweep liquidity above 4018, then retrace back toward 3975–3969 to form a higher low before continuing its bullish leg.
Key confluences supporting the long bias:
✅ Multiple BOS and CHoCH shifts confirm bullish intent.
✅ FVG + Volume Gap below aligns with a discount zone for entries.
✅ Structural higher low formation still intact as long as price holds above 3965.
📌 Trade Plan:
🟩 Buy Zone: 3977 – 3969
⛔ Stop Loss: 3963 (max 6 points)
🎯 Take Profit 1: 4005
🎯 Take Profit 2: 4018
If price decisively breaks above 4020, expect continuation toward 4035–4040, but intraday traders should secure profits around the 4018 zone.
In case of a deeper retracement, watch for liquidity grabs near 3965–3950 FVG before another bullish push.

GOLD RANGE PLAY — CLEAN SUPPLY & DEMAND REACTIONS AHEAD🧭 DAILY TRADING PLAN — GOLD (XAU/USD)
Date: Nov 3, 2025
Main Timeframe: M30 – H1
Strategy: SMC + Trendline Structure + Supply/Demand Zones
🌐 MARKET CONTEXT
Gold continues to consolidate inside a symmetrical triangle, forming clear supply and demand zones within a tightening range.
Current structure shows a bearish bias below 4039 but still holding a bullish base above 3970–3980.
Both buyers and sellers have clear liquidity zones to play from — ideal for short-term reactions and fade setups.
📈 TECHNICAL OUTLOOK
🔹 BUY SCENARIO 1 (Main Setup)
BUY 3980 – 3978
→ SL: 3973 (6 pips)
→ TP1: 4010 | TP2: 4038
Structure support + local BOS. Wait for bullish rejection or engulfing confirmation.
R:R ≈ 5–9 depending on TP target.
🔹 BUY SCENARIO 2 (Aggressive Entry)
BUY 3970 – 3968
→ SL: 3963
→ TP1: 4000 | TP2: 4038
Deep retest into lower trendline + demand imbalance zone.
Only valid if market respects structure and holds above 3960.
🔸 SELL SCENARIO 1
SELL 4027 – 4029
→ SL: 4034
→ TP1: 4000 | TP2: 3970
Short from supply zone with bearish CHoCH confirmation on lower timeframe.
Rejection at this level can target liquidity below 3980.
🔸 SELL SCENARIO 2 (Higher Supply)
SELL 4037 – 4039
→ SL: 4044
→ TP1: 4010 | TP2: 3970
This is the weak high area — potential sweep zone before reversal.
Look for liquidity grab + bearish candle confirmation before entry.
🧩 STRUCTURE RECAP
Bias: Range-bound → Bearish within triangle
BOS / CHoCH: Confirmed on M30 around 4029 zone
Weak High: 4039
Strong Support: 3970–3980
Major Resistance: 4045–4128
⚙️ TRADE MANAGEMENT
Risk per setup ≤ 1–2%
Move SL → BE after TP1
Avoid entries during high-impact news
Wait for confirmation (no blind limits)
🧠 SUMMARY
Gold is ranging within a compressed structure, where shorts from supply and buys from demand both align with liquidity targets.
The cleanest play remains:
→ Buy near 3978 / Sell near 4038, trade between zones until a breakout occurs.
If price breaks and holds above 4045, expect bullish continuation to 4128.
If breaks below 3960, bearish expansion likely resumes toward 3920.

XAU/USD – SELL SETUP AT 3999–4001 | REJECTION FROM DOWNTREND ZON🪙 XAU/USD — SELL SETUP AT 3999–4001 | REJECTION FROM DOWNTREND ZONE
📊 Market Context:
Gold is still respecting the descending trendline structure, showing multiple rejections at the resistance zone near 4000–4005. The recent rally seems corrective within a broader bearish framework. Liquidity has been swept above previous highs, followed by a clear CHoCH back to bearish order flow.
📉 Technical Breakdown:
Structure: BOS confirmed on H1, CHoCH on M30 aligns with bearish continuation.
Key Levels:
Sell Zone: 3999–4001 (previous supply + trendline retest)
Buy Zone: 3939–3937 (retest of demand + equal lows area)
Momentum: RSI is failing to sustain above 50 and showing lower highs — confirming potential weakness.
Bias: Bearish until price closes decisively above 4005.
🎯 Trade Idea:
Entry: SELL 3999–4001
Stop Loss: 4007 (≈6 pts above entry)
Take Profit:
TP1: 3950
TP2: 3939
TP3: 3910 (extended target if momentum continues)
📈 Alternative Plan (if pullback deepens):
If price reclaims 4005, wait for liquidity sweep above 4010 and look for bearish confirmation again — otherwise, invalidation of the short bias.
🧠 Summary:
Gold remains capped under major resistance. Short positions around 4000 align with both multi-timeframe structure and momentum divergence. Bulls need a strong breakout above 4005 to shift bias back to bullish.

EUR/JPY Sell Momentum BuildsEUR/JPY has officially transitioned into a sell-side trend following clear exhaustion of its previous bullish cycle. The market structure shows consecutive lower highs and strong downside displacement, confirming that sellers are now in control of short-term momentum.
Recent liquidity sweeps above prior highs were quickly rejected, signaling institutional distribution and profit-taking. Order flow dynamics continue to favor the downside, with bearish impulses showing higher efficiency than any corrective rebounds.
Momentum and sentiment both align with sustained selling pressure. The pair is operating within a redistribution phase, and the market tone remains defensive as participants seek lower value zones.
Overall outlook: Bearish bias remains dominant. The market is expected to extend lower while maintaining controlled volatility until meaningful demand re-enters the market.

GOLD PULLBACK BEFORE FINAL LEG DOWN🧭 DAILY TRADING PLAN – GOLD (XAU/USD)
📅 Date: Nov 04, 2025
📊 Main timeframe: H2 confirmation + M30 execution
🎯 Strategy: SMC + Liquidity Grab + OB Rejection
MARKET CONTEXT
Gold is currently trading around the 3970 zone after a clear Break of Structure (BOS) on the M30 timeframe, confirming short-term bearish pressure. On the H2 chart, price remains in a descending channel, forming lower highs since 4128 → 4006, aligning with overall bearish sentiment.
Recent CHoCH signals on M30 indicate that buyers tried to defend the 3980–3970 area twice but failed to sustain momentum. Liquidity was swept below minor lows, suggesting a potential continuation toward deeper liquidity pools near 3960–3955.
KEY LEVELS
SELL ZONE 1: 4025–4027
SELL ZONE 2: 4011–4013
BUY ZONE 1: 3980–3978
BUY ZONE 2: 3970–3968
TRADING IDEA
Current bias: Bearish, expecting a pullback before continuation.
If price retraces to 4011–4027, watch for rejection and BOS on M5/M15 to enter short.
TP1: 3978, TP2: 3960
SL: above 4027 (≈6 points)
Alternatively, if price sweeps liquidity below 3968 and shows strong CHoCH upward, consider scalp long back to 3980–3990, with SL below 3962 (≈6 points).
CONFIRMATION
M30: BOS down confirmed after CHoCH
H2: Resistance zone rejection aligning with trendline + EMA confluence
RSI showing mild bearish momentum, not yet oversold → room for downside continuation
OUTLOOK
As long as price remains below 4027, the bearish structure holds. Watch for liquidity grabs at support zone 3960–3970 before a potential short-term retracement. A clean break above 4030 would invalidate this plan and flip bias to neutral.
📌 Plan Summary
🎯 Sell the pullback at 4011–4027
🎯 TP: 3978 / 3960
🛑 SL: 4027 (6 points)

GOLD TRAPPED BETWEEN LIQUIDITY ZONES – WAITING FOR SMART MONEY M🧭 DAILY TRADING PLAN – GOLD (XAU/USD)
Date: Oct 31, 2025
Main timeframe: M30 – H1
Strategy: SMC + Liquidity Grab + BOS/CHOCH Confirmation
🎯 Hook:
Gold is currently ranging between two key liquidity zones after a bullish BOS. Will price hunt the weak high or sweep the buy-side liquidity before the next leg?
🌐 MARKET CONTEXT
After a strong recovery from 3960 → 4040, price created a weak high with no significant displacement. The recent rejection from 4037–4039 suggests short-term supply pressure, but overall market structure remains bullish with multiple BOS confirmations.
Current structure shows a liquidity grab → retracement phase before continuation.
📈 TRADING PLAN
Scenario 1 – BUY setup (preferable)
Entry zone: 3996 – 3994
Confirmation: Bullish reaction / CHoCH on lower timeframe (M5–M15)
TP1: 4030
TP2: 4038 (liquidity above weak high)
SL: 3988 (≈ 6$ risk range)
Bias: Continuation bullish leg after mitigation
Alternative BUY zone (deep retracement):
Entry: 3960 – 3958
TP: 4030
SL: 3952
Use only if price sweeps lower liquidity.
Scenario 2 – SELL setup (counter-trade)
Entry zone: 4037 – 4039
Confirmation: M15 bearish CHoCH / rejection candle
TP1: 4010
TP2: 3995
SL: 4045 (≈ 6$ risk range)
Bias: Short-term sell before retest demand
🧩 SUMMARY
Market still shows bullish structure, so buy setups at demand zones are higher probability.
Sell setups should be quick scalps around the weak high, targeting intraday retracement.

GOLD RETESTING SUPPLY BEFORE NEXT LEG DOWN🧭 DAILY TRADING PLAN – GOLD (XAU/USD)
Date: Oct 28, 2025
Main timeframe: M30 – H1
Strategy: SMC + Market Structure + Supply Zone
1. MARKET CONTEXT
Gold continues its bearish momentum after multiple CHoCH and BOS confirmations on lower timeframes.
Price is currently trading around 3935, after rejecting from several supply zones (4045–4047, 4011–4013, and 3975–3977).
Higher timeframe structure (H1–H4) remains bearish, with resistance forming between 4010–4050 and potential liquidity resting below 3928.
2. INTRADAY BIAS
Bias: Bearish
Expectation: Short retracement into supply → continuation down to support zone.
3. TRADING SETUP
Sell Zone #1: 3975 – 3977
Sell Confirmation: Price forms bearish CHoCH on M15–M30 near supply zone.
Entry: 3976
Stop Loss: 3982 (6 USD range)
Take Profit 1: 3940
Take Profit 2: 3928
R:R ≈ 1:4 — targeting liquidity below the previous swing low.
Avoid buying until clear BOS above 4013 is confirmed.
4. NOTES
If price closes above 4013, invalidates short bias and shifts to neutral — wait for fresh structure before entering again.
Monitor volume + reaction near Support Zone (3928–3940) for potential profit-taking.

GOLD RETRACEMENT BEFORE NEXT LEG DOWN GOLD RETRACEMENT BEFORE NEXT LEG DOWN
Body: 🧭 DAILY TRADING PLAN – GOLD (XAU/USD)
Date: Oct 27, 2025
Main timeframe: M30 – H1
Strategy: SMC + Fibo Zone Reaction + OB/Trendline Confluence
1️⃣ MARKET CONTEXT
Price is consolidating after a sharp drop from 4186 → 4058.
Currently, price is trading inside a support trendline + OB BUY ZONE (4058 - 4061), showing signs of demand reaction.
Above, multiple supply zones are stacked (4093 - 4095 / 4114 - 4116 / 4135 - 4137), creating strong short-term resistance layers.
Structure remains bearish, but a corrective leg toward premium zones is likely before any continuation down.
2️⃣ BIAS
Short-term bullish retracement, then sell continuation from premium supply zones.
3️⃣ SCENARIO 1 — BUY SETUP (Short-term retracement)
Entry: 4061 – 4059
SL: 4055
TP1: 4093
TP2: 4114
RR: ≈ 1:4
Note: Only buy if price forms bullish BOS / engulf on M15 from this OB zone (confluence with Fibo 0.786).
4️⃣ SCENARIO 2 — SELL SETUP (Main setup)
Option 1:
Entry: 4093 – 4095
SL: 4100
TP1: 4061
TP2: 4002
RR: ≈ 1:5
Option 2:
Entry: 4114 – 4116
SL: 4120
TP1: 4061
TP2: 4002
RR: ≈ 1:5
If price reaches 4135 – 4137, this is an extreme premium zone (reactive Fibo + previous double top). Expect strong reaction and liquidity sweep before a larger sell-off.
5️⃣ KEY LEVELS
OB BUY ZONE: 4058 – 4061
SELL ZONE 1: 4093 – 4095
SELL ZONE 2: 4114 – 4116
SELL ZONE 3: 4135 – 4137
Liquidity Target: 4002 – 3930
6️⃣ SUMMARY
Wait for reaction at 4058 zone for short-term buy retracement.
Main idea: Sell from premium → Target liquidity below 4000.

The Market Doesn’t Hate You — It’s Just Doing Its JobEvery trader at some point feels attacked by the market.
You take a trade, it hits your stop loss by one pip… and then runs perfectly in your direction.
You think, “The market is against me.”
But the truth is — the market doesn’t hate you.
It’s simply doing its job: collecting liquidity before moving to its real destination.
💡 Here’s What’s Really Happening
The market is a liquidity machine.
It moves where money is resting — not where traders wish it would go.
When you see price sweeping highs or lows before reversing, that’s not manipulation against you —
it’s Smart Money doing what it’s built to do:
Hunt liquidity
Fill institutional orders
Create displacement before the next move
Your stop loss isn’t being targeted personally —
it’s sitting where millions of other traders’ stops are clustered.
The market simply clears those levels before delivering the real move.
🧠 The Lesson
Stop trading emotionally and start thinking structurally.
Ask yourself before every setup:
Where is liquidity resting?
Has the market collected it yet?
Is structure confirming the new direction?
When you learn to think like Smart Money, you stop blaming the market and start understanding it.
You’ll realize every loss was a lesson pointing you toward better timing, discipline, and patience.
📊 Final Thought
The market is not your enemy — it’s your teacher.
Once you align with how liquidity and structure truly work,
you’ll stop feeling trapped and start trading with clarity and confidence.
💬 Follow for more institutional-based educational posts.
No signals. No hype.
Just pure trading knowledge and Smart Money insights that help you grow.

Bitcoin – Buying the Trendline, Not the HypeBitcoin (BTCUSD) continues to respect its rising trendline structure , showing consistent demand on every retest. This type of price action often reveals where smart money is quietly adding positions, not chasing, but accumulating near support.
Each of the highlighted points shows how price has respected this trendline multiple times, forming a clean series of higher lows. As long as this level holds, the broader direction remains bullish.
Currently, BTC is testing this key support once again. I’m positioning near the trendline because the risk is clearly defined , and the potential reward toward 111K+ remains wide open.
Short-term volatility can still appear, but structure beats emotions . As long as buyers defend this zone, we may see another impulsive leg forming soon.
Disclaimer: This analysis is for educational purposes only. It’s not investment advice. Always do your own research before trading.

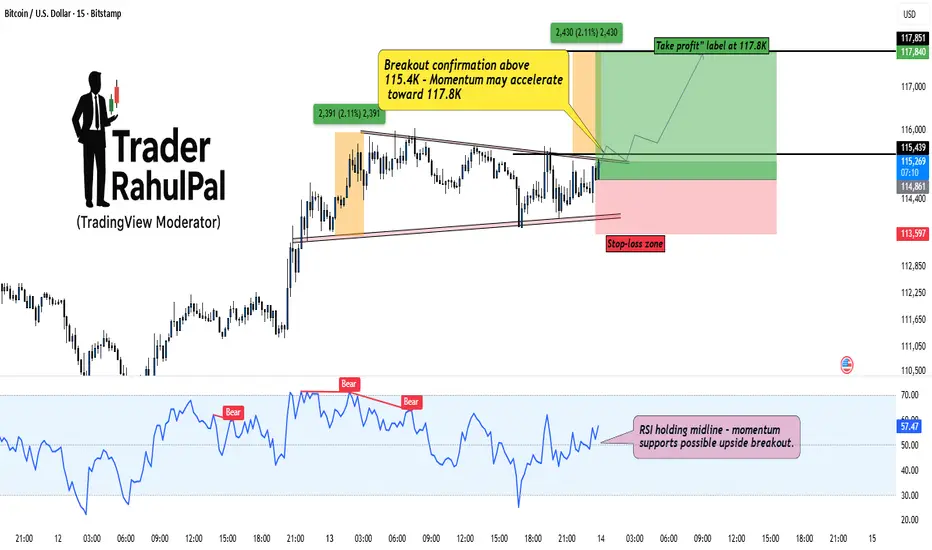
BTC – Building Discounted Longs Before the Breakout?Bitcoin (BTCUSD) is currently consolidating within a tight compression zone, showing signs of accumulation near 114.8K–115.4K . The market is coiling up right under resistance, hinting that a potential breakout could be around the corner.
As seen on the chart, structure remains bullish with a well-defined base and higher low formation. The key breakout confirmation lies above 115.4K , which could trigger a momentum push toward 117.8K , aligning with previous swing projections.
However, I’m personally building a small discounted entry position even before the confirmed breakout. The reason? When momentum starts expanding, it rarely gives clean entries, so catching early positioning near support provides better R:R potential.
RSI is holding above the midline, reflecting sustained buyer strength, while volume compression suggests a volatility expansion phase ahead. If price manages to sustain above the upper trendline, expect quick upside continuation.
Stop-loss remains below 113.6K to stay protected against fakeouts.
Rahul’s Tip:
Smart money often positions early when the crowd hesitates — timing matters, but conviction matters more.
Analysis By @TraderRahulPal (TradingView Moderator)
If this helped you spot the setup early, like and follow for more real-market insights.
Disclaimer: This analysis is for educational purposes only and should not be taken as financial advice. Please do your own research or consult your financial advisor before investing.
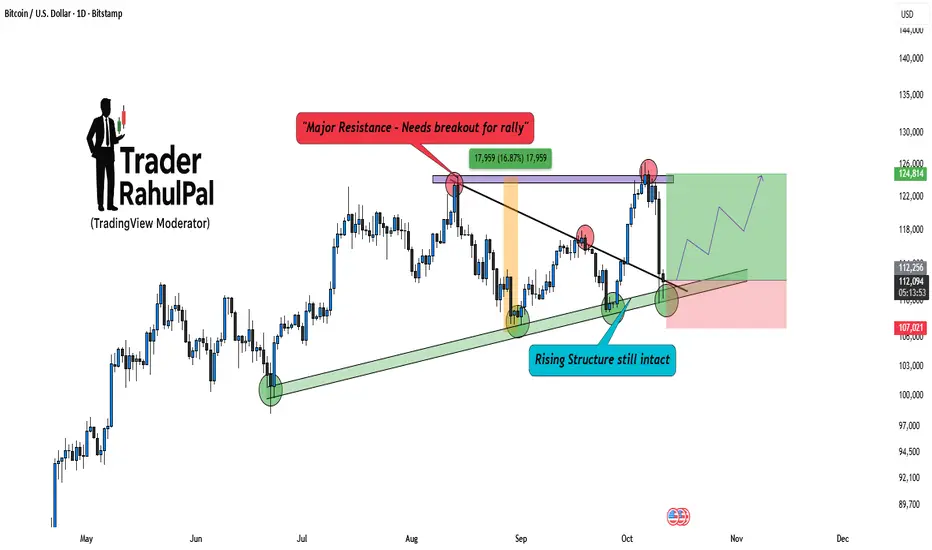
Bitcoin – Rising Structure Still Intact, Bulls Aren’t Done YetBitcoin (BTCUSD) continues to respect its rising structure , even after a sharp pullback from the resistance zone near 125K. While short-term traders might see this as weakness, price action tells a different story, the overall structure is still intact and favors the bulls.
Notice how BTC once again bounced from the ascending trendline support, confirming that institutional buyers are still active around these zones. The recent rejection was from a well-defined major resistance area , but as long as Bitcoin holds above the rising support band, the bias remains positive.
A breakout above 125K will open the doors for another impulsive leg toward 130K+ levels . On the downside, any sustained drop below 107K could temporarily shift momentum, but so far, there’s no structural damage visible.
Analysis By @TraderRahulPal (TradingView Moderator)
If this structure analysis helped you, like and follow for more insights on BTC’s long-term cycles.
Disclaimer: This analysis is for educational purposes only and should not be taken as financial advice. Please do your own research or consult your financial advisor before investing.
BTC → Correction phase before bullish expansionBTC/USD Report-Based Analysis
Bitcoin is currently in a corrective phase following a structured upward delivery. After showing strength early in the cycle, the market transitioned into a redistribution and consolidation zone, allowing liquidity to rebalance across both sides. This shift suggests that price is undergoing a short-term reaccumulation before the next impulsive move. The recent break of structure (BOS) indicates a temporary bearish delivery, designed to sweep liquidity below prior demand zones. Smart money appears to be collecting positions in discounted price areas, absorbing sell-side liquidity as volatility expands. The clean liquidity pockets under 116,000–114,000 levels highlight potential mitigation zones where larger participants may seek re-entry. The overall structure remains bullish on the higher timeframe. Once the current correction finalizes and liquidity is efficiently collected, BTC may resume its upward expansion, targeting premium zones near 125,000 and above. Momentum confirmation from volume and market flow will be essential for validating this transition back into a bullish delivery phase. In short, BTC is in a controlled correction, aiming to refine liquidity before reinitiating its bullish macro delivery cycle.

Bitcoin Correction = Smart Money Opportunity, ready for 3% move!Bitcoin (BTCUSDT) has been consolidating inside a well-defined descending channel , reflecting a healthy correction phase after the recent rally. While many traders panic in these phases, experienced players know that corrections are temporary, structures define direction.
Notice how price is approaching a key zone between 117K–116K, which aligns perfectly with both the lower channel boundary and the prior breakout retest zone. This area acts as a high-probability reversal zone , where strong hands are likely waiting for confirmation candles to re-enter the trend.
Psychologically, the 120K round level remains crucial. Expect volatility near this zone, as retail traders get trapped while smart money positions itself quietly before the breakout.
Once the breakout sustains above 121K, short-term traders could target levels around 122.5K–123K , while positional traders may aim for much higher structural targets.
Rahul’s Tip:
Never fear a pullback when structure stays intact, institutions use these dips to accumulate while the public exits too early. Stay patient, let the structure play out.
Analysis By @TraderRahulPal (TradingView Moderator)
If this breakdown and re-entry logic helped you, don’t forget to like and follow for regular updates.
Disclaimer: This analysis is for educational purposes only and should not be taken as financial advice. Please do your own research or consult your financial advisor before investing.
