XAUUSD – Consolidating Above 5,000 Before the Next Expansion XAUUSD – Consolidating Above 5,000 Before the Next Expansion | Lana ✨
Gold is currently trading around 5,020 USD/oz after a controlled technical pullback from recent highs. The overall structure, however, suggests this is a pause within a broader medium-term rising channel rather than a trend reversal.
On the H2 timeframe, price continues to respect the ascending channel and internal trendline support. The 5,000–5,050 zone has now become a key liquidity battleground between short-term sellers and medium-term buyers.
🔍 Technical View
5,000 USD remains the key psychological pivot. Holding above this level keeps the medium-term bullish structure intact.
5,260–5,270 (Sell FVG zone) acts as the next supply region and liquidity target if bullish momentum expands.
5,450–5,600 represents higher-timeframe liquidity near the all-time high zone, where stronger sell reactions may emerge.
Any pullback toward the lower boundary of the channel would likely be seen as structural re-accumulation rather than reversal.
Price action suggests compression within value, indicating liquidity build-up before a potential expansion move.
🌍 Fundamental Backdrop
Gold remains supported by three major drivers:
A weaker US Dollar as markets await key US data releases.
Cooling US Treasury yields, reducing the opportunity cost of holding gold.
Ongoing central bank gold accumulation and geopolitical uncertainty, reinforcing long-term demand.
Markets are closely watching upcoming Nonfarm Payrolls and CPI data, which will shape expectations around future Fed policy:
A more dovish outcome may trigger a breakout above current resistance.
A more hawkish surprise could create short-term pressure, though deeper pullbacks may still attract accumulation within the broader trend.
🧠 Lana’s View
The pullback near 5,000 appears technical, not structural. As long as the rising channel holds, the medium-term bias remains constructive.
Gold is consolidating — not reversing.
✨ Stay patient, respect liquidity zones, and let the data confirm the next expansion.
Smcanalysis

XAUUSD (H1) – Liam View | 5,000 Is the Key Battle Zone BeforeXAUUSD (H1) – Liam View | 5,000 Is the Key Battle Zone Before US Data
Gold has corrected back toward the 5,020–5,000 region after testing higher levels, but the overall structure still suggests this is a technical pause, not a confirmed trend reversal. On H1, price continues to respect the short-term uptrend and is holding above the 4,796 liquidity buy zone, while facing resistance near 5,100–5,145.
Macro Context
Markets are positioning ahead of important US data such as Nonfarm Payrolls and CPI.
Key supportive factors for gold remain:
Softer tone in USD
Declining US bond yields
Ongoing geopolitical tensions
At the same time, data volatility risk is high. The 5,000 level has now become a psychological and structural decision area.
Technical Structure (H1)
Strong resistance: 5,100 – 5,145
Major sell zone: 5,316
Primary buy liquidity: 4,796
Sell-side liquidity below: around 4,700
Price is compressing just below resistance, which usually precedes a liquidity move. Two main possibilities:
Liquidity sweep above 5,100 followed by rejection
Pullback toward 4,796 for rebalancing before the next directional move
As long as 4,796 holds, the H1 structure remains supportive for upside attempts. A sustained move below this level would shift short-term control back to sellers.
Liam’s Approach
If US data is dovish: Break above 5,145 may open expansion toward 5,300+
If data is hawkish: Expect pressure lower, possibly toward 4,796 liquidity
Avoid reacting emotionally to headlines.
Let the data release play out.
Trade only after structure confirms.
— Liam

Weekly Analysis with buy/Sell scenarios in Gold/XAUUSD👋👋👋 Friends, What's your view on Gold ???
Week on Week basis price of Gold shown too much volatility. Price opened ~ $55 gap down and sharply fell and made low of day and week. Next day it showed recover and further three days it was range bound.
Now price is showing change in state of delivery. We may expect slightly slip/consolidation on Monday and later on it may further take the rout of POI/Key Level of 4500. Which is again a very strong round number as well. At this level we may witness reversal pattern/entry model which may further take the price upside to make new highs.
Critical notes.
1. Price may show some consolidation on early sessions or Monday/Tuesday.
2. High probably we will witness KOD and move into lower quadrant of weekly time frame.
3. There should be a proper entry model formation at identified POI/Key level
4. Most probably price will take liquidity of Key Level/FVG/RDRB level and create MSS/CISD/TS/iFVG in LTF.
5. Price should show rejection/reversal in respective LTF (1h/15m) at Key Level/FVG zone.
6. Take the trade only once clear entry model i.e. turtle soup. iFVG break, CDS or MSS happens on LTF
All these combinations are signalling a high probability and high RnR trade scenario.
Note – if you liked this analysis, please boost the idea so that other can also get benefit of it.
Also follow me for notification for incoming ideas.
Also Feel free to comment if you have any input to share.
Disclaimer: This analysis is for educational purposes only and does not constitute investment advice. Please do your own research (DYOR) and check with your financial advisor before making any trading decisions.

BTCUSD · 15M · SMC BiasPrice is currently compressing inside a higher-timeframe premium discount equilibrium, respecting a clear range structure.
HTF Context
Equal highs / liquidity resting above the range highs.
Premium zone overhead aligned with prior supply + inducement.
Discount zone below marked by clean HTF demand.
LTF Narrative
Market already delivered a strong impulsive leg up.
Current consolidation suggests liquidity engineering, not continuation.
Upside push toward the equal highs is likely a liquidity grab, not acceptance.
Expectation
Sweep of buy-side liquidity into the premium zone.
Immediate reaction from supply.
Sharp displacement to the downside targeting:
Range low
Discount imbalance
HTF demand below
Execution Plan
No chasing longs in premium.
Wait for:
Liquidity sweep above highs
Bearish displacement
LTF MSS confirmation
Shorts favored post confirmation.
Targets trail into discount until opposing demand shows intent.

LiamTrading – XAUUSD H1 | Two scenarios for the new weekLiamTrading – XAUUSD H1 | Two scenarios for the new week: wait for reactions at 4100 & Fibonacci zone – prioritise bullish trades when the market recovers
Gold is completing a technical rebound after a sharp drop, and H1 is showing two clear scenarios for the new week. The medium-term trend remains a corrective decline, but on H1, the price is in a rebound phase, so bullish trades will be prioritised – as long as the lower liquidity zones are maintained.
The key this week lies at 4100, where FVG, Fibonacci, and liquidity converge – this is the decisive point to see if gold will bounce back or continue to decline deeply.
🔍 Technical Analysis (Fibonacci • Trendline • Liquidity • Volume Zone)
Fibonacci H1: The price may rebound to Fib 0.5 (~4140–4150) – a zone with high liquidity & likely to show a bearish reaction.
Fib 0.382 (~4120–4130) is currently the first short-term resistance.
Price Structure: The medium-term downtrend is still present, but H1 is forming a rebound wave → prioritise buying when the price pulls back at the support zone.
The descending trendline is still controlling the market. If it breaks the trendline + holds above 4130–4150 → the uptrend is confirmed stronger.
Important liquidity zones:
4100: liquidity confluence + previous bullish resistance → strong reaction zone.
4085 and 4060: liquidity bottoms – if breached, it will trigger a deep decline scenario.
4032: FVG + Fibonacci bottom – the "break or hold" zone for buyers.
Key resistance this week: 4161 – 4187 – 4138 – 4111
📈 TRADING SCENARIOS FOR THE NEW WEEK
Scenario 1 – Bullish trade (priority)
Logic: Gold is rebounding; if it holds 4100 and pulls back strongly → target is the upper Fibonacci zone.
Entry: 4100–4111
SL: 4090
TP: 4138 → 4161 → 4187
Suggestion: Wait for strong signals like pin bar or engulfing H1 to confirm the rebound bottom.
Scenario 2 – Bearish trade (when the market fails to hold the bottom)
Logic: If gold breaks the H1 bottom and retests 4100 without holding → the medium-term downtrend continues to activate.
Entry: 4100–4108 (retest after break)
SL: 4120
TP: 4085 → 4060 → 4032
Suggestion: Only enter when H1 closes below 4100.
🌍 Macro Analysis – Fed causes market noise
According to the latest data from CME Watch:
54.1% chance the Fed maintains rates at 375–400 bps
45.9% chance the Fed cuts rates
The ratio is almost balanced → the market is very indecisive, creating unpredictable volatility ahead of the 10/12 meeting.
In this environment, gold often reacts strongly to unexpected news, so prioritise trading at liquidity zones – wait for clear confirmation.
⚠️ Invalidation Conditions
Price closes below 4060 → fully prioritise bearish trades.
Price closes above 4161 → strong bullish trade activated, discard all sell setups.
What scenario are you preparing for the new week?
Please comment & hit Follow on LiamTrading channel to receive the earliest analysis every day!

XAUUSD – H4 SCENARIO FOR THE WEEK 17–21/11 💛 XAUUSD – H4 SCENARIO FOR THE WEEK 17–21/11 🎯
🌤 1. Overview
Hello everyone, it's Lana here again 💬
The new week begins with a narrowing trading range on the H4 chart, signalling that gold is preparing for a more significant move. The current medium-term trend needs to break the descending trendline above to confirm the return of the buyers.
💹 Technical Analysis
📉 The end-of-week downtrend is entering a technical rebound phase and is likely to continue declining towards the 4000 trendline – a confluence with a strong liquidity zone.
🟣 Key price levels to watch include: 4138 – 4200 – 4212 – 4037. These are liquidity concentration points, expected to have a clear reaction according to market sentiment.
🔹 Traders can use Fibonacci retracement to spot selling entry points, combined with confirmation signals on smaller time frames (M15–M30).
🌐 Macro Context
The financial market is facing difficulties as US tax policies change continuously, putting pressure on both Gold and Bitcoin.
The end of the year is also a characteristic phase of the economic slowdown cycle, where the market tends to adjust more strongly.
🎯 Reference Trading Scenario (Reference Trading View)
Priority is given to selling according to the technical rebound, especially when the price enters the confluence Fibo + liquidity zones.
Buying is only considered when the price reacts strongly at the 4000 trendline or the 4037 zone.
🌷 6. Conclusion with LanaM2
Gold is in a zone preparing for a big move 💛
Be patient and wait for reactions at important liquidity zones to have a better and safer entry point.
If you find it useful, please 💛 Like – 💬 Comment – 🔔 Follow LanaM2 to receive daily gold analysis! ✨

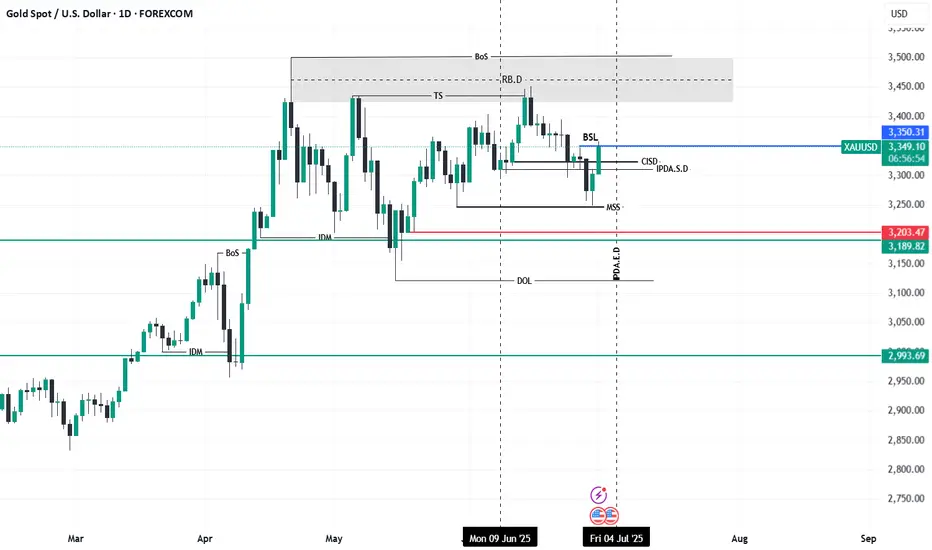
Gold (XAUUSD) - Daily ICT Based Analysis🗓️ Date Range: IPDA Range (June 9 – July 4, 2025)
This chart is built using ICT methodology focusing on market structure, liquidity, PD arrays, and smart money price delivery.
🧠 Narrative Breakdown:
✅ IPDA Range is defined from June 9 to July 4 (20 trading days), providing the valid high and low to map premium/discount.
✅ A Market Structure Shift (MSS) confirms the intent to shift bearish after internal liquidity was swept.
✅ Price ran the Buy Side Liquidity (BSL) and rejected from the Daily Rejection Block (RB.D) and CISD + IPDA S.D., indicating institutional selling interest.
✅ The recent rally into the premium zone failed to close above BSL, showing weakness and potential continuation to the downside.
🎯 Key Points:
BSL Swept above internal range.
RB.D + CISD + IPDA S.D.: Price rejected from these confluences.
Current Bias: Bearish until 3,203.47 and 3,189.82 are met (internal sell-side liquidity).
Extended Target: 2,993.69 — external liquidity resting below the May low.
DOL marked inside the range suggests smart money is engineering price toward sell-side targets.
⚒️ Tools Used:
IPDA Range (20D)
MSS / BoS
Rejection Block (RB.D)
CISD + IFVG
PD Arrays (BSL, IDM, DOL)
📌 Summary:
This is a classic Sell Model within a defined IPDA range. Liquidity was swept, price rejected from premium, and now seeks inefficiencies + sell-side liquidity.
🧠 Wait for price action confirmations on lower timeframes (1H/15M) near PD arrays to engage.
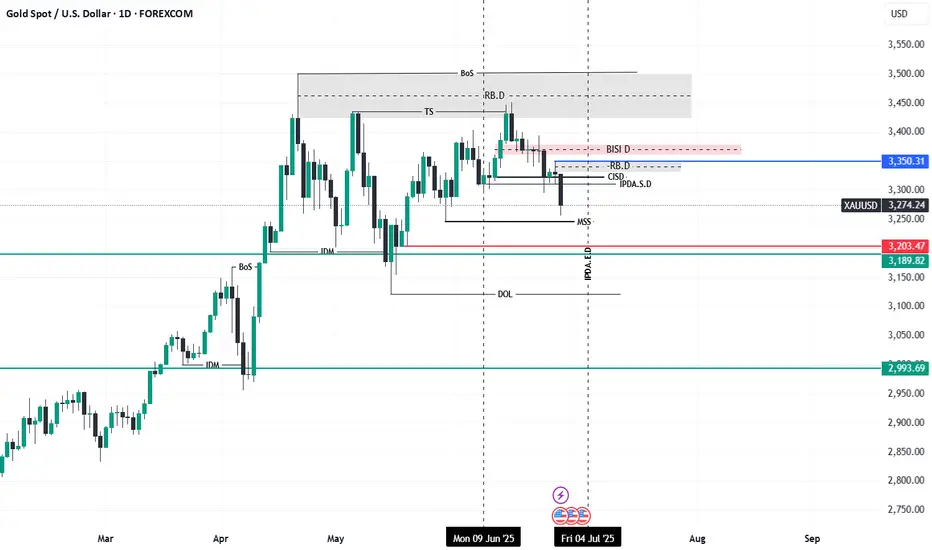
Gold (XAUUSD) - Daily ICT Based AnalysisThis chart reflects a detailed breakdown of Gold using Inner Circle Trader (ICT) concepts on the daily timeframe.
🧠 Key Highlights:
Break of Structure (BoS) and Market Structure Shift (MSS) confirm bearish intent.
Price recently delivered a strong displacement to the downside, breaking through the prior IDM low and forming a clean MSS.
The price has rejected from the Daily Bearish Imbalance (BISI D) and Refined Breaker Block (RB.D) — acting as a key supply zone.
Confluence of Liquidity and Imbalance:
Internal liquidity has been swept from equal highs.
Bearish rebalancing observed in the CISD + IPDA S.D. zone.
Next probable draw on liquidity sits near the 3,203.47 and 3,189.82 PD arrays.
Ultimate downside target marked around 2,993.69, aligned with a previous BMS + DOL zone.
🛠 Tools Applied:
PD Arrays: BISI, RB, FVG, SIBI
Liquidity Zones: IDM, DOL, IPDA S.D.
Price Action: MSS, Displacement, and Retracement Concepts
📌 Bias: Bearish
📌 Narrative: Liquidity has been engineered above highs; current price action seeks sell-side liquidity and inefficiencies beneath recent lows.
EURUSD next moveMarket Structure & Price Action Analysis:
The EUR/USD pair on the 15-minute timeframe has exhibited a clear bullish structure, with price forming higher highs (HH) and higher lows (HL), indicating an uptrend continuation.
A Break of Structure (BoS) was observed on the 15-minute chart, which acted as a confirmation of bullish momentum.
After the BoS, price retraced into a 15-minute demand zone (15-Zone), marked in green, which was previously a liquidity grab before the expansion to the upside.
Liquidity & Institutional Order Flow:
Multiple sub-swings were identified, showing market consolidation before the impulsive breakout.
The liquidity sweep at the 15-zone demand area (green zone) suggests that institutional traders (smart money) induced selling pressure before driving price higher.
The 4-hour supply zone (marked in blue) has been mitigated, causing a rejection from the premium pricing zone, indicating potential distribution and a pullback.
Next Probable Move & Trading Plan:
Bullish Bias: If price sustains support above the 15-zone demand area, we can expect a continuation towards the 4-hour supply zone for another retest.
Bearish Correction: A failure to hold this demand could result in a short-term retracement towards the previous low near 1.0883, where liquidity may be resting.

SRF Intraday SwingBias is on upside for intraday for next week.
This is a chart analysis based on SMC Concept.
This is for education purpose only.

Trade Idea: $NSE:RELIANCE for Next WeekHello, Traders! 👋
#RELIANCE is shaping up as an interesting watch for the coming week:
📈 Technical Overview:
🔹 Weekly Retracement Level: Trading near the golden zone, a key area for potential reversal.
🔹 Daily Supply Zone Confluence: Overlapping supply zone could act as a critical resistance.
🔹 1-Hour Liquidity Sweep: Potential for a liquidity grab before resuming an upward move.
💡 Plan of Action:
Keep a close eye on price action around these levels. A confirmed breakout or rejection could set the direction for the next move.
⚠️ Disclaimer:
🔹 This analysis reflects my personal views and is not a recommendation to buy or sell.
🔹 Please conduct your own research or consult a professional before trading.
What’s your outlook on #RELIANCE for next week? Let’s discuss! 🚀
#StockAnalysis #TradingView #TechnicalAnalysis #MomentumStocks #RELIANCE

USDJPY TRADING POINT UPDATE > READ THE CAPTAIN Buddy'S dear friend 👋
USD JPY SMC Trading Signals 🗺️🗾 Update USD JPY ready for down 👇 trend 📉 technical analysis update USD Already done with.109:600 back down 👇 JPY closed below 157.067
Next support level 156.00
Analysis target we'll see 156.00
MR SMC trading point
Support 💫 My hard analysis Setup like And Following 🤝 me that star ✨ game 🎮

USDJPY ORDER BLOCK | SHORT TRADEHi traders,
This USDJPY 4 hr Order block. 153.830 selling area.
According to smc concept we can see Selling from this level.
if you see 5 min CHoCH is best for entry.
Note - Only for education purpose
If you like my anaylsis then you should like and follow me.

Gold View, XAU/USD 13th NOVGold - Gold has a changed it's structure now .
It's will should a pullback to it's Supply zone marked on this image.
Expecting it to continue it's down move now from the POI.
This Is My Personal Analysis, It's not a Tip.


XAUUSD ORDER BLOCK | BUYING TRADEHi Traders
This Area is 4Hr Order block according to SMC.
2316 to 2305 This is Liquidity Pool we can see
upside movement after taking this liquidity.
Best time to take trade is 5 min CHoCH but after Rejection.
Note - Only for education Purpose

EURUSD 1HR ORDER BLOCK | SHORT TRADEHi Trader
Eurusd taken previous 1hr and 4hr liqduity so selling expected
according to SMC.
5 min CHoCH is best to take short trade
Note - Only for education purpose

NZDUSD ORDER BLOCK | 1 HR POINZDUSD ORDER BLOCK | 1 HR POI
Hi traders..,
This is Nzdusd 1hr POI Liqudity taken now
we will see selling from 0.60170 level this best selling setup.
5 min choch best to take trade..
Note - Only for education purpose

USDCAD 1hr Bearish Order Block | 1:10 Trade Almost Hi Traders
This Usdcad 1hr Bearish Order Block at this level we can see some Liquidity
Then Cad goes down. This is best trade because it's 1:10 trade.
Note - only for education Purpose..💯
Give like share and follow

Usoil 1hr POI | Forex Best TradeHi trader
This 1hr POI USOIL Taken Previous day liquidity (16/04/2024).
I expect Buying from this level
Note - Only for education purpose.

MIDCAP 150, 8th APRIL 2024Midcap Index is again approaching towards the ATH.
No major Demand zones have formed recently, so we can expect the price to take some support from the EMA's or the Demand zone marked ( 17821- 17677) and move up higher.
THIS IS MY PERSONAL ANALYSIS FOR MY PERSONAL TRADING NOT A TIP OR ANY TRADE RECOMMENDATION.

NIFTY MIDCAP 150 VIEW FOR 26.MARCH.2024Midcap Index is facing heavy Sell offs.
Expecting the price to show a small pullback and continue moving down.
It is testing the FVG (17180 - 17620) before making further LL's.
THIS IS MY PERSONAL ANALYSIS, FOR MY PERSONAL TRADING.
IM NOT SEBI REGISTERED.

BANK NIFTY VIEW FOR 26 MARCH 2024Bank Nifty has covered the Imbalance (46345 - 46981 ) on the down side. It has also spend some time inside the Demand zone marked and now slowly slowly move up towards the high.
THIS IS MY PERSONAL ANALYSIS, FOR MY PERSONAL TRADING.
IM NOT SEBI REGISTERED.
