Explosive Volume Breakout StocksHello Traders! Today’s session was packed with action as several midcap names showed explosive breakouts on record volumes. These setups are not only backed by price action but also confirmed by multiple technical indicators such as RSI, Bollinger Bands, SuperTrend, VWAP, and BB Squeeze. Let’s decode them in detail 👇
1️ Greenpanel Industries Ltd (NSE: GREENPANEL)
CMP: ₹322.15 (+18.09%)
Breakout with Heavy Volumes
Key Supports: ₹288 / ₹254
Resistances: ₹341 / ₹361 / ₹395
🔑 Strong 52-week breakout with bullish follow-through. Sustaining above ₹288 could keep the momentum alive.
The stock witnessed a 52-week volume breakout, supported by a strong bullish candle that confirms aggressive buying interest. The RSI has broken out, highlighting fresh momentum, while the Bollinger Band breakout shows volatility expansion after a period of consolidation. Alongside this, the Bullish SuperTrend and VWAP indicators confirm trend alignment with volume, suggesting institutional participation. Interestingly, the BB Squeeze turning off signals that the low-volatility phase has ended, and the stock may now enter a trending move.
________________________________________
2️ Indoco Remedies Ltd (NSE: INDOCO)
CMP: ₹308.60 (+11.47%)
RSI Breakout + Volume Expansion
Key Supports: ₹280 / ₹252
Resistances: ₹334 / ₹360 / ₹388
🔑 Open = Low + strong bullish candle. Short-term traders may keep an eye on ₹280 as support.
Indoco Remedies also recorded a powerful 52-week volume breakout, signaling accumulation at higher levels. The RSI breakout validates the momentum shift, while the “open = low” pattern reflects intraday buying from the very start of the session. The Bollinger Band breakout points to volatility expansion, and the Bullish SuperTrend along with VWAP confirms that both trend and volume are favoring the bulls. Additionally, the BB Squeeze compression breakout shows that the stock has just moved out of a tight consolidation, opening the doors for a strong upside continuation.
________________________________________
3️ Piccadilly Agro Industries Ltd (NSE: PICCADIL)
CMP: ₹723.80 (-13.58%)
Strong Bullish Candle on Massive Volumes
Key Supports: ₹660 / ₹598
Resistances: ₹765 / ₹806 / ₹869
🔑 Despite closing off highs, volumes indicate institutional interest. Watch ₹660 as a key level.
Piccadilly Agro displayed a strong bullish candle backed by exceptional volumes, which suggests fresh interest from market participants. The RSI breakout supports the strength of the momentum, while the Bollinger Band breakout indicates that the stock has entered a new volatility phase. Both Bullish SuperTrend and VWAP confirm that the price move is well-supported by trend-following and volume-based systems. With the BB Squeeze off, the compression phase has ended, further confirming the possibility of an extended rally if key supports hold.
________________________________________
4️ SMS Pharmaceuticals Ltd (NSE: SMSPHARMA)
CMP: ₹300.55 (+12.14%)
52-Week Volume Breakout
Key Supports: ₹273 / ₹247
Resistances: ₹319 / ₹339 / ₹365
🔑 Stock showing bullish momentum with multiple indicator confirmations. A close above ₹319 may trigger the next leg.
SMS Pharma registered a 52-week volume breakout combined with short-term bullish momentum, indicating a strong change in trend. The RSI breakout highlights renewed momentum, and the Bollinger Band expansion reflects volatility returning after consolidation. The Bullish SuperTrend and VWAP are both in sync with the buyers, suggesting sustainable strength. The BB Squeeze turning off is another confirmation that the quiet phase is over, and the stock could witness directional movement. Overall, multiple indicators align to suggest that this breakout has solid backing from both price and volume action.
________________________________________
💡 Technical Takeaway:
When volume expansion aligns with RSI, Bollinger Bands, and SuperTrend confirmations, breakouts have higher chances of sustaining. Always track key support levels for validation.
⚠️ Disclaimer – Please Read Carefully
The information shared here is meant purely for learning and awareness. It is not a buy or sell recommendation and should not be taken as investment advice. I am not a SEBI-registered investment advisor, and all views expressed are based on personal study, chart patterns, and publicly available market data.
Trading — whether in stocks or options — carries risk. Markets can move unexpectedly, and losses can sometimes exceed the money you have invested. Past performance or past setups do not guarantee future results.
If you are a beginner, treat this as a guide to understand how the market works — practice on paper trades before risking real money. If you are experienced, always assess your own risk, position sizing, and strategy suitability before entering trades.
Consult a SEBI-registered financial advisor before making any real trading decision. By engaging with this content, you acknowledge full responsibility for your trades and investments.
💬 Found this useful?
🔼 Give this post a Boost to help more traders discover clean, structured learning.
✍️ Drop your thoughts, questions, or setups in the comments — let’s grow together!
🔁 Share with fellow traders and beginners to spread awareness.
👉 “If you liked this breakdown, follow for more clean, structured setups with discipline at the core.”
🚀 Stay Calm. Stay Clean. Trade With Patience.
Trade Smart | Learn Zones | Be Self-Reliant 📊
SMSPHARMA
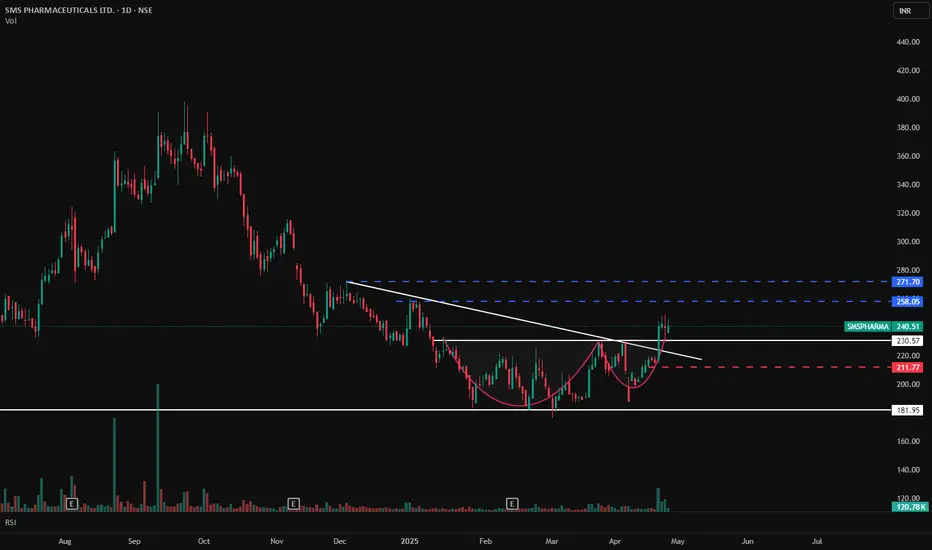
SMS PHARMA - Cup & Handle Breakout with Volume Confirmation📊 SMS PHARMA – Cup & Handle Breakout with Volume Confirmation
🕰️ Timeframe: 1D | 📐 Pattern: Cup & Handle Formation
🔍 Technical Setup:
SMS Pharma has formed a classic Cup & Handle pattern, which is a bullish continuation pattern. The breakout has occurred above the neckline resistance with a clean breakout candle, confirming bullish momentum.
The falling trendline resistance has also been decisively broken, adding further confidence to the breakout strength.
🔑 Key Levels to Watch:
🔵 Resistance (Upside Targets):
₹258.05
₹271.70
🔴 Support Zones:
₹230.57 (neckline support)
₹211.77 (handle base)
₹181.95 (major horizontal support zone)
📊 Volume & Indicators:
🔺 Volume Surge at breakout confirms strength and participation — a good sign for trend continuation.
📈 RSI: 64.58 — close to overbought zone, but still indicating strength. Minor consolidation near ₹240 would be healthy before further up move.
🧠 Bias: Bullish
📉 Any pullback to ₹230–₹235 can offer a good entry opportunity with risk managed below ₹211.
⚠️ Disclaimer: This is an educational analysis and not investment advice. Do your own research before making any trading decisions.
📈 Follow @PriceAction_Pulse for more breakout setups and swing trading ideas!
💬 Drop your thoughts in the comments — will this Cup & Handle breakout hit the ₹270 zone?
SMS PHARMA: Ready a for bounce from Fibonacci Golden Zone!⚡️Price Analysis:
1️⃣ Price testing crucial fibonacci retracement level.
2️⃣ Strong Dz confluence with previous ATH breakout zone
3️⃣ Sharp correction meeting multiple support levels
4️⃣ EMAs providing dynamic resistance above.
✨ Key Observations:
➡️ Multiple technical confluences at the current level
➡️ Expecting good 1:3 RRR w/ 15% SL
➡️ RRR is highly favourable at current levels
➡️ Price structure suggesting a potential reversal
➡️ Volume patterns indicating selling exhaustion
➡️ The pharma sector is showing relative strength.
➡️ Perfect technical setup with multiple confirmations is looking to good.
⚠️ Disclaimer: This is NOT a buy/sell recommendation. This post is meant for learning purposes only. Views are personal. Please, do your due diligence before investing.⚠️
💬 Share your thoughts on this analysis in the comments below! ✌️
🔥 Happy Trading!✅🚀

SMSPHARMA - long term chart analysis. Targets & way ahead.Long term chart Analysis of SMSPHARMA.
Momentum charts - Absolute & Relative Momentum
What can happen after Momentum charts indicate peak Momentum - explained with an example.
The strength of current trend explained.
Probable targets.

Sms Pharmaceuticals Limited - Breakout Setup, Move is ON...#SMSPHARMA trading above Resistance of 299
Next Resistance is at 404
Support is at 194
Here are previous charts:
Chart is self explanatory. Levels of breakout, possible up-moves (where stock may find resistances) and support (close below which, setup will be invalidated) are clearly defined.
Disclaimer: This is for demonstration and educational purpose only. This is not buying or selling recommendations. I am not SEBI registered. Please consult your financial advisor before taking any trade.

Big Bullish Brekout of Daily Flag PatternA Bullish Breakout of Flag and Pole pattern is visible on the Daily chart of NSE:SMSPHARMA
MACD gave Positive crossover on Daily and will give positive crossover on Weekly chart. So, expecting the momentum to continue.
One can create a fresh position in the scrip as per the levels mentioned on the chart.
Risk Disclaimer:
The information provided in this analysis is based on my personal interpretation of market conditions and the available data at the time of writing. It is advisable to seek advice from a qualified financial professional and to conduct your own research before making any investment decisions.

SMS Pharmaceuticals: Long Opportunity After Multi-Year BreakoutAnalysis:
The provided chart of SMS Pharmaceuticals (SMS Pharma) on TradingView reveals a potentially lucrative breakout opportunity. Let's break it down:
Current Price: ₹145.45, comfortably above the multi-year resistance level of ₹136 marked by the blue line.
Breakout Confirmation: The recent surge past the resistance zone, accompanied by strong volume, suggests a potential trend reversal from resistance to support.
Uptrend Momentum: The sustained price increase after the breakout indicates continued buying pressure, hinting at further upside potential.
Trading Strategies:
Aggressive:
Enter long if the price closes and sustains above the current level (₹145.45) with persistent buying volume.
Implement a stop-loss order below the breakout level (₹130 ) to manage risk.
Potential target prices could be ₹160 and ₹175 based on chart patterns and Fibonacci extensions.
Conservative:
Wait for a potential pullback towards the breakout level (₹136) or within the previous consolidation zone (₹120-₹136).
Enter long if the price finds support at the pullback zone and exhibits bullish reversal signs (e.g., hammer candlestick pattern).
Utilize a stop-loss order below the pullback low for effective risk management
Additional Considerations:
While technical analysis is insightful, remember that the stock market remains inherently volatile.
Conduct thorough fundamental research to assess SMS Pharma's financial health, industry outlook, and future prospects before making investment decisions.
Implement prudent risk management through stop-loss orders and appropriate position sizing.
Disclaimer: This analysis is for educational purposes only and should not be considered financial advice. Please conduct your own research before making any investment decisions.

Break of parellel channel1.Volume is good
2.resistance has been tested for more than 100days
3.rsi from support
more possible for gap up
target 136.139+

SMS Pharma Analysis Stock has given strong BO on daily and weekly chart with massive volume, heading to complete round bottom pattern, follow chart for proper support and resistance.

SMS Pharma Long Term Story - Weekly Charts signaling ReversalSMS Pharma can be Good Long term Investment with Pharma Sector showing the Buying Interest Again.
Weekly charts suggest Reversal in Trend & the Long Term investors can be rewarded by 2x-3x Returns in coming Years.
Targets Given purely based on Technical charts & No Fundamental Analysis done. Please do your Homework before taking any call on stock.
Happy Investing to my Friends!!

SMSPHARMA- Ichimoku Bullish Breakout Stock Name - SMS Pharmaceuticals Limited
Ichimoku Cloud Setup :
1). Today's close is above the Conversion Line
2). Future Kumo is Turning Bullish
3). Chikou span is slanting upwards
All these parameters are showing bullishness at Current Market Price
and more bullishness AFTER crossing 106
#This is not Buy and Sell recommendation to any one. This is for education purpose and a helping hand to learn trading in Market.
# Cloud Trading
# Ichimoku Cloud
# Ichimoku Followers
I hope you all like my analysis.
Please do share your thoughts into comment section.
Please give a like, it motivates me to do analysis.

SMS Pharma - Negative trend reversalSMS Pharmaceuticals underwent long downtrend from 198.8 on 05/08 to 116 on 20/12. This trend seems to have gotten over with Higher High and Higher Low pattern since 20/12.
Pattern:
1. Higher High Lower Low on Daily basis from 20/12
2. Cup and Handle Pattern beginning from from 04/11/21
Technicals:
1. Positive RSI Divergence
2. RSI Cross over on daily basis
3. High Volume after creating higher high, along with a 2nd green candle
SL: 120


SMSPHARMA Trendline | LONG| Stock is in clear uptrend making Higher highs and Higher lows with small corrections .The upward moves are additionally supported with volume spikes creating a strong bullish bias.
Should give a blast move in coming days.
2.5 RR

SMSPHARMA - Buy IdeaSMSPHARMA is a budding smallcap company which is improving its fundamentals in Pharma industry. The company is sure to grow backed by strong demand in pharma sector.

FLAG Bullish SMS PharmaSMS Pharma : Flag Bullish Pattern Breakout above 103
SL: 78
Target : 165++
as per technical... educational purpose only


