Pump.fun Sells $741M in SOL After X Suspension – What’s Really?Pump.fun Sells $741M in SOL After X Suspension – What’s Really Happening?
PumpFun (@pumpdotfun), a popular Solana-based meme token launch platform, was recently suspended from X — but they’ve been making major moves behind the scenes.
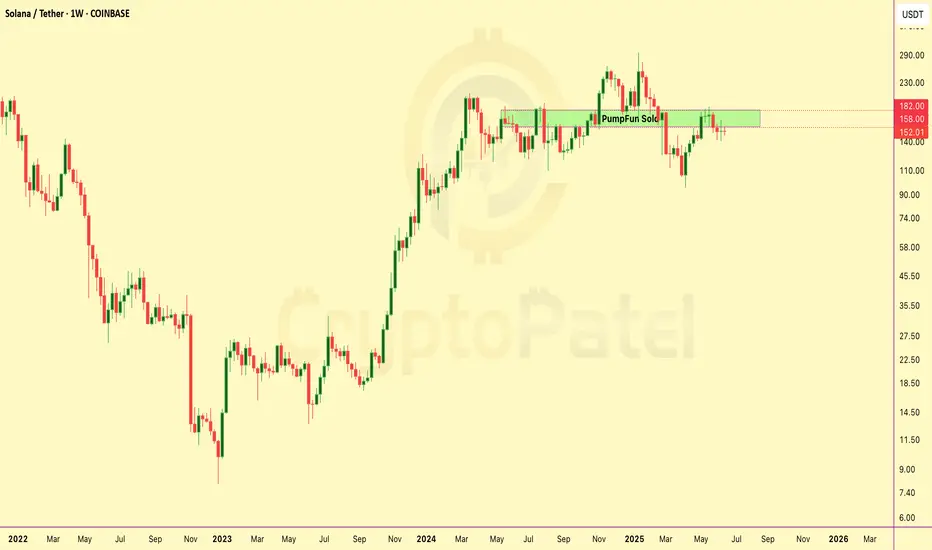
Since May 19, 2024, the platform has sold around 4.1 million SOL, worth nearly $741 million, at an average price of $180.
Here’s the full breakdown:
🔹 264,373 SOL sold for $41.64 million USDC at $158
🔹 3.84 million SOL, worth $699 million, sent to Kraken at $182
Why is Pump.fun selling so much?
Is this an exit strategy, or are they just managing risk?
SOL
Is $SOL about to DUMP… or set up a MASSIVE BUY ZONE?Is CRYPTOCAP:SOL about to DUMP… or set up a MASSIVE BUY ZONE?
Solana is now at a critical level on the higher timeframe chart:
✅ After a breakdown, SOL is now retesting the bearish retest zone
✅ Strong resistance seen at $170–$180
✅ If rejected → price could dip toward the $100 range
But here’s the key: A dip to $100 would be a massive long-term buying opportunity for many investors (including me).
Long-term targets? I’m still eyeing $500 → $1000 if the macro trend plays out.
👉 Keep a close eye — the next few weeks could set up the next big move for $SOL.
Are you ready? Will you be buying the dip? Comment below! 👇
NFA & DYOR
Bitcoin is just 2% away from a new all-time high —will it break?Bitcoin is just 2% away from a new all-time high — will it break or fake? 🚀
BTC is currently trading near $109K–$110K, only 2% below the $112K ATH level.
Strong supports: $94,000 / $80,000
Bullish Case:
If BTC breaks $110K–$112K with strong volume + a bullish weekly close → we could see a rally toward: $135K → $150K
Bearish Case:
If BTC rejects at $110K–$112K, a deep retracement below $100K is possible. Watch for strong support at $100K and $80K levels.
My Personal Take:
I'm bullish overall — but since we’re this close to ATH, I’m opening a short trade with 3% stop loss targeting near $100K.
👉 Not financial advice — do your own research. The crypto market is highly volatile.
Watch this level closely — next big BTC move may be starting NOW. 👀

BITCOIN WARNING – $104K IS KEY🚨 BITCOIN WARNING – $104K IS KEY
#Bitcoin is showing signs of weakness on the 4H chart! Let’s break it down:
🔻 Trend Shift Detected:
Recent CHoCH and BOS suggest the uptrend is over. Market structure has turned bearish.
Key Levels to Watch:
▪️ Support at $104K is being tested again. If it breaks, we may see a drop.
▪️ Next major targets:
➤ $100.5K (Unfilled Fair Value Gap)
➤ $98K – Strong demand zone
➤ $96.6K – Bullish Order Block + FVG confluence
Why It Matters:
▪️ Price rejected hard from the $107K zone (supply + FVG)
▪️ Liquidity was grabbed from Equal Highs
▪️ Now it’s hunting lower liquidity near $100K
⚠️ If $104K fails, get ready for a quick drop to $100.5K or even $96.6K
Plan: Short-term bearish unless BTC breaks back above $106K with volume.
Stay alert — volatility incoming!

$ME/USDT Technical Breakdown – What’s Happening?$ME/USDT Technical Breakdown – What’s Happening?
1️⃣ Market Shift:
We finally got a CHoCH (Change of Character) — the downtrend is likely over!
2️⃣ Support Bounce:
Price respected the strong support zone at $0.76–$0.83 and bounced hard 💪
3️⃣ Trendline Breakout:
A major descending trendline has been broken — signaling bullish momentum 🚀
4️⃣ Next Steps:
There’s an unfilled Fair Value Gap (FVG) below at $0.86–$0.95 — price might dip there to grab liquidity before flying again.
Possible Upside Targets: $1.40 → $1.70 → $2+
Don’t chase. Wait for the pullback = best entry!

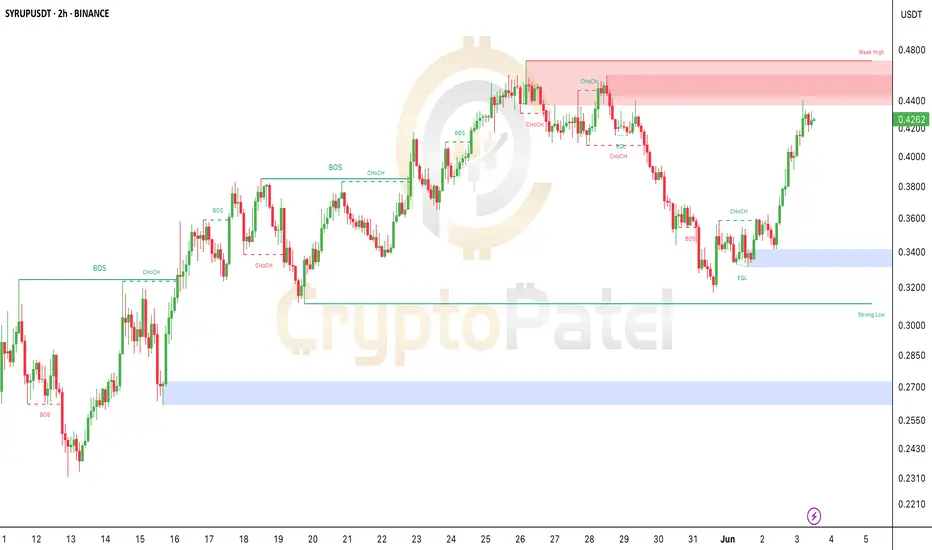
SYRUP/USDT About to Explode? Here’s What Smart Money is Doing!SYRUP/USDT About to Explode? Here’s What Smart Money is Doing!
After weeks of sideways action, SYRUP just flipped bullish from a strong demand zone near $0.34.
It broke structure, reclaimed key levels, and is now eyeing the $0.44–$0.46 weak high zone!
This move looks like a classic Smart Money re-accumulation setup — and it’s gaining momentum fast!
Key Signals:
✅ Strong CHoCH + BOS combo
✅ Equal lows protected (liquidity trap avoided)
✅ Massive green candles + volume spike
✅ Next resistance: $0.46 — if broken, clean sky above!
Watch Closely:
If price reclaims $0.4450 with volume, we might see a breakout rally!
Short-Term Target: $0.46+
Strong Support: $0.38 and $0.34 zones
Don’t sleep on this move! Track, set alerts, and trade smart.
Your edge is in the knowledge — not the hype.
NFA & DYOR
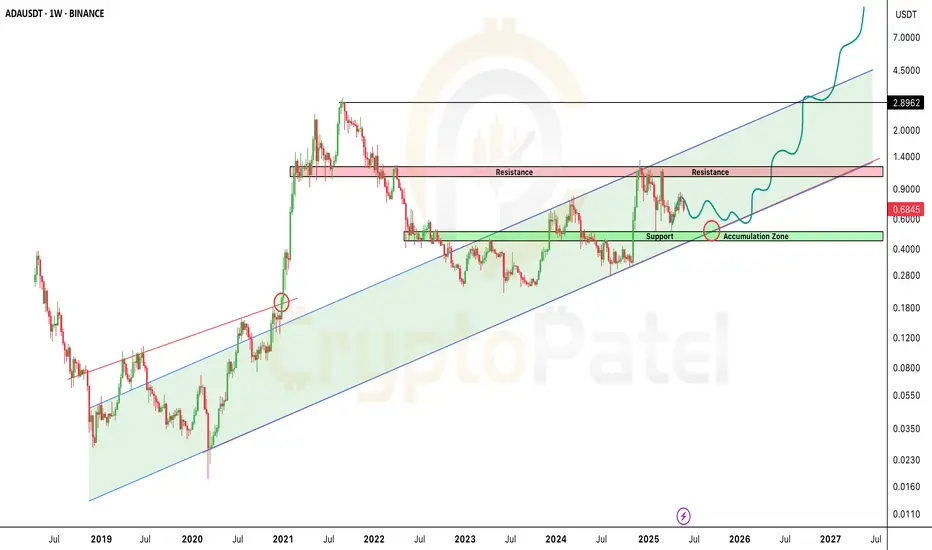
ADA Sitting on Strong Support — Next Big Move Loading?🚨 ADA Sitting on Strong Support — Next Big Move Loading?
Cardano has dropped to around $0.68, but guess what? It's sitting on a major support zone in a long-term bullish channel!
🟩 Accumulation Zone: $0.60–$0.40
This is where smart money enters… historically a STRONG buy zone!
🟥 Next Resistance: $1–$1.20
Break that — and ADA could fly toward $5–$10+ in the coming bull run!
The chart is screaming MEGA RUN ahead — if you're bullish on ADA long-term, this might be your signal.
Not financial advice, but the setup looks Strong.
Is $WLD the Next 10x Altcoin This Bull Run? Is MIL:WLD the Next 10x Altcoin This Bull Run? 🚀
Based on the chart, this looks like a good time to start accumulating.
👉 My zone: $1.21–$1.00
👉 Bull target this cycle: $10
Strong bullish structure above $0.60 — but don’t forget: risk management is key.
#Altcoin #Worldcoin

Bearish Setup Loading on Solana? Bearish Setup Loading on Solana? Watch This Key Level Closely
Solana just retested the breakdown zone after losing key support — currently sitting in a danger zone.
Short Interest Zone: $180 – $190
If this area holds as resistance, we could see another move below $150 soon.
Bearish Setup Invalidation: Break above $200 will flip this bias.
Long-Term View? I’m still super bullish on SOLANA in the bigger picture — my long-term target remains $1000 🚀
Risk Management is Key
Never trade without a STOP LOSS — protect your capital.
This is NOT financial advice — DYOR before investing.
Let the chart guide you, not emotions. Stay sharp.
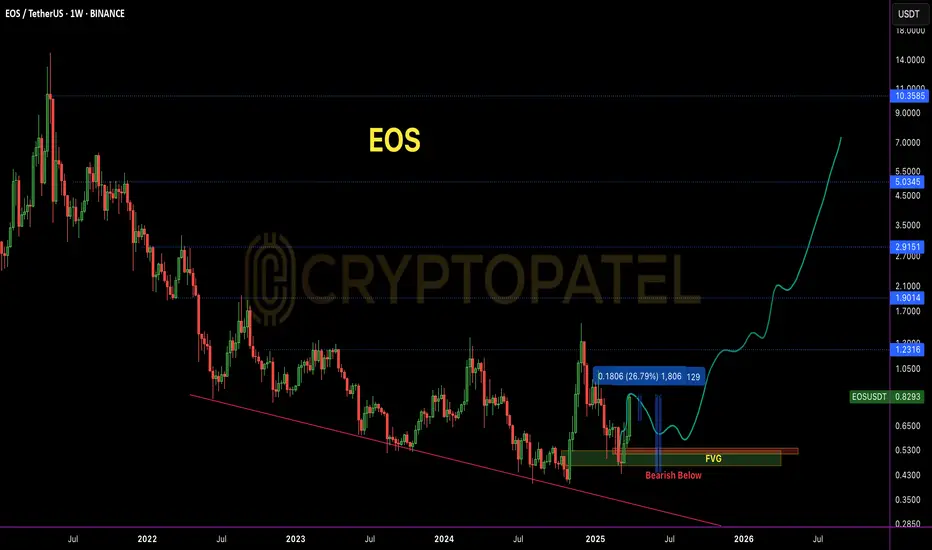
EOS Super bullish toward $10 because WLFI Buying$EOS/USDT Weekly Technical Breakdown
🔰 Price Action:
EOS is currently trading at $0.85, following a rejection from the key weekly resistance zone between $1.24–$1.31. This zone has acted as a historical supply area, and the failure to break above it has triggered a short-term corrective move.
🔰 Bullish Development:
EOS has recently broken out of a multi-year falling wedge pattern, signaling a potential long-term trend reversal. Post-breakout, the asset is now retesting lower levels — a common occurrence before continuation.
🔰 Key Demand Zones:
Primary Accumulation Zone: $0.83–$0.69
Major Weekly Support: $0.47–$0.40
These zones coincide with historical consolidation and low-volume nodes, making them ideal for long-term positioning.
🔰 Institutional Interest:
Trump-backed World Liberty Financial has accumulated 3.64M NYSE:EOS for 3M USDT, with an average entry at $0.824 — aligning perfectly with the current range. This reinforces the strength of the accumulation zone and may signal smart money inflow.
🔰 Upside Resistances to Monitor: $2.87 / $5.03 / $10.57 / ATH: $14.90
NYSE:EOS is showing signs of structural reversal on the HTF. As long as the price holds above the $0.69 base, bullish continuation remains valid. A reclaim and weekly close above $1.31 could trigger the next impulsive leg toward $5+.

Bitcoin At Big Resistance level so What Next?#BTC/USDT Update – Price at Critical Resistance
The chart structure remains unchanged from our previous update.
🔸 After entry, price dipped ~5% below our zone, but has now printed a strong bullish candle, signaling potential upside momentum.
🔸 However, Bitcoin is currently trading at the upper boundary of the ascending channel, acting as resistance.
Key Level to Watch:
If the HTF candle closes above $99,500, it will signal strength, and I’ll consider closing short positions and initiating fresh long setups.
Important Note:
The current pattern resembles a liquidity trap, not a clean bullish continuation. That’s why I remain cautious.
✅ Plan:
🔸 Wait for confirmation > $99,500
🔸 Use tight stop-loss – no blind trades.
Stay sharp, monitor price action closely.

Will Ethereum Break $1875 Resistance this Time?🚨 BREAKOUT WATCH: If Ethereum breaks above the key $1875 resistance, it opens the door for a bullish rally toward $3000 in the coming weeks.
Strong breakout = high momentum setup.

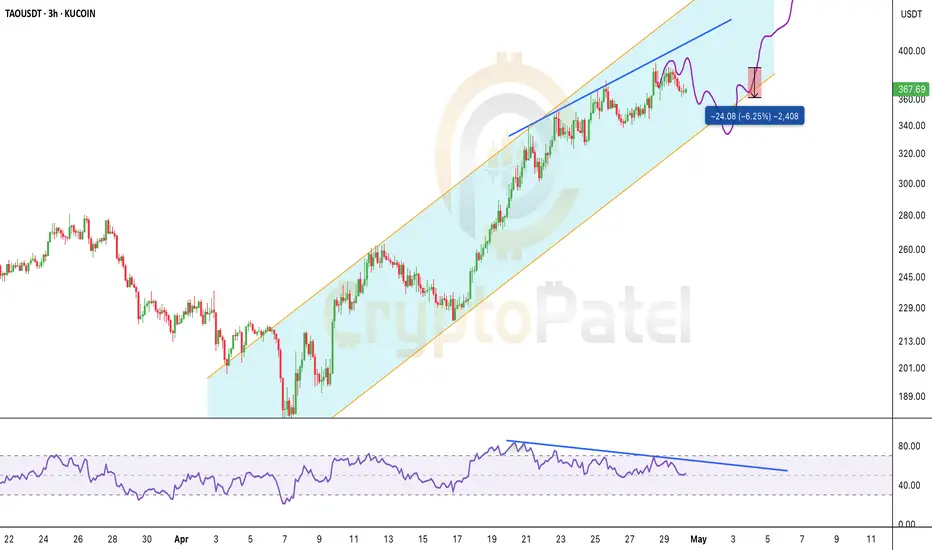
$TAO Update ( 6.20% Down From Our Entry)GETTEX:TAO Update ( 6.20% Down From Our Entry)
Short entry at $385 — triggered perfectly.
Price hit $386 before dropping — now down 6.2% from entry.
▶️ Bearish Divergence still valid
▶️ FVG rejection confirmed
▶️ Holding below $390 = bearish bias intact
Not financial advice — but never be greedy.
✅ Consider partial profits
🔁 Adjust SL to $400 from $410 if managing tighter risk
Let the setup work.
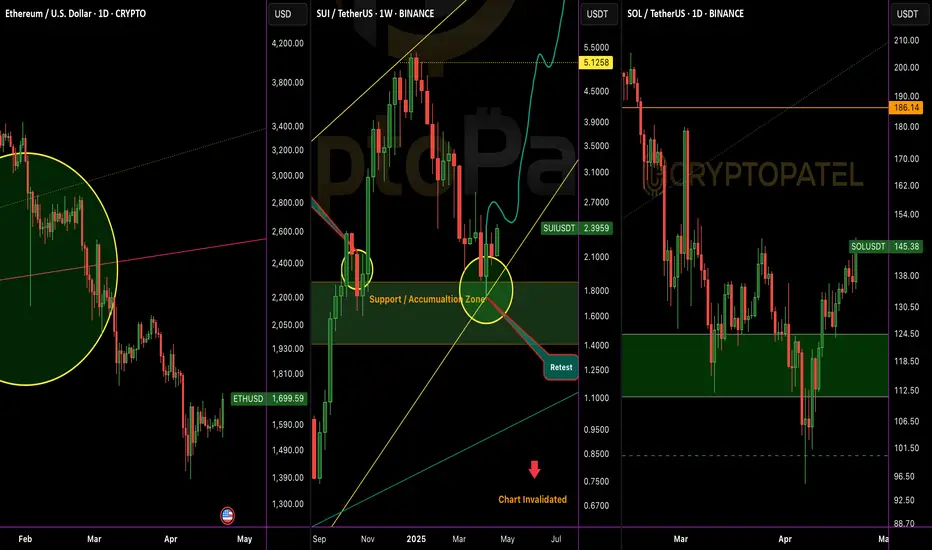
Bitcoin And Altcoins Price Difference🚨 2 months ago, #Bitcoin hit $90K and alts were flying:
CRYPTOCAP:ETH – $2,850
CRYPTOCAP:SUI – $3.50
CRYPTOCAP:SOL – $180
Today, BTC is BACK above $90K… but alts are in the dip!
CRYPTOCAP:ETH – $1,700
CRYPTOCAP:SUI – $2.40
CRYPTOCAP:SOL – $145
Never Forget to Buy at F*** Dip you Planning for Long Run
Bitcoin Dominance Just Hit a 1,505-Day High — Are You Paying Att🚨 Bitcoin dominance has been climbing non-stop for 959 days... and it just broke a 1,505-day high, hitting 64.34%.
That’s not just a stat — that’s a clear signal.
Bitcoin is still the king. 👑
Rejection Level: 66%-72%
Be honest… do you own any?

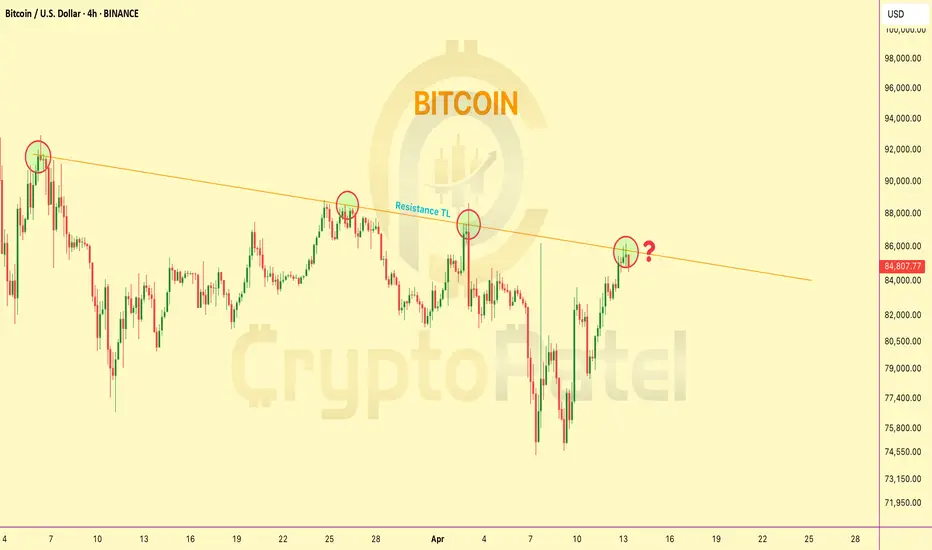
Bitcoin trading at Resistance level so What Next?🚨 Bitcoin 4H Chart Update
CRYPTOCAP:BTC is now trading right at the trendline resistance on the 4H chart
So what’s next?
1️⃣ Breakout and blast toward $100K?
2️⃣ Or another rejection down below $70K?
The decision point is HERE.
This breakout could change the game.
👇 Drop your thoughts –
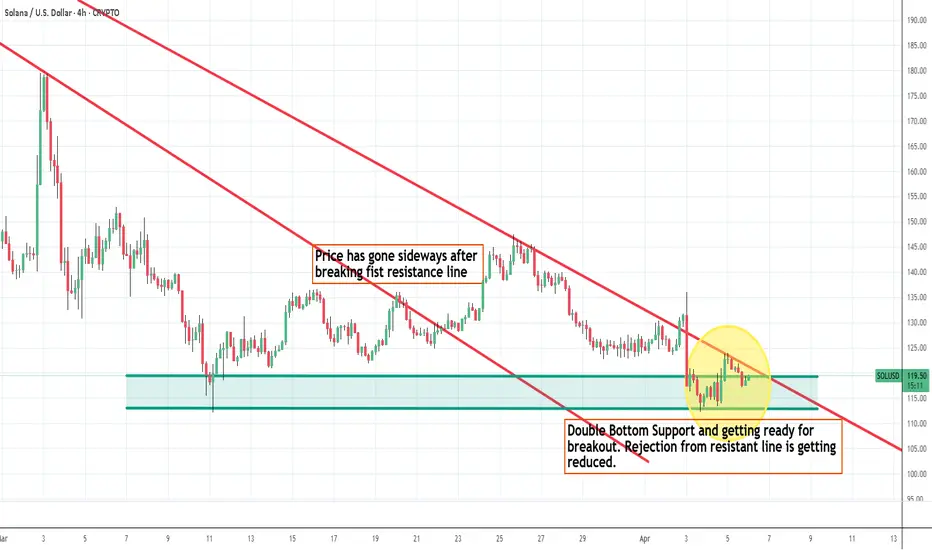
SOL - Getting ready for Big Breakout.Price has taken double bottom support. Price rejection from second resistance line is getting reduced. Any up move from BTC, SOL will give bigger breakout for sure. So trend will follow in whichever side price breaks the lines. I think not much downside can be seen in SOL since it has fallen from 250 levels to this low. SOL is next to BTC and ETH right now and its widely used. Price is at very attractive levels keeping ETF approvals in few weeks or 2 months this year. SOL is also one of the coins for strategic reserve.
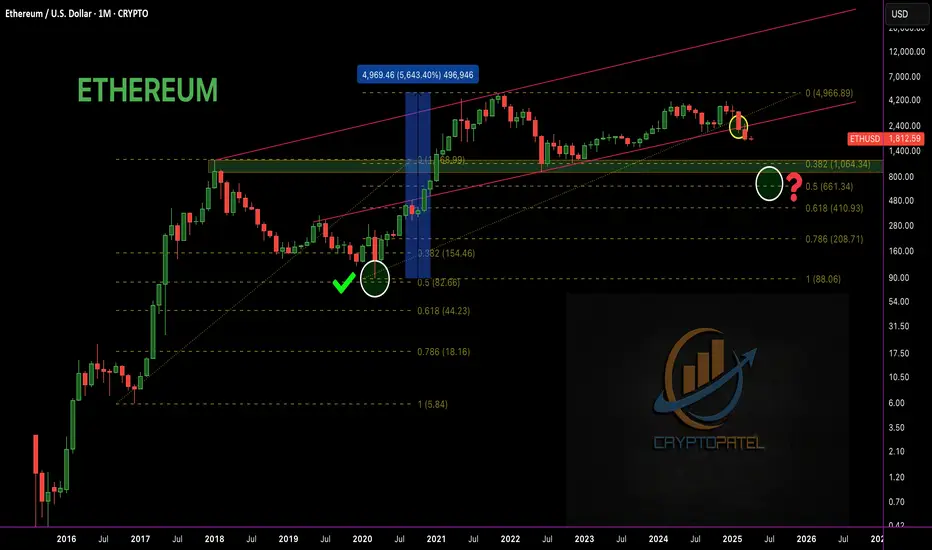
Will $ETH Drop Below $1,000 Before Heading to $7,000+? Will CRYPTOCAP:ETH Drop Below $1,000 Before Heading to $7,000+?
🟣 Historically, #ETH respected the 0.5 Fib retracement in bull markets – In the last bull run, ETH retraced to 0.5 Fib at $89 — then exploded to $4,867
🟣 That’s +56,000% in just 1.5 years!
This cycle, the 0.5 Fib level sits around $661. With the monthly trendline breakdown, the big question is:
Will #Ethereum dip below $1,000 and test $700 before making a new ATH?
If ETH reaches sub-$1,000 zones, I'm personally buying heavy and holding for 1–2 years. No FA – just Fib, patience & conviction.
ETH will reward those who ride the wave, not fear the dip.
Hold strong. Next 1–2 years = massive opportunity.
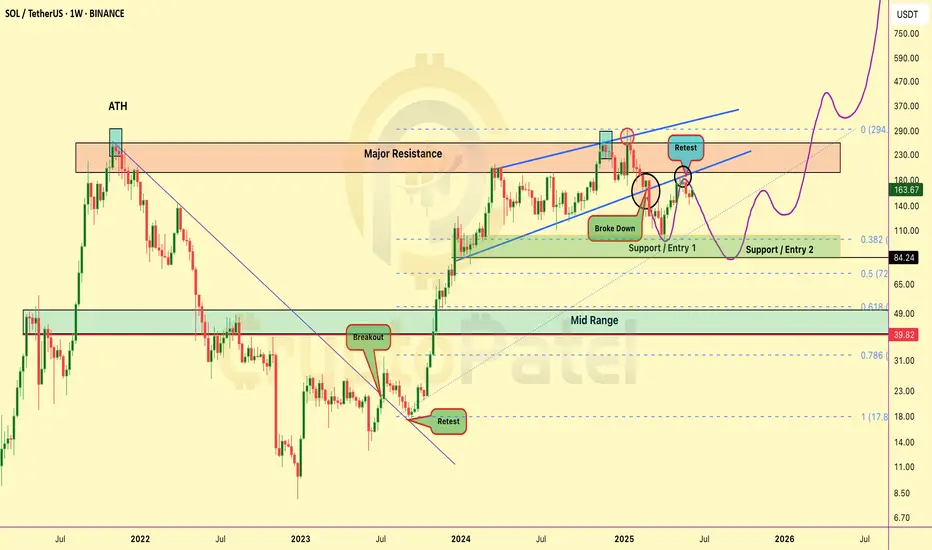
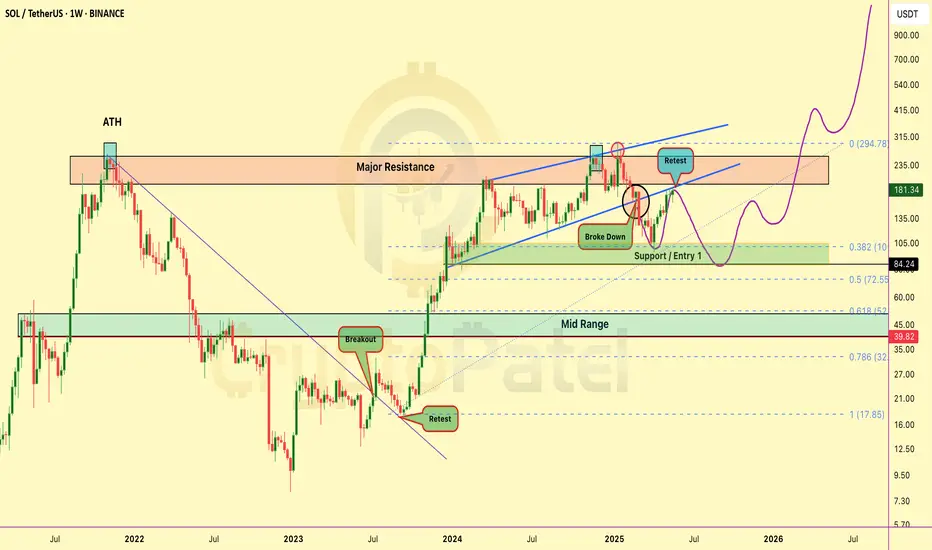
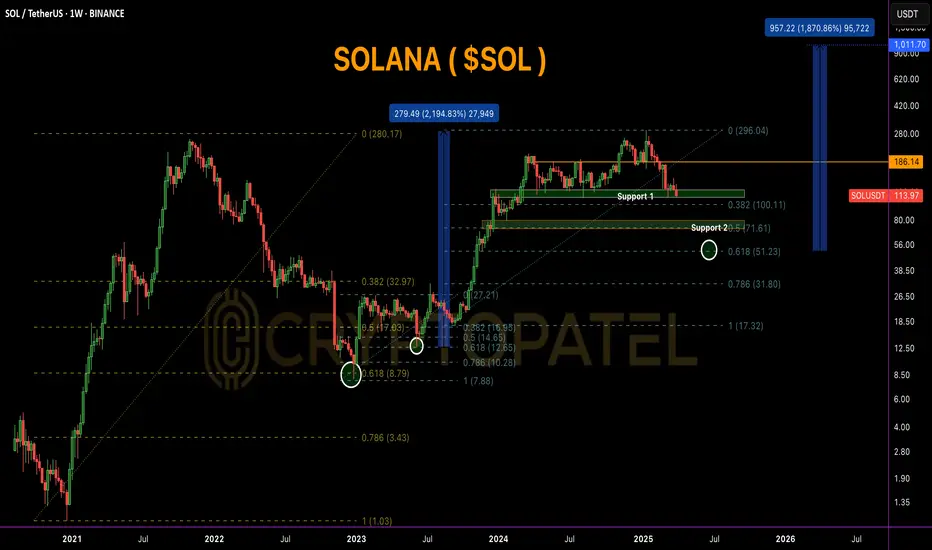
SOLANA Weekly Chart Breakdown–2020 Fractal Signals Massive Bull#SOLANA Weekly Chart Breakdown – 2020 Fractal Signals Massive Rally Ahead!
CRYPTOCAP:SOL is trading at $114.35, currently sitting on a key Fibonacci 0.382 support zone ($100–$115). This area has historically acted as a strong bounce level and is perfect for early accumulation.
If this zone fails, the next major support is the golden pocket ($50–$72) — also marked as Support 2, aligning with the 0.618 Fib retracement.
Historically, this level triggered a 2,100% rally back in 2020-21. If this fractal pattern repeats, we could be looking at a future target near $1,000+.
Breakout level to watch:
▪️ $186 = Bullish confirmation
▪️ $296 = Previous ATH
▪️ $1,011 = Fibonacci-based bull cycle target
Accumulation Plan:
▪️ Zone 1: $100–$115 → Light spot entries
▪️ Zone 2: $50–$72 → Heavy long-term accumulation
✅ Holding above $100 keeps the bullish structure intact.
✅ Break above $186 = start of the next bull wave.
Smart accumulation now can lead to 10x+ returns in the upcoming cycle!
It's All About SO/USDT Overview.
EOS Broke Out After Months — But Is This Just the Beginning?NYSE:EOS Broke Out After Months — But Is This Just the Beginning?
#EOS was once a top-tier asset, trading above $15. However, due to consistent development delays and unmet commitments, the price structure gradually broke down, eventually bottoming near the $0.40 zone — a key historical demand area.
Recent Development: EOS witnessed a sharp rally of +94% in the last month, with a strong +26% daily candle, backed by bullish news:
✅ Formation of Vaulta Banking Advisory Council (includes ex-Binance Canada CEO)
✅ CMO Tristan Dickinson teased a major upcoming announcement
Current Market Structure:
▶️ Price broke out of a long-term accumulation range
▶️ Volume spike confirms genuine interest
▶️ However, one FVG (Fair Value Gap) is still unfilled between $0.60–$0.50 zone on the 4H chart
Ideal Entry Zone (Pullback Play):
▶️ Watch for a retest near $0.60–$0.50
▶️ FVG fill + potential bullish OB (Order Block) = Confluence zone for long setups
🛑 Invalidation / Stop-Loss:
▶️ Breakdown below $0.43 on high volume will invalidate the structure
▶️ SL is wide, but RR (Risk-Reward) setup is favorable for swing traders
Long-Term Upside Targets:
First target: $0.95–$1.10 (range high breakout)
Mid-term target: $1.45+
Long-term potential if fundamentals sustain
⚠️ Manage your position size. NFA | DYOR | Risk Management is Key
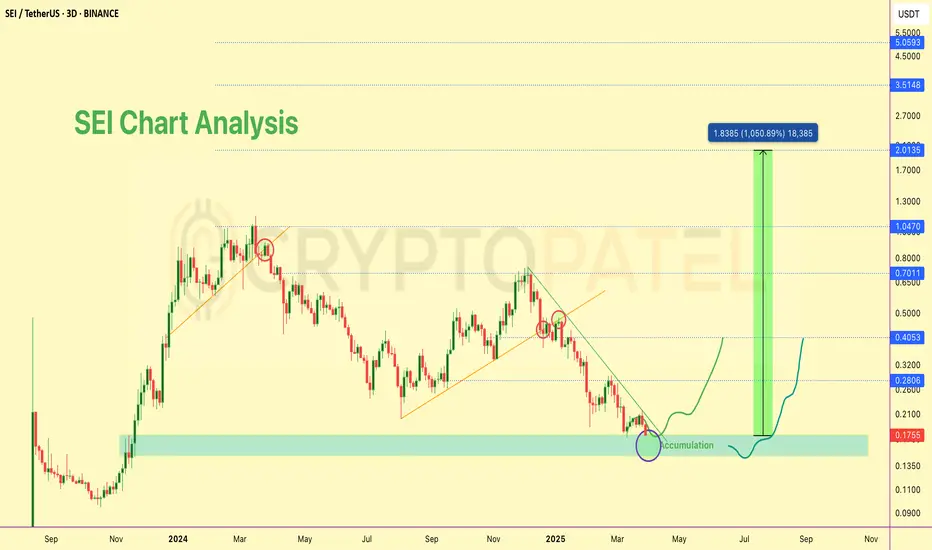
$SEI/USDT- Long-Term Technical Setup and $5 Potential in BullRun📊 $SEI/USDT – Long-Term Technical Setup
NYSE:SEI is holding strong at the $0.18 support zone, showing early signs of accumulation. This level has historically acted as a demand area, making it a key zone to watch.
🔹 Structure: Forming higher lows – bullish trend intact
🔹 Volume: Accumulation pressure building
🔹 Sentiment: Backed by large-scale buyers (e.g., Trump’s World Liberty)
📈 Long-Term Targets:
➡️ $0.45 → $1.00 → $2 / $3 / $5 (macro targets similar to CRYPTOCAP:SUI )
🛑 Invalidation: Close below $0.15
⚠️ Not financial advice. DYOR.
#SEI #CryptoTA #Altcoins #DYOR #TechnicalAnalysis
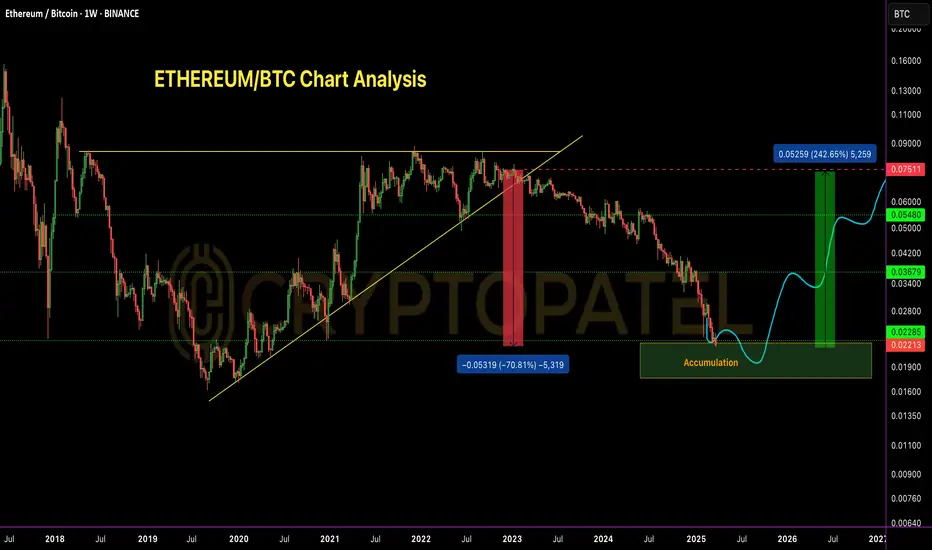
ETH/BTC – 70% Drop Achieved | Perfect Short ExecutionETH/BTC – 70% Drop Achieved | Perfect Short Execution
As projected in my analysis dated 10th Nov 2022, ETH/BTC has completed the anticipated 70% correction from the top.
Short Entry: 0.075 BTC ✅
TP1: 0.055 BTC – ✅
TP2: 0.037 BTC – ✅
TP3: 0.023 BTC – ✅
All targets achieved with precision.
Bearish structure played out as expected.
Current Outlook:
CRYPTOCAP:ETH Price has now entered a historical demand zone, coinciding with major multi-year support levels.
Accumulation Phase Activated –
Starting to scale into long positions from current levels, targeting mid-to-long term reversal setup.
Patience required – this could be the base of the next macro leg up.
Note: NFA & DYOR
#Ethereum
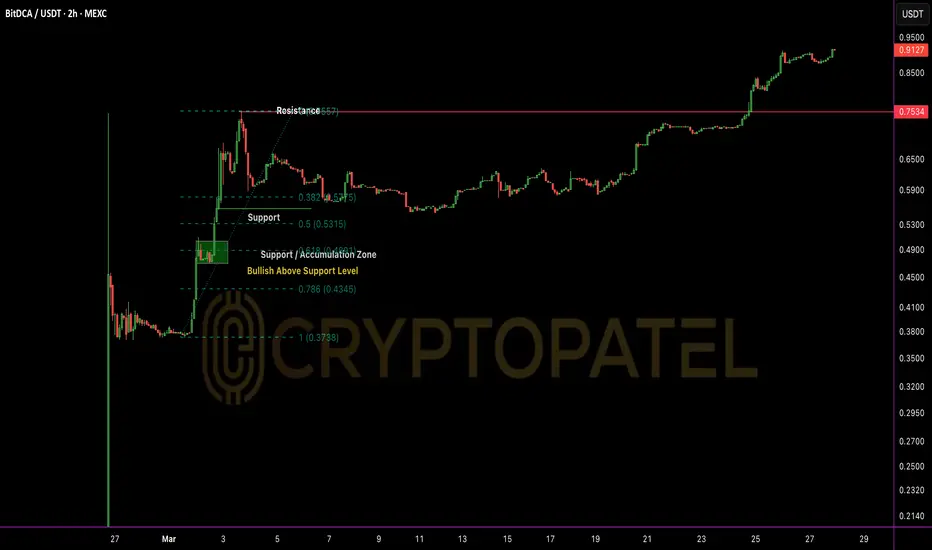
BDCA/USDT 9x up from Listing and 2x form Dip EntryECONOMICS:BDCA Update 🔥
Price just printed a fresh ATH at $0.92, marking a 9x move from pre-listing entry ($0.10) and a 2x rally since our chart-based call at $0.45.
Strong momentum, bullish structure intact.
Expecting further continuation in the short-to-mid term 🚀
#BDCA #CryptoGems #TechnicalAnalysis #Altcoins
NFA & DYOR