Will SOLANA potentila to $1000?Many people are emotionally attached to Solana and the $1,000 target and that may be possible long term.
But markets never move straight up.
Corrections are part of every cycle, and CRYPTOCAP:SOL is currently in a correction phase.
If the $120 support breaks, I’m expecting SOL to drop below $100.
A move under $100 could offer a strong long-term accumulation opportunity.
My accumulation zone: $98 – $50
Long-term outlook: $500 – $1,000
Crypto is highly volatile and risky.
Always DYOR, manage risk properly, and this is not financial advice (NFA).
Solana

$VELO IS ONE OF THE MOST MISPRICED TOKENS IN CRYPTONASDAQ:VELO IS ONE OF THE MOST MISPRICED TOKENS IN CRYPTO
$120M mcap.
BlackRock-backed stablecoin.
1M+ real users.
Backed by CP Group (7-Eleven Thailand) + Stellar.
Down 99.7% from ATH while building real PayFi rails in SE Asia’s $396B Cross-Border Market.
IEO: $0.05 → ATH: $2.07 (40x)
Now at $0.0067 🤯
High inflation? Yes.
High risk? Absolutely.
If RWA + PayFi runs and a Binance Main Listing Lands… This Won’t Stay at $120M.
⚠️ Disclaimer: Not financial advice. Do your own research. Crypto is volatile & You Can Lose Everything.

Solana Technical Reversal: MA Compression Resolves to the UpsideSolana is trading around 126 levels and there is a support which is being respected around 125 levels.
For last few weeks, no considerate candle is there. Only doji are being formed which shows the sideways moment in the charts.
If the market cycle changes, turning bullish, an entry can be made above 127 levels expecting a 10-11% movement in the crypto.
Major trend is bearish, Minor trend sideways.
The major support is around 100-110 level zone and there is not much of fall to capture as it has fallen 50% since Sept 2025.
On the hourly charts, there is a liquidity grab, taking out the bullish positions created on previous occassions.
A moving averages gate is also being created on the hourly charts as all the four EMAs (20, 50, 100 & 200) are moving in small range.
Now as per my view the market is trading in a range and it is also respecting a falling resistance line. A good R:R trade is there on the bullish side.
As per the plan, bullish position can be created in the assest once it crosses 127 levels.
Stop Loss :- 122.5
Target :- 144
R:R = 1:4
Multiple confluence there to enter the trade on the bullish side. Wait for the price action near the levels before entering the trade.

Everyone Asking Why $PIPPIN Did a 30x in a Few Days Is Already LEveryone Asking Why CRYPTOCAP:PIPPIN Did a 30x in a Few Days Is Already Late (Read Before You Trade)
CRYPTOCAP:PIPPIN did not rally 30x because of innovation.
It rallied because market structure allowed it to.
No presale.
No venture capital.
No team allocation.
From Pump.fun to $300M+ market cap in days.
Here is the reality 👇
1️⃣ Separate narrative from mechanics
Markets do not move on stories.
They move on liquidity, positioning, and leverage.
CRYPTOCAP:PIPPIN ’s move was structural, not fundamental.
Anyone telling you otherwise is selling a narrative.
2️⃣ Launch mechanics defined tradability
CRYPTOCAP:PIPPIN launched on Pump.fun via a fair-launch bonding curve.
🔹 No private allocations
🔹 No insider inventory
🔹 Uniform market access
This removed early insider dumping,
It did not remove downside risk.
3️⃣ Tokenomics were neutral, not bullish
▪️ 1B fixed supply
▪️ 100% circulating
▪️ No future unlocks
▪️ No inflation
Clean structure reduces uncertainty.
It does not create demand.
Demand came from positioning, not supply math.
4️⃣ AI credibility acted as a filter, not a driver
Association with BabyAGI’s creator improved narrative quality.
It did not justify valuation.
It lowered skepticism.
Narratives don’t need depth,
They need acceptance and distribution.
5️⃣ Pre-breakout behavior followed a known pattern
Before expansion, we observed:
🔸 Tight consolidation
🔸 Low public attention
🔸 Increasing large-wallet activity
This is where asymmetric risk is formed.
Retail reacts later.
6️⃣ Expansion phase was mechanical
Once volume accelerated:
🔹 Leverage increased
🔹 Shorts were liquidated
🔹 Exchanges amplified liquidity
🔹 Momentum systems engaged
From this point, price discovery becomes reflexive.
7️⃣ Risk concentration is non-trivial
On-chain data indicates significant supply concentration.
A small group of wallets controls a meaningful share of float.
This introduces binary risk:
🔹 Support continuation
🔹 Or rapid distribution
Liquidity disappears faster than it appears.
8️⃣ This asset class demands precision
CRYPTOCAP:PIPPIN is best described as:
👉 A high-beta momentum instrument
👉 A narrative-driven liquidity event
It is not:
❌ A long-term investment vehicle
❌ A fundamentals-based AI allocation
❌ Capital-preservation oriented
Volatility is a feature, not a flaw.
9️⃣ Where participants fail
Most losses occur when traders confuse:
🔹 Narrative with valuation
🔹 Momentum with durability
🔹 Fair launch with safety
Markets punish conceptual errors quickly.
1️⃣0️⃣ Final assessment
CRYPTOCAP:PIPPIN is not a forecast.
It is a case study in modern crypto market behavior.
Success in this market comes from understanding:
👉 Structure
👉 Liquidity
👉 Timing
👉 Risk
Not belief.
This is a high-risk memecoin environment.
Position sizing and discipline are mandatory.
Follow for institutional-grade crypto analysis.
NFA & DYOR

HUMANITY +600% Setup or Full Breakdown?HUMANITY +600% Setup or Full Breakdown?
Trendline confluence + demand reaction
$H Price has tapped a well-respected ascending HTF trendline and printed a support reaction, maintaining bullish market structure.
Structure intact → higher low holding.
Targets: 0.143 → 0.387 (+627%)
Invalidation: Daily close < 0.046
Bias: Bullish while above trendline.
NFA & DYOR

$TWT at a Major Decision Zone | Accumulation or Distribution?CRYPTOCAP:TWT at a Major Decision Zone | Accumulation or Distribution?
CRYPTOCAP:TWT has been range-bound between $0.65 – $1.55 for nearly 3 years, signaling a long-term consolidation. This structure usually precedes a big directional move, the only question is which side breaks first.
Bullish Structure (Accumulation Case)
🔹 Primary accumulation zone: $0.92 – $0.72
🔹 Key condition: Price must hold above $0.70
🔹 If support holds Upside expansion targets: $2 → $5 → $10 (only after confirmed breakout)
Bearish Structure (Distribution Case)
🔹 $0.70 = critical long-term support
🔹 A clean breakdown below $0.70 confirms bearish market structure
🔹 Downside Targets: $0.20 – $0.10 (70–80% potential drawdown)
Key Technical Levels
Strong Resistance: $1.72
Major Support: $0.70
FVG / Demand Zone: $0.23 – $0.17
Technical Conclusion
CRYPTOCAP:TWT is compressing inside a multi-year range. No bias until breakout or breakdown.
Trade only confirmed setups, manage risk tightly, and let price decide the direction.
NFA & DYOR

RENDER will hit $15?CRYPTOCAP:RENDER Technical Update
Price is in a bearish corrective phase and currently reacting at the 0.618 Fib zone ($1.55–$1.25), A key area for potential bullish reversal. Holding this zone increases the probability of a strong upside continuation toward $4.6 / $8 / $13 / $20.
If this support breaks, the next major demand lies at the 0.786 Fib level (~$0.84), considered the optimal accumulation zone before any trend shift.
Key Zones:
0.618 Support: $1.55–$1.25
0.786 Support: $0.84
Targets: $4.6 / $8 / $13 / $20
NFA Always DYOR

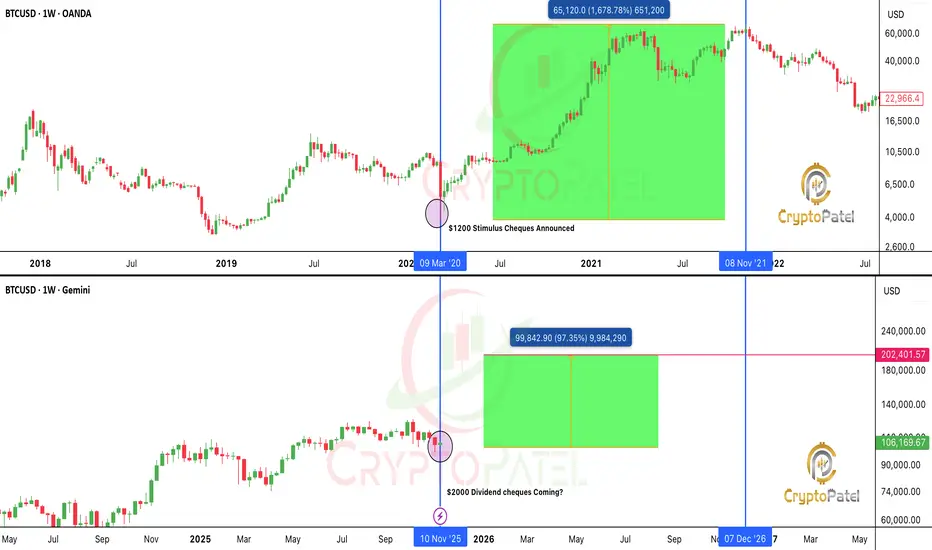
ETH Could Skyrocket to $7.8K After FUSAKA Upgrade: History ShowsCRYPTOCAP:ETH Could Skyrocket to $7.8K After FUSAKA Upgrade – History Shows
The last Ethereum Pectra Upgrade on 7 May 2025 triggered a massive move:
✅ +55% in 35 days
✅ +168% in 109 days
What’s next?
The FUSAKA Upgrade is scheduled for 3 December 2025. If history repeats:
👉 Target 35 days post-upgrade: $4,500 (7 Jan 2026)
👉 Target 109 days post-upgrade: $7,800 (22 Mar 2026)
Note: This is Purely Fractal Analysis Based on Pectra. Always DYOR – Markets can behave differently, and “Sell the News” Scenarios Happen.
Get ready for a potential ETHEREUM rally!
NFA & DYOR

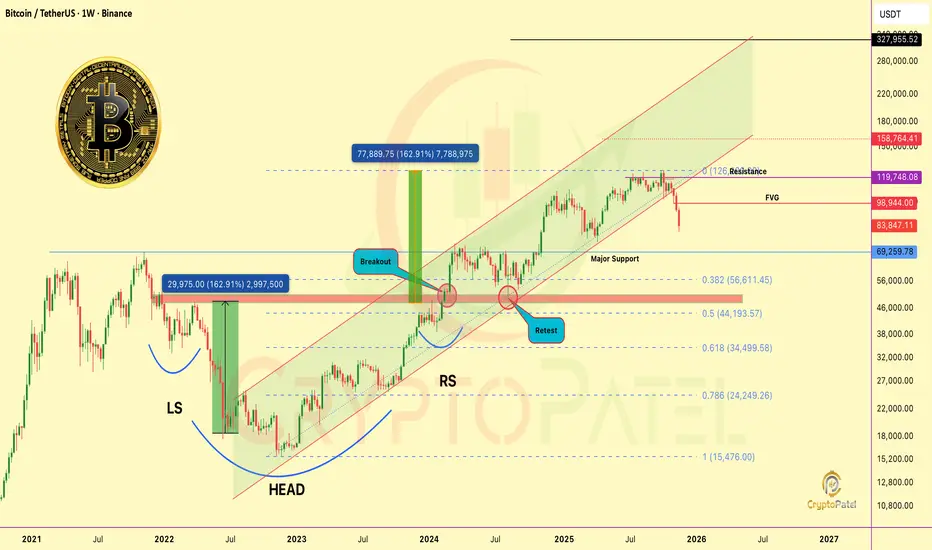
STOP SCROLLING: BITCOIN TECHNICAL ALERT (3-Year Support Break)🚨 STOP SCROLLING: BITCOIN TECHNICAL ALERT (3-Year Support Break) 🚨
Bitcoin has broken a long-term support channel that’s been respected since 2022. That multi-year channel support was around $108,000 and I warned there to protect capital and trade safe.
Result: Breakdown.
✅ BTC dumped over -25%
✅ Now trading near $83,000
Structure Still Bearish
Trend remains bearish unless BTC reclaims the broken channel.
A Relief bounce is still possible toward: $93,000 / $98,000
But treat that as corrective unless structure flips.
Major Support: $69,000 is a critical level, Last bull-run ATH and strong demand zone. Watch it closely.
If This Channel Break Plays Out Fully…
As a Technical Analyst, I can’t sugar-coat the math.
When a multi-year channel breaks, the natural downside targets usually align with major Fibonacci retracement zones:
Deep Retracement Targets (Bear Case)
0.5 Fib: $44,193 (~60% probability)
0.618 Fib: $34,500 (~30% probability)
0.718 Fib: $24,250 (~10% probability)
These aren’t fantasies. They’re standard TA outcomes after this type of structural failure.
Important: This Is Not Panic
I’m not here to spread fear.
I’m here to state what the chart is objectively signaling.
Markets don’t move on hope, They move on structure, liquidity, and trend mechanics.
If price goes into that 0.5–0.718 Fib zone, it would be painful short-term…
but also a once-in-cycle accumulation window for long-term holders.
CryptoPatel Note:
Believe me, I want BTC at $1M+ in the future.
But wanting isn’t analysis.
My job is to map both paths: bullish and bearish, Before they happen.
Save this post. Mark the levels. Trade safe.
Because when a 3-year support breaks, the market doesn’t whisper, it screams.
NFA & DYOR
XVG Was pumped 13000000% in 2015-2017 so what Next?Crypto History Reminder:
SGX:XVG was one of the most explosive rallies of the 2015–2017 cycle, a 13,000,000% (13M%) move in under two years. Despite the noise, it still trades +296,000% above its 2015 baseline.
OGs know the John McAfee era was a major catalyst, but the market is no longer driven by personalities, it’s driven by structure.
Technically:
As long as XVG holds the $0.004 support, trend bias remains bullish on higher-timeframe structure.
Cycles repeat. Narratives change. Price action doesn’t lie.
NFA & DYOR

$BTC STANDING ON ITS LAST SUPPORT: READ THIS BEFORE YOUR TRADEBITCOIN TECH UPDATE — FRESH LEVELS, FRESH PAIN
CRYPTOCAP:BTC just dumped to $80,641, making a new low since 12 April 2025.
That’s almost -30% from my Short + Exit levels.
Those who Rode the Short, Enjoy the profits.
Those who avoided chasing above $120k, capital saved again.
Where We Stand Now
Bitcoin is sitting exactly on the 0.786 Fib ($83,300), the strongest bullish support left on the chart.
This level = Bulls’ last hope.
If daily candle doesn’t close below $83,300, then expect a relief rally into upside inefficiencies:
Upside Targets (If 0.786 Holds)
$88,600 → major unfilled FVG
$93,000 → bearish Order Block (high probability fill)
$98,000 → another upside FVG waiting to be delivered
Watch how price behaves at these levels — next macro move will be decided there.
If 0.786 Fib Breaks…
Be ready.
Next liquidity pools: $73,000 / $66,000
Both zones have massive bullish orderflow waiting.
If 0.786 support holds → BTC still has high probability to push for a new ATH.
Summary:
Trend still bearish, but BTC is now at a critical support.
Hold → relief rallies + possibly new ATH.
Break → $73k–$66k incoming.
Stay sharp. Watch the levels. Trade with intention.
NFA &" DYOR

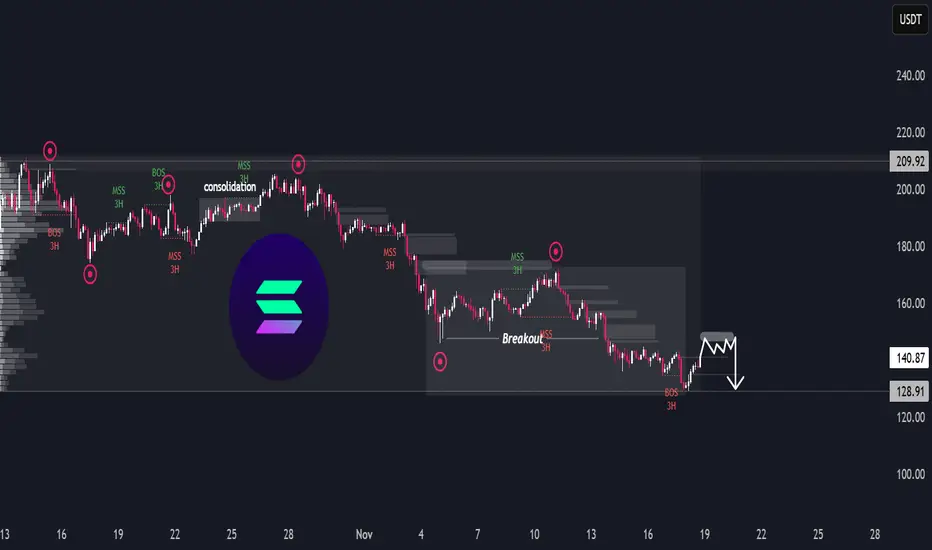
SOL/USDT – Downside LoadingSOL/USDT – Downside Loading
The chart shows a prolonged distribution phase followed by a steady macro decline, with multiple structure breaks confirming a persistent bearish flow. After the earlier consolidation in the upper range, each attempt to reclaim previous highs has been met with a shift in momentum, leading to progressive downside sequences.
The recent breakout from the lower range transitioned into continued weakness, indicating sellers remain in firm control. Despite short-term rebounds, the overall behaviour reflects a market that is unwinding previous demand zones rather than building new ones.
At the current level, SOL is forming a tight corrective pattern, suggesting price is building liquidity before the next directional move. Given the broader trend context, this type of compression typically precedes continuation rather than full reversal. The chart’s projection implies a potential liquidity sweep on the minor rally, followed by renewed downside pressure once short-term buyers are exhausted.
Overall, the environment still favours the bearish continuation scenario unless the market shows a decisive shift in character backed by sustained strength — something not yet present.
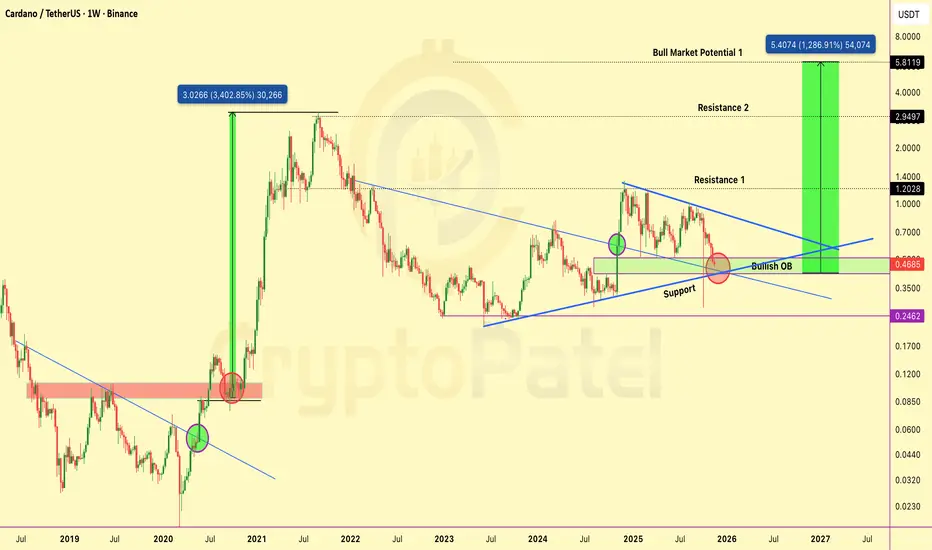
$ADA Retested THE Level That Triggered Its Last Parabolic RunCRYPTOCAP:ADA Just Retested THE Level That Triggered Its Last Parabolic Run: History About to Repeat?
Cardano is again retesting the same multi-year $0.46–$0.35 bullish order block inside the descending wedge that triggered its last explosive cycle. The structure is almost identical, only bigger.
Market Structure:
3+ years of compression tightening toward the apex
Price holding the institutional accumulation zone
Volatility squeeze signaling a high-probability breakout window
Upside Levels: $1.20 → $2.95 → $5.80+
Last time ADA broke this pattern, it didn’t move 30%… it moved 3,000%.
Asymmetric setup. Invalidation below $0.35.
Not financial advice. DYOR.
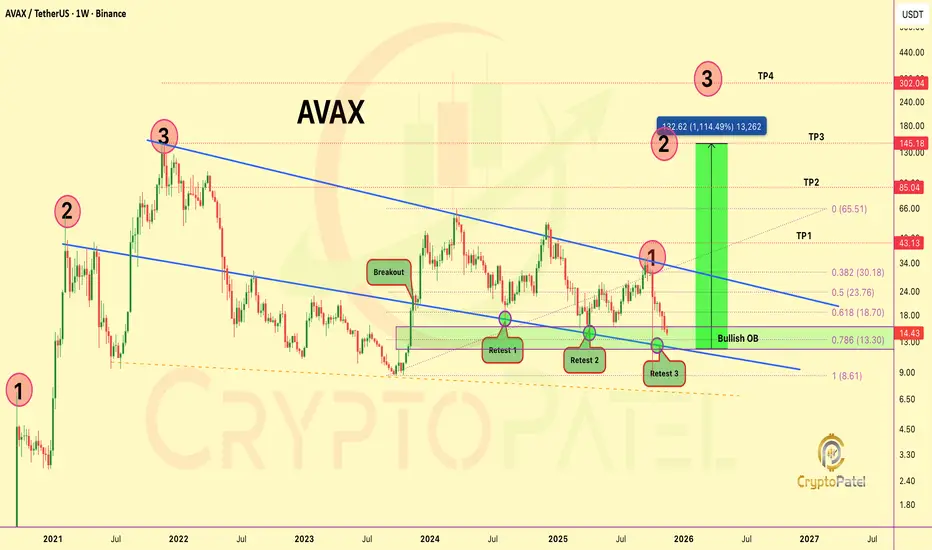
$AVAX IS SITTING ON A MACRO LEVEL YOU CAN’T IGNOREAVAX IS SITTING ON A MACRO LEVEL YOU CAN’T IGNORE
AVAX just Tapped a 4-year Demand Cluster:
Bullish OB + 0.786 Fib + long-term wedge support, the same region that triggered every major reversal since 2021.
This is Retest #3, where high-timeframe structures typically shift from capitulation → accumulation.
Liquidity below the range is cleared. Sellers are exhausted. Volatility is compressed to extremes.
If this Base Holds, the Upside Map is already Defined:
$43 → $85 → $145 → $302 (Full wedge expansion potential: ~1,100%)
This is the kind of level where institutions position quietly while retail exits loudly.
IMO, the Best Long-run Accumulation Range remains $15–$11.
Note: NFa & DYOR
CRYPTO MARKET JUST LOST $1.25 TRILLION🚨 CRYPTO MARKET JUST LOST $1.25 TRILLION: THIS IS NOT NORMAL 🚨
In just 42 days since the Oct 6 top, the market has wiped out a massive -$1.25T, A -28% collapse from the $4.27T peak → $3T zone.
This $3T level is the final line before a full liquidity vacuum.
If it breaks, volatility turns violent. Stay sharp.
NFA & DYOR

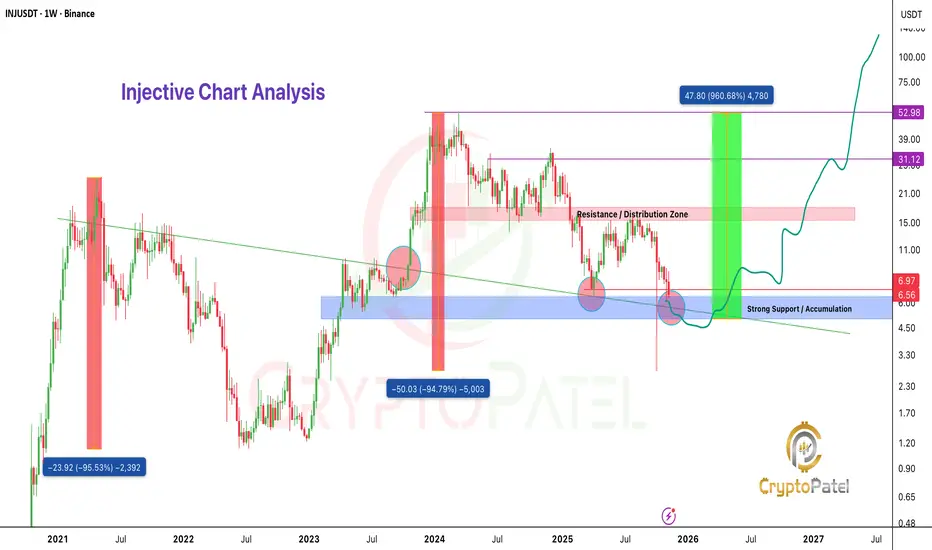
$INJ Is Repeating the 2021 Fractal: The Next 4,000% Move?CRYPTOCAP:INJ Is Repeating the 2021 Fractal: The Next 4,000% Move?
2021 Cycle Pattern:
🔹 Impulse: $0.65 → $25
🔹 Corrective Phase: -95% → $1.12
🔹 Expansion: +4,500% → $53 ATH
2024 Structure Mirrors 2021:
🔹 Impulse: $7 → $53
🔹 Corrective Phase: -94% → $2.74
🔹 Price now sitting inside historical Post-Cycle Reaccumulation Zone.
Accumulation Zone: $6–$4
Upside Targets: $15 / $30 / $50 / $70 (HTF liquidity clusters)
Invalidation: Break of structural low based on individual risk.
If 2021 fractal continues to play out, CRYPTOCAP:INJ is entering its highest-probability expansion window.
NFA & DYOR
#BTC Technical Update: Structure Playing Out With Precision#BTC Technical Update: Structure Playing Out With Precision
CRYPTOCAP:BTC has tapped the $95K zone, completing the corrective leg projected when price was rejecting the $115K–$110K range.
Key downside levels already reached:
➡️ $105K ✔️
➡️ $93K ✔️
As long as price fails to break and close above $107,500, the bearish structure remains intact and the next liquidity target becomes: $73K
A confirmed close above $107.5K invalidates the bearish leg and reopens the path toward a new ATH.
Critical zones to watch:
➡️ 0.5 FIB — structural reaction level
➡️ 0.618 FIB — high-probability reversal pocket
🔻 Bearish below $107.5K
🔺 Bullish above $107.5K
Price is respecting structure with accuracy.
Charts > emotions. Levels > noise.
NFA & DYOR
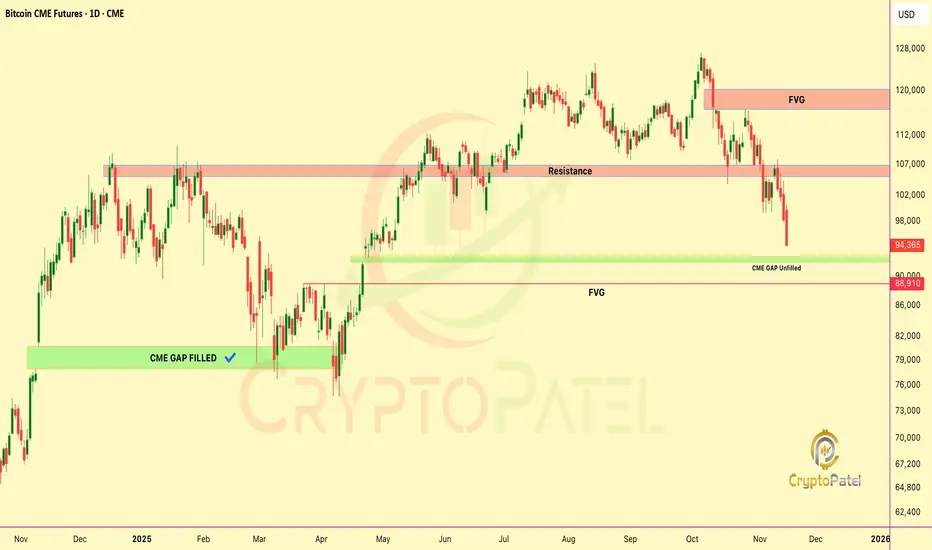
Bitcoin Next move $70k or $120k?CRYPTOCAP:BTC Is About to Bounce From the Level Everyone Is Ignoring
CME Gap 👉 $91,170
FVG below 👉 $89,020
Both zones = liquidity magnets.
No upside CME gaps left… only 1 upside FVG at $120,370
My view:
Fill → Sweep → Strong bounce expected from $89K–$91K range.
Next major draw = $120K FVG.
NFa & DYOR
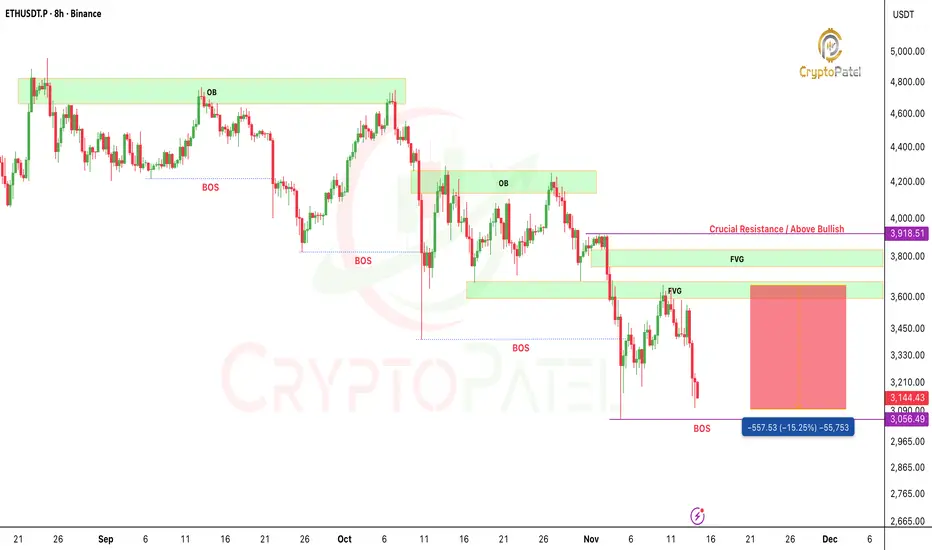
ETHEREUM Bearish Target achieved CRYPTOCAP:ETH has tapped the $3150–$3110 zone, a clean 15% move from our premium setup.
Perfect FVG fill + redistribution structure.
Huge profits for those who executed. Liquidity continues to lead.
NFA & DYOR
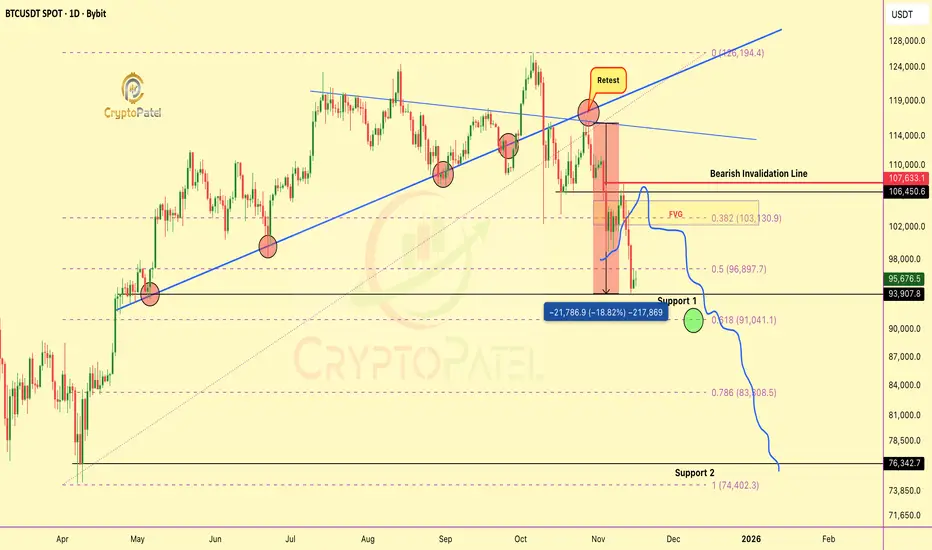
bearish retest I warned on Oct31 played out EXACTLY as projectedThe bearish retest I warned about on Oct 31 played out EXACTLY as projected
I clearly said CRYPTOCAP:BTC would dump again after filling the FVG at $106K–$107K and that’s exactly what happened.
BTC dropped from $107K → $98K (-9%) and from our retest entry, we’re now 15% in profit.
Hope you enjoyed the analysis and booked gains.
Now watch the 0.5–0.618 FIB zone closely.
✔️ If it holds → strong bounce possible
❌ If it fails → BTC could slide below $80K
I’ve been warning about this dump since BTC was above $120K+.
Structure always wins.
NFA & DYOR
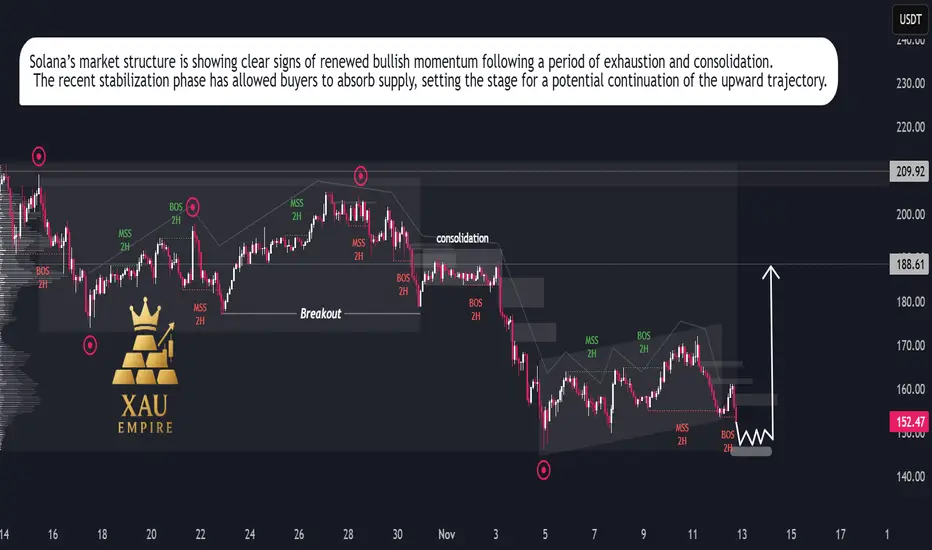
SOL/USDT – Bullish Momentum Rising, Rally Setup in ProgressSolana is showing renewed strength after an extended corrective phase, suggesting that the recent slowdown was a temporary reaccumulation rather than the start of a new downtrend. Price action has begun to stabilize, reflecting growing investor confidence and increasing participation from buyers at discounted levels.
Market flow indicates that selling pressure is fading, while buying volume has started to build up gradually. The recent structure reflects a healthy market rotation, where weaker hands are being replaced by strategic buyers positioning for the next expansion phase.
Momentum appears to be shifting in favor of the bulls, supported by consistent higher reactions after each dip and a clear compression pattern that often precedes strong directional movement. This behavior points toward a potential continuation of the broader uptrend, with expectations for renewed growth as market sentiment strengthens.
Overall, Solana’s current price behavior suggests the market is preparing for another bullish leg. As volatility contracts, the probability of an impulsive upside expansion increases, signaling that the next significant move is likely to unfold in favor of buyers.
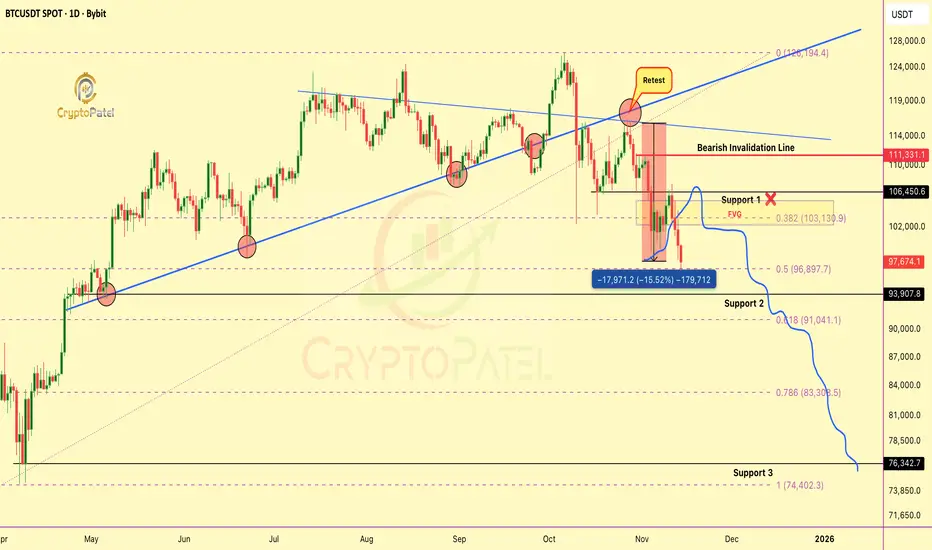
Trump’s $2,000 stimulus = $600B Liquidity: Bitcoin To the Moon?Trump’s $2,000 Stimulus Could Light the Fuse for the Biggest Crypto Rally Ever
This isn’t just another political headline.
If Trump’s plan to send $2,000 stimulus checks funded by tariff dividends actually happens, it could unleash a $600 billion liquidity wave into the economy.
That’s nearly the same scale as the 2020 stimulus, which kicked off one of the most legendary bull runs in history.
🔹 Bitcoin skyrocketed from $3,800 to $69,000
🔹 Ethereum exploded from $90 to $4,800
🔹 Altcoins went absolutely wild, 50x, 100x, even more
But here’s the twist...
This time, the setup is 10x stronger.
In 2020, those checks were about survival, paying rent, buying food, covering bills.
Crypto was new. ETFs didn’t exist. Institutions were on the sidelines.
Now? The game has completely changed.
✅ Crypto is mainstream
✅ Bitcoin ETFs are live
✅ Institutions are ready to buy
✅ Retail access is everywhere
✅ The U.S. economy is growing, not crashing
In 2020, people used stimulus to survive.
In 2025, they’ll use it to invest.
When money flows into a market that’s already primed for risk...
That’s not just bullish, that’s explosive.
The 2020 checks fueled a survival rally.
The 2025 checks could ignite a speculation supercycle.
Imagine $600 billion pouring into a global asset class that’s waiting for liquidity.
Bitcoin. Ethereum. Solana. AI coins. RWA tokens. Meme coins.
History doesn’t repeat but it sure does rhyme.
And this rhyme could make millionaires all over again.
NFA & DYOR
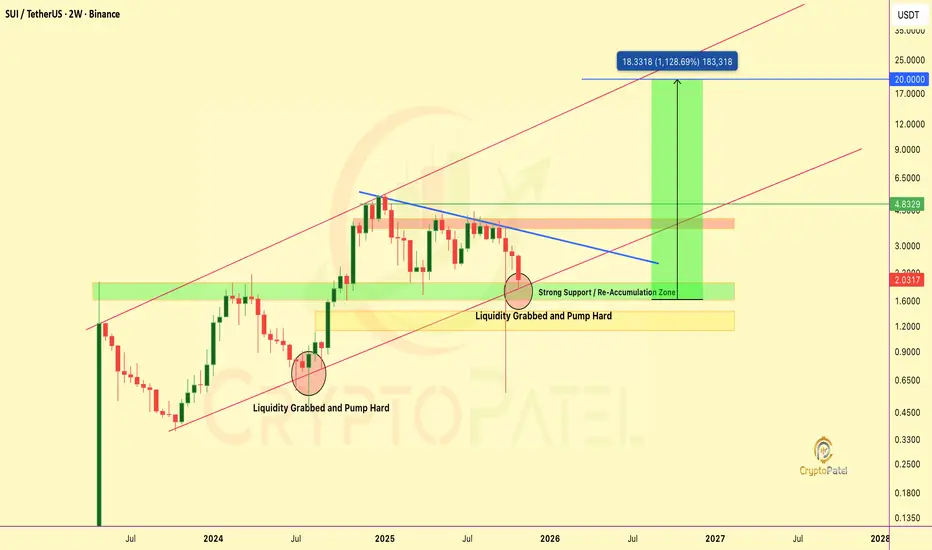
SUI– Breakout Setup Forming, Bulls Eyeing a Move Toward $20SUI/USDT – Breakout Setup Forming, Bulls Eyeing a Move Toward $20
SUI is building a strong re-accumulation base after months of correction. The $1.6–$2 demand zone continues to attract heavy buying interest, the same zone that triggered the last major rally.
Technical Highlights:
✅ Multiple liquidity grabs with strong rebounds
✅ $1.6–$2 zone acting as key accumulation area
✅ Descending trendline compression nearing breakout
✅ Structure remains bullish above $1.6
A confirmed breakout above the descending trendline could launch SUI into a high-momentum phase, targeting higher resistances.
Upside Levels: $4.8 / $10 / $20 – Macro channel target
Accumulation View:
Smart money is active below $2, positioning early before expansion. As long as $1.6 holds, the structure favors a bullish continuation.
High compression. Low noise. When this trendline breaks, volatility will speak loud. NFA & DYOR