Bitcoin Fresh Technical Analysis and Price Prediction AnalysisBTC/USDT – Technical Analysis Update
📊 Current Price: ~$93,000
📈 Recent Move: Strong bounce from $79,000, surging $17,000 in just a few hours.
Key Technical Levels & Market Structure
🔸 Resistance Zone: $95,000 – This level acts as a critical supply zone. A strong rejection here may trigger short-term corrections.
🔸 Breakout Confirmation (BOS - Break of Structure): A decisive close above $99,600 with volume could confirm bullish continuation towards new highs.
🔸 Support & Downside Risk:
If BTC fails to hold above $95,000, a pullback towards $75,000-$70,000 remains a possibility.
EMAs & Trendline Support: Watch for dynamic support from 50 EMA & ascending trendline in case of retracement.
Market Outlook:
- BTC remains in a bullish structure, but volatility is high.
- RSI & Volume Analysis: Overbought conditions on lower timeframes suggest possible consolidation before the next leg up.
⚠️ Risk Management: Always trade with stop-loss and avoid overleveraging in this volatile market.
📡 Stay tuned for real-time insights!
Note: NFA & DYOR
Solana

DOGE/USDT – Prime Accumulation Zone & Bullish OutlookDOGE/USDT – Prime Accumulation Zone & Bullish Outlook 🚀
Current Status : Trading at $0.15-$0.20 support zone, a strong accumulation area. DOGE is currently 64% down from its ATH, presenting an attractive risk-reward setup.
Key Levels:
Support: $0.15 - $0.20 (Accumulation Zone)
Targets: $0.60 / $1.50 / $2 / $2.50
Why Bullish?
Technical Perspective: DOGE is holding key support and could see a breakout on volume expansion.
Catalyst: Elon Musk’s continued backing makes it a strong contender for long-term gains.
Strategy: Any major dip is a buying opportunity for long-term holders. Keep an eye on volume surges and market sentiment!
Note: NFA & DYOR

SOLANA DOWN 57% FROM ATH! 🚨 SOLANA DOWN 57% FROM ATH!
People are panicking! But is this just a dip before CRYPTOCAP:SOL pumps to $500? 🤯
Smart investors buy dips, not fear! 🚀
What do you think? Buy or sell? Comment below! 👇💬

Bitcoin Ready for $69000 ?#Bitcoin followed my chart PERFECTLY! 🚀🎯
I warned you, but some laughed. Who’s laughing now? 😏
From $108K to $79K—NEXT STOP: $75K-$70K (prime accumulation zone!) 🔥
Who’s buying this dip? 🤔👇

SOLANA: Too good to miss!1. 15-20% Risk
2. Price is near it's major support area.
3. EMAs are supporting the bullish view.
✨NOTE: Don't forget to have a look to my earlier Bitcoin post, it was a good one. Even though SL was hit on the 1st entry due to whipsaw, 2nd re-entry was pretty awesome. ⚡
⚠️ Disclaimer: This is NOT a buy/sell recommendation. This post is meant for learning purposes only. Views are personal. Please, do your due diligence before investing.⚠️
💬 What are your thoughts on this share it in the comments below. ✌️
🔥 Happy Trading!✅🚀

ETH/BTC Crashed 70%! Target Achieved! Now Real Bull Market ?ETH/BTC Crashed 70%! Target Achieved! Now It's Time for the REAL Bull Market
◾️ Our Short Entry: 0.075 BTC ✅
◾️ Current Price: 0.02337 BTC ✅
◾️ Total Drop: -70%
◾️ Target Achieved! Now, we are ready for the actual Bull Market!
💰 Accumulation Phase Begins! Time to start positioning for the next big move.
#Crypto #Ethereum #Bitcoin

Ethereum: The Sleeping Giant!It is pretty evident that Ethereum is forming a falling wedge pattern, which mostly breaks to the upside. We are in for a treat!
The breakout could be anytime soon, with TRUMP already taking office and signing crypto orders from DAY 1 !
The Time Is Now. if you are not holding ETH. it's about time!

SOL Eyes 40% Surge: Strong Technical PatternsKey Observations:
1. All-Time High (ATH): Marked at 259.59, indicating a significant resistance level.
2. Bullish Patterns Identified:
• Higher High (HH) and Higher Low (HL) Structure:
• This indicates a bullish market structure where price is making consistent higher highs and higher lows.
• Fair Value Gap (FVG):
• An imbalance or inefficiency in the price that could act as a magnet for price to revisit before continuation.
• Bullish Triangle Pattern:
• Suggests price consolidation within narrowing ranges, typically preceding a breakout to the upside.
3. Support Zone:
• A green box around the 175–180 region shows a strong demand zone where price could reverse upward if retested.
Projection:
• A breakout is expected either towards the resistance zone (near ATH) or lower if the support fails.
Actionable Steps:
• For Bulls:
• Watch for bullish confirmation (e.g., bullish engulfing candles) near the FVG/support zone.
• Target the ATH as the first major resistance, with a potential breakout higher.
• For Bears:
• Monitor price action for a break below 175. This could signal bearish momentum towards lower price targets.
DISCLAIMER- THIS IS FOR EDUCATIONAL PURPOSES ONLY, PLEASE DO YOUR RESEARCH BEFORE INVESTING

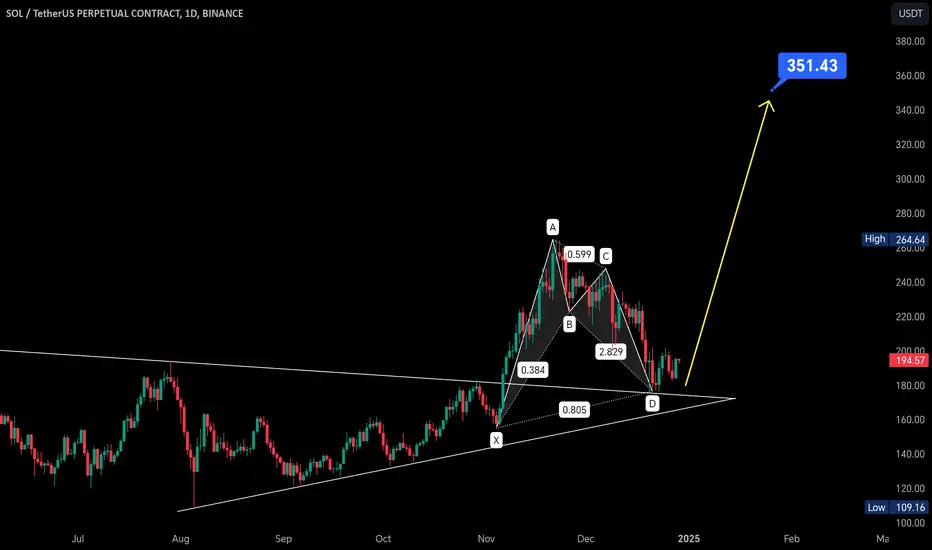
$SOL Price Analysis: $350 and $400 Targets in SightSolana has clearly retested the previous symmetrical triangle and has now formed a bullish Shark pattern. Additionally, it is consistently forming higher lows on the daily chart. The RSI has also bounced back from the oversold region, further supporting a bullish outlook. All these indicators suggest that Solana is poised for a strong upward movement. My price targets for this potential rally are $350 and $400.
SOL Crash Soon..SOL High Selling Pressure ...Wait For PullBack For Short..
When should we go long on Sol? It is likely to experience a pullback in Sol when BTC reaches 3355. Once BTC starts to drop from 3355, Sol will move upwards. This will be a chance to open a short position, and for those who have long positions, it will be time to close them.

FTM Now 5x up from our Entry so What Next?#Fantom Update: 5x Gains & Bull Market Potential 🚀
🔹 Entry: $0.30 - $0.25 ✅
🔹 CMP: $1.27 (peaked at $1.39)
🔹 Gain So Far: ~5x
🔹 Target Price: $5 (Expecting strong potential in the current bull market!)
Key Strategy:
🔹 Partially Book Profits: Always remember to take some profits along the way. This ensures you’ll never regret it if the market shifts suddenly.
🔹 Ride the Remaining Profits: Let the rest of your holdings ride toward higher targets, capitalizing on the full potential of the bull market.
Stay Smart, Stay Profitable!

Cautious on Bitcoin: Expecting a Sharp Pullback Before LongCautious on Bitcoin: Expecting a Sharp Pullback Before Long
1⃣ Current Stance: Cautious on long positions in CRYPTOCAP:BTC due to the shallow nature of Wave 2 and the potential for an expanding diagonal (ED) formation.
2⃣ Entry Plan: Planning to open a long position in #Bitcoin but waiting for a clearer correction.
3⃣ Market Expectation: Expecting a sharp pullback, though the exact dip is uncertain at this stage.
4⃣ Next Steps: Will provide further updates after additional confirmations are observed.
Note: This is NFA. Always DYOR before making any trades.

Ripple hit 7 Years High: 500% up from Our EntryRipple hit 7 Years High:
🔹 XRP/USDT 500% up from our Initial Entry.
🔹 I am booking 80% Profit here for safe Zone.
🔹 500% Profit not bad guys.
I told you to buy at $0.40-$0.50 and ignore the negative news and drama (thanks, Gary Gensler). Hope you held strong because now you're in huge profits. 🎉
❤️ $3 is just around the corner.
What’s Next?
▪️ I’m expecting $3-$5 in this bull run for XRP.
▪️ Don’t repeat last bull run’s mistake: Holding blindly and not selling when it’s time.
My Suggestion:
▪️ Take out your initial investment and 70% Profit and hold the rest as profit.
▪️ While $10 is possible, it’s unlikely this bull market.
Smart moves can turn this into a big win.
Of corse NFA & DYOR

ATOM Breakout Alert: Will We See $50 Soon?ATOM Breakout Alert: Will We See $50 Soon?
ATOM has pumped hard, breaking resistance levels! Here's the key outlook:
Best Entry Zone: $7.5–$6.5 is the ideal range for re-entry on pullbacks.
Support: Holding above $6 keeps the bullish trend intact. Below $6, bullish momentum weakens.
Major Resistance: $14.50 (Breakout here could spark a rally!)
Targets: $14.50 → $32.50 → $44.50
Last Bull Run Reminder:
We exited around $25-$30, saving gains before an 80% drop. Stay smart this cycle too.

$THE Update – Get Ready for the Next Big Move TSX:THE Update – Get Ready for the Next Big Move 👇
The #THENA Price is currently trading at a strong support zone around $2.90 (highlighted in the green box).
Here's what to watch:
🔻 Downside: If the price breaks below $2.90, we might see a 30%-50% retracement.
🔺 Upside: A breakout above $3.15 could trigger a 50%-100% upward rally.
Tip: Don’t trade blindly—wait for clear confirmations before taking any positions.
Stay tuned for updates.

#Fantom Accumulation Zone Revealed: Why I’m Expecting 12x Return#Fantom Accumulation Zone Revealed: Why I’m Expecting 12x Returns 🔥
FTM/USDT Bullish Chart Analysis: Accumulation Zone & Targets
#FTM Bullish Analysis
🔹 UPCOM:FTM has been on an uptrend for the past 7-10 days, currently up 60% in the last 10 days.
🔹 I’m waiting for a dip to buy in my accumulation zone, which is the green box between $0.78 - $0.60.
▪️ Targets: $2/$3.3/$5/$6/$10
▪️ Stop Loss: $0.53
I’m expecting 12x gains from my accumulation zone. I'm super bullish on FTM/USDT in this bull run.
📢 Reminder:
▪️ Don’t go all-in on a single coin. Diversify your investments.
▪️ This is not financial advice. Always DYOR before investing in any cryptocurrency!
What’s your take on FTM? Let’s discuss! 👇

NEON/USDT Bullish Chart AnalysisNEON/USDT Trading Update
NEON is holding above the support level, and with some volume coming in, I’m expecting an upward move from here.
Important Levels:
▪️ Buy Zone: $0.36 - $0.33 (Green Box)
▪️ Targets: $0.48/$0.71/$0.98/$1.56/$2.05
▪️ Stop Loss: $0.3250
If the price stays above $0.3250, we might see a strong rally. Don’t forget to manage your risk-reward ratio.
Let’s watch how it goes. Stay updated.

IOST/USDT Technical Analysis: Breakout Setup with Massive PotentIOST/USDT Technical Analysis: Breakout Setup with Massive Potential
$IOST is currently testing a critical HTF resistance zone near the $0.0068 level. A confirmed breakout above this red box resistance could initiate a significant rally, with potential upside between 500%-1000% in the ongoing bull market.
Key Levels to Watch:
Resistance: $0.0068 (Breakout Zone)
Accumulation Zone: $0.0070 - $0.0065
Stop Loss: $0.0042
Potential Bull Market Targets:
1️⃣ $0.012
2️⃣ $0.021
3️⃣ $0.040
4️⃣ $0.072
Technical Outlook:
The chart structure suggests strong bullish momentum if resistance is broken.
Historical price patterns and the current market environment favor a high probability of a parabolic move.
Keep an eye on the breakout confirmation above $0.0068 for the next leg up. 🚀

BLZ/USDT Accumulating Strongly: Targets Point to $1🔰 BLZ/USDT Accumulating Strongly: Targets Point to $1 🚀
GETTEX:BLZ Technical Analysis
▪️ Trend: Strong bullish momentum observed over the last two weeks, with consistent higher lows indicating accumulation.
▪️ Historical Context: Previous breakout patterns on BLZ/USDT have delivered a minimum of 500% gains. Current price structure aligns with historical breakout behavior.
🔰 Key Levels:
▪️ Accumulation Zone: $0.10–$0.125 (Strong support area with high buy interest).
▪️ Resistance Zone: $0.28 (Immediate resistance).
▪️ Targets: $0.28 / $0.48 / $0.70 / $1 (Fibonacci-based extensions and historical price targets).
▪️ Stop Loss: Below $0.10 (Breakdown invalidates bullish setup).
🔰 Outlook: A confirmed breakout above resistance can signal continuation toward the $1 mark, supported by volume and price action. Failure to hold accumulation levels could shift the bias to neutral.
🔰 Disclaimer: This is a technical observation. Perform due diligence before making any trading decisions.

Solana Next Target is 202, 251 USD.. Triangle Pattern BreakoutSolana has formed a Triangle Pattern and Breakout, with the Next Target at 202 USD and a Final Target of 251 USD. Take advantage of this Great Opportunity to Earn a Potential Profit of +45% ROI and Overall +74%ROI. Check my Previous Analysis below, already reached the first Target at 174 USD with (+20% Profit).
This is a Long-Term Analysis, it's important to follow Trend continuation techniques.
I want to help People Make Profit all over the World.
PREVIOUS ANALYSIS : Before & After,

SOL Cup and Handle breakout Solana has completed and broken out of a cup and handle pattern, with a target around $400.
If ETF approvals come through, CRYPTOCAP:SOL could surge to even higher levels.
Keep an eye on volume and momentum

FIL/USDT 5000% Potential ?FIL/USDT Analysis Update
LSE:FIL currently around $4.27, and it’s holding steady at strong support – could see a big move in the days ahead!
Entry Zone: $4 - $3
Targets: $10 / $25 / $48 / $70
Exciting times for #FIL
Let’s watch how this unfolds.

Will Bitcoin History Repeat after US Election ?#Bitcoin and US Elections: History Repeats?
Looking back at the last two US elections, we’ve seen a strong Bitcoin bull market follow each one. Let’s take a look:
📅 2016 US Election (November):
➡️ Before the election, BTC was at $700
➡️ Within a year, BTC soared to $19,900
📅 2020 US Election (November):
➡️Pre-election price: $13,600
➡️ Just a year later, BTC hit an all-time high of $69,000!
Now, with the US election tomorrow, is this another CRYPTOCAP:BTC buying opportunity based on past trends?
🔮 My Prediction: By next year, November 2025, #BTC could reach $150,000 - $180,000.
Let’s see if history repeats!
#Crypto #BullMarket
