Solar Industry (NSE) at Make-or-Break Level ? NSE:SOLARINDS
Summary:
📈 Key Levels
Breakout: Cleared resistance at 13,300 with a strong bullish engulfing candle.
Pattern: Bullish Flag & Pole (pole size: 3,777.80 points) suggests a measured move target of 17,077.80.
Trend: Price above 20/50/200 EMAs on daily, weekly, and monthly timeframes.
Risk: Overbought RSI (14) and bearish MACD crossover hint at potential consolidation.
________________________________________________________________________________
Technical Analysis
1. Bullish Structure Confirmed 🚩
Bullish Engulfing Candle : Broke above critical resistance at 13,300 (near all-time high), signaling bullish momentum.
Flag & Pole Pattern: The "pole" (3,777.80-point rally) followed by a consolidation "flag" suggests a potential repeat of the uptrend post-breakout. Historical symmetry often sees targets equal to pole size.
2. Trend Alignment ✅
Multi-Timeframe Support: Price trades above all key EMAs (20, 50, 200) on daily, weekly, and monthly charts, confirming a strong bullish bias.
3. Divergence Alert ⚠️
RSI (14): Overbought at 70+ warns of short-term exhaustion.
MACD: Bearish crossover on daily charts adds caution.
---------------------------------------------------------------------------------------------------------------------
Trade Setup
Entry Zone:
Aggressive: Current price (above 13,300).
Conservative: Retest of 13,300 as support.
Targets: 17,077.80 (measured move: 13,300 + 3,777.80).
Stop Loss: 13,000 (low of the bullish engulfing candle) or 12,640 (prior swing low) for wider risk tolerance.
Risk Management
Position Size: Risk ≤1-2% of capital.
Confirmation: Watch for a daily close below 13,000 to invalidate the setup.
Conclusion
The Solar Industry (NSE) is at a critical juncture: bullish momentum clashes with overbought signals. While the Flag & Pole pattern and EMA alignment favor a rally to 17,077+, traders must respect the RSI/MACD divergence. A decisive hold above 13,300 could fuel the next leg up, but a breakdown below 13,000 may trigger profit-taking.
Key Action: Monitor price action above 13,300 for confirmation!
📊 Chart Attached | Like/Follow for updates!
Disclaimer: This is not financial advice. Always conduct your own analysis.
#NSE #SolarStocks #TechnicalAnalysis #BreakoutAlert
SOLARINDS

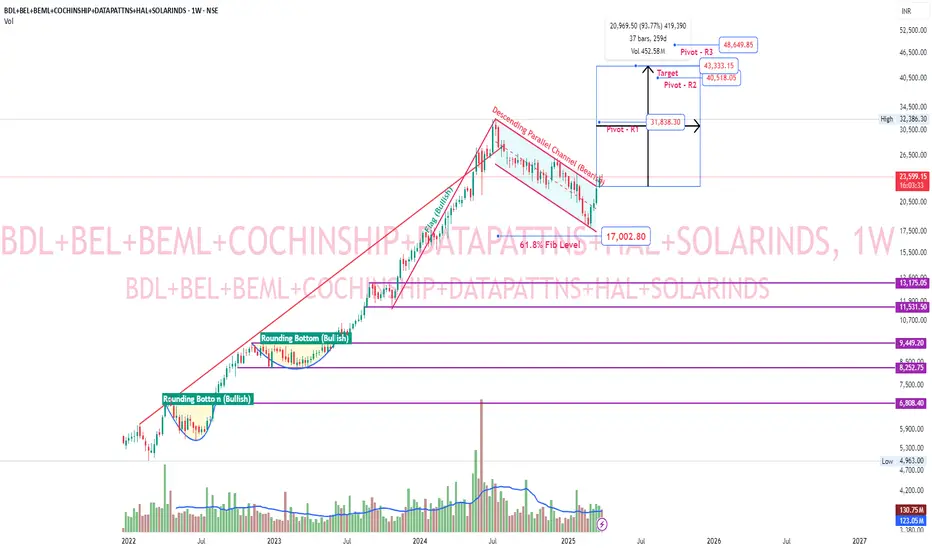
Aerospace & Defence bullish flag breakoutCreated custom index with following scrips. BDL, BEL, BEML, COCHINSHIP, DATAPATTNS, HAL, SOLARINDS. These are some major aerospace-defence companies. This custom index gave a bullish flag breakout. Huge upside potential based on flag pole as target. Pivot R1 itself has approximately 34.5% upside potential.
Solar Industries India - Breakout Setup, Move is ON...#SOLARINDS trading above Resistance of 10654
Next Resistance is at 13361
Support is at 8047
Here are previous charts:
Chart is self explanatory. Levels of breakout, possible up-moves (where stock may find resistances) and support (close below which, setup will be invalidated) are clearly defined.
Disclaimer: This is for demonstration and educational purpose only. This is not buying or selling recommendations. I am not SEBI registered. Please consult your financial advisor before taking any trade.

Solar Industries India - Breakout Setup, Move is ON...#SOLARINDS trading above Resistance of 8047
Next Resistance is at 10654
Support is at 6292
Here are previous charts:
Chart is self explanatory. Levels of breakout, possible up-moves (where stock may find resistances) and support (close below which, setup will be invalidated) are clearly defined.
Disclaimer: This is for demonstration and educational purpose only. This is not buying or selling recommendations. I am not SEBI registered. Please consult your financial advisor before taking any trade.

#ENPHstrong support level , HORIZONTAL
need to hold for upmove
98 above can go up
100/105/109/114 can test soon

SOLARINDS | Swing Trade📊 DETAILS
Sector: Commodity Chemicals
Mkt Cap: 71,511 cr
Solar Industries is one of the worlds leading manufactures bulk explosives, packaged explosives and initiating systems, which find applications in the mining, infrastructure and construction industries.
SIL also ventured into the defense segment in 2010 and diversified into manufacturing of propellants for missiles and rockets, warheads and warhead explosives.
TTM PE : 88.64 (High PE)
Sector PE : 104.91
Beta : 0.33
📚 INSIGHTS
Strong Performer
Stock with consistent financial performance, quality management, and strong technical momentum indicating good investor enthusiasm. Currently valued at Good to expensive valuation
5.22% away from 52 week high
Outperformer - Solar Industries India up by 12.74% v/s NIFTY 50 up by 2.72% in last 1 month
📈 FINANCIALS
Piotroski Score of 8/9 indicates Strong Financials
Disclaimer: This analysis is for educational purposes only, and I'm not a SEBI registered analyst.
If you found this analysis helpful, I encourage you to like and share it. Your observations and comments are also welcomed below. Your support, likes, follows, and comments motivate me to consistently share valuable insights with you.
🔍 More Analysis & Trade Setups 🔍
For more technical analysis and trade setups, make sure to follow me on TradingView: www.tradingview.com

Solar Industries India - Long Setup, Move is ON...#SOLARINDS trading above Resistance of 6292
Next Resistance is at 8047
Support is at 4683
Here are previous charts:
Chart is self explanatory. Levels of breakout, possible up-moves (where stock may find resistances) and support (close below which, setup will be invalidated) are clearly defined.
Disclaimer: This is for demonstration and educational purpose only. This is not buying or selling recommendations. I am not SEBI registered. Please consult your financial advisor before taking any trade.

SOLARINDS - Bullish Consolidation with VolumesNSE: SOLARINDS is closing with a bullish consolidation candle supported with volumes.
Today's volumes and candlestick formation indicates strong demand and stock should move to previous swing highs in the coming days.
The stock has been moving along the horizontal support for the past few days which is indicating demand.
One can look for a 10% to 15% gain on deployed capital in this swing trade.
The view is to be discarded in the event of the stock breaking previous swing low.
#NSEindia #Trading #StockMarketindia #Tradingview #SwingTrade

SOLARINDS | Swing Trade📊 DETAILS
Sector: Commodity Chemicals
Mkt Cap: 62,218 cr
Solar Industries is one of the worlds leading manufactures bulk explosives, packaged explosives and initiating systems, which find applications in the mining, infrastructure and construction industries.
SIL also ventured into the defense segment in 2010 and diversified into manufacturing of propellants for missiles and rockets, warheads and warhead explosives.
TTM PE : 76.98 (High PE)
Sector PE : 137.26
Beta : 0.27
📚 INSIGHTS
Strong Performer
Stock with consistent financial performance, quality management, and strong technical momentum indicating good investor enthusiasm. Currently valued at Good to expensive valuation
12.27% away from 52 week high
Outperformer - Solar Industries India up by 9.06% v/s NIFTY 50 up by 3.12% in last 1 month
📈 FINANCIALS
Piotroski Score of 8/9 indicates Strong Financials
Disclaimer: This analysis is for educational purposes only, and I'm not a SEBI registered analyst.
If you found this analysis helpful, I encourage you to like and share it. Your observations and comments are also welcomed below. Your support, likes, follows, and comments motivate me to consistently share valuable insights with you.
🔍 More Analysis & Trade Setups 🔍
For more technical analysis and trade setups, make sure to follow me on TradingView: www.tradingview.com

Trade-32/100-SOLARIN-R:R Experiment-BuyBuying SOLARIND in DAILY positional trade
Good structure making HH-HL.


SOLARINDS #Watchlist
#SOLARINDS (D):-CMP 3140 Looks Good Above 3200 For More Upsides :)
#Disclaimer:-View shared is for educational purposes only. Conduct your due diligence before making any trading or investment decisions.
#StockToWatch

Symmetric triangle breakout SOLARINDS Symmetric triangle breakout in solar industries.
Today Important Supply Zone (2940-2970) as well as Major resistance broken with good candle and volume.
For further upside rally, stock has to close above 3000 with good candle and Volume.
Stock has a potential to reach 3500 level.
Previous supply zone should act as support now. Idea SL -2800 and for risk averse can keep 2870 as SL.
This is just a view not a recommendation to trade. Do your own analysis before taking any trade.
NSE:SOLARINDS

SOLARINDS
NSE:SOLARINDS
One Can Go long with a Strict SL below the Trendline or Swing Low of Daily Candle.
Close should be good, and Clean.
R:R ratio should be 1 :2 .
Disclaimer : You are responsible for your Profits and loss, Shared for Educational purpose

SOLARINDS LongNSE:SOLARINDS is trading in a channel. Buying with small SL when the price rises up and is near channel low.
Buy NSE:SOLARINDS Above: 2420
SL: 2180
Target: 2660
Disclaimer: For learning purpose only. I am not a SEBI registered analyst and not responsible for your profit or loss. Please consult your financial advisor before trading.

Solar Industries BreakoutSolar industries looks very bullish and one can go long here by keeping a stop loss of Rs.2850

Strong Breakout in Strong Stock !!!!Yes, Solar industries is really a strong stocks which is out performing the
markets.
It is showing a range breakout with positive MACD crossover and
rising RSI which is a positive signal.

SOLAR INDUSTRIES - Swing TradeSOLAR INDUSTRIES - Swing Trade
Breaking out with good volumes after taking support from important demand zone.
Wait for entry and hold for targets ;)
A good RR ratio trade.

Target 2 (51%) achieved in Solar Industries. Target 3 is ON...This is follow-up on Solar Industries India. Can check link to related ideas.
Target 2 achieved. More than 51%. Target 3 is ON.
Chart is self explanatory. Entry, Targets and Trailing Stop Loss are mentioned on the chart.
Disclaimer: This is for demonstration and educational purpose only. This is not buying or selling recommendations. I am not SEBI registered. Please consult your financial advisor before taking any trade.

Target 3 (89%) achieved in Solar Industries. Target 4 is ON...This is follow-up on Solar Industries India. Can check link to related ideas.
Target 3 achieved. More than 89%. Target 4 is ON.
Chart is self explanatory. Entry, Targets and Trailing Stop Loss are mentioned on the chart.
Disclaimer: This is for demonstration and educational purpose only. This is not buying or selling recommendations. I am not SEBI registered. Please consult your financial advisor before taking any trade.

SOLARINDS - Double Bottom Setup - LongDouble bottom Setup on top of weekly congestion spotted near 52 week High.

SOLAR INDUSTRIES......rally expectedThe stock is in gradual uptrend. Once it crosses the level of 2600 a rally is expected. See chart for targets

Breakout in Solar Industries India...Chart is self explanatory. Entry, Targets and Stop Loss are mentioned on the chart.
Disclaimer: This is for demonstration and educational purpose only. This is not buying or selling recommendations. I am not SEBI registered. Please consult your financial advisor before taking any trade.
