Breakout Play: Demand Zone Reversal with High R:R TargetOverview :
This idea focuses on a breakout trade for Solana (SOLUSD), leveraging recent price action and volume signals at a key demand zone. The setup is designed for a high risk-to-reward ratio based on technical structure and confirmation tools.
Trade Setup & Logic:
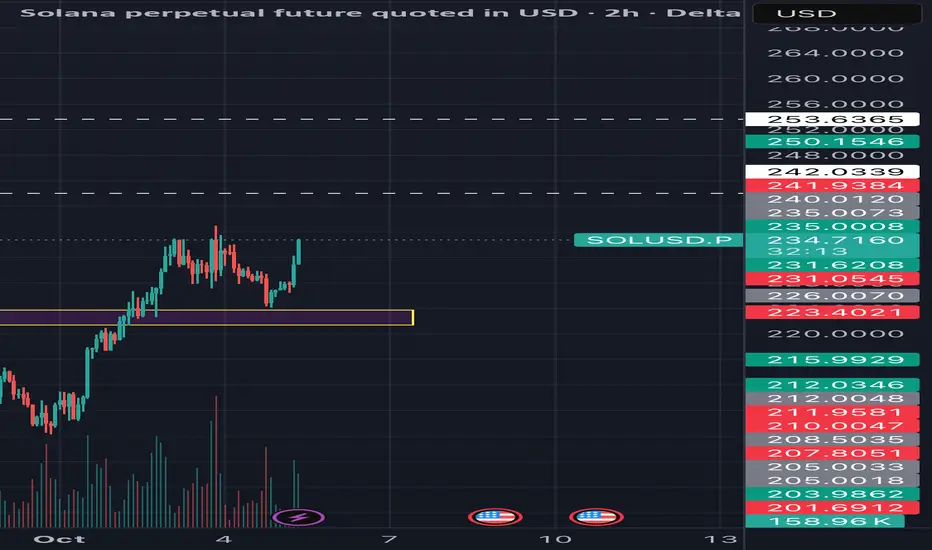
• Entry: Price retraced to retest the 225–230 support zone, which previously acted as resistance and now converts to demand. Entry is triggered by a strong bullish candle closing above 231.5 with an uptick in volume, confirming renewed buyer interest.
• Stop Loss: Placed below 225, the lower bound of the highlighted demand area, to minimize risk if support fails immediately.
• Targets:
Target 1: 241 (first major supply zone and prior swing high).
Target 2: 253.70(multi-week trend resistance, aligns with fib extension and liquidity clusters).
• Risk-Reward: A minimum R:R of 1:2 is targeted. Stop loss is tightly managed once price moves in favor, with trailing stop as price approaches Target 1.
Technical Factors:
• Support/Resistance: The purple highlighted zone shows a confluence of prior reversal points and volume spikes, indicating strong institutional activity.
• Structure Confirmation: Entry is only valid upon a clear bullish reversal signal above the support zone and confirmation of above-average volume.
• Market Context: Recent downtrend is breaking, with higher lows and higher highs. Supply absorption observed at the retest supports the bullish thesis.
Trading Plan:
• Wait for price to close above 231.5 with volume confirmation before entering.
• Adjust stop loss to breakeven after Target 1.
• Take partial profits at Target 1, let remainder ride up to Target 2.
Final Notes:
Discipline and patience are essential—trade only on confirmation to avoid false breakouts. Self-research is recommended, and risk should always be managed per personal capital allocation protocols
Disclaimer: This is a technical analysis idea, not financial advice. Please perform your own due diligence before trading.
Solusdlong
MY ANALYSIS IS HITTING THE TARGET! WHAT A CATCHING VIEW!🎯🔥 MY ANALYSIS IS HITTING THE TARGET! WHAT A CATCHING VIEW! 🔥🎯
✨📈 Everything is playing out as I expected – let’s keep riding this wave! 🌊💹
🚀 SOL/USDT Analysis Update 🚀
📅 Date: June 11, 2025
📊 Timeframe: 4H
✅ Key Zones & Levels:
🟢 Support Level Zone: 144.00 – 147.24
🔴 Resistance Level Zone: 184.00 – 187.99
⚠️ Mini Support/Resistance: Around 160.00
🎯 Current Price Action:
The price has respected my previously marked Support Zone (🟢), resulting in a strong rebound. After forming a bottom at the support level (marked with green arrows), SOL/USDT is now on an impressive upward move.
🟡 The current upward momentum is targeting the Resistance Level Zone near 187.99.
💡 Expected Movement:
If the price approaches the Resistance Zone (🔴), a reversal may occur, creating a potential short-term sell opportunity. Conversely, if it breaks above, we might see further bullish momentum.
🟦 Potential Path:
🔁 Expect a retest of the resistance zone → Possible rejection → Revisit the mini support (~160.00) before a decisive move either back to support or a breakout above 187.99.
💪 Key Takeaways:
Support Zone held strongly, confirming my analysis.
Mini Support/Resistance acts as a pivot for short-term reactions.
Watch closely as the price nears the Resistance Zone – this will be a key area for possible reversals or breakouts.
🔥 Let’s keep an eye on the next moves! Your feedback and thoughts are always welcome. Happy trading! 💪📈

SOL/USDT 4H Chart Analysis📊 SOL/USDT 4H Chart Analysis
🟢 Key Zones:
🔴 Resistance Level Zone:
Marked at approximately 185–188 USDT
Multiple rejections in this area (red arrows 📉), confirming it as a significant supply zone.
🟩 Support Level Zone:
Found around 140–147 USDT
Price has previously bounced off this zone (green arrows 📈), indicating strong demand.
⚖️ Mini Levels:
🟡 Mini Support/Resistance:
Around 157 USDT, previously acted as both support and resistance (yellow box).
Price reacts to this zone during its downtrend and uptrend, highlighting its significance.
🔮 Current Price Action:
The price is currently at 153.36 USDT.
The recent low was just above 140 USDT, confirming a higher low formation.
A small pullback is visible after testing the support zone.
📝 Trade Outlook & Scenarios:
🔵 Bullish Scenario (Main Bias):
If the price maintains above the support zone (140–147 USDT) and breaks the mini resistance (~157 USDT):
Possible continuation towards the resistance zone (185–188 USDT).
Target 🎯 at 187.99 USDT (highlighted in the yellow zone).
🔴 Bearish Scenario:
If the price breaks below the 140 USDT support:
Downward continuation to 132 USDT or lower, as shown in the chart (red zone).
🔧 Risk Management:
🛑 Stop Loss:
Conservative traders: below 140 USDT (red zone 🚨).
Aggressive traders: below the last swing low (~144 USDT).
💡 Professional Takeaway:
✅ Support and resistance zones are well-defined.
✅ Current bounce from support zone suggests a possible reversal.
✅ A break and close above the mini-resistance at 157 USDT would confirm strength.
✅ Risk management and patience are key for this potential upside move.
