SOLUSDT is for sell side in short termSOLUSDT if closed below 185.35 then only we can plan for sell side up to 182.35. We can book some qty at 184.35 as TGT 1 . After hitting TGT 1 we can trail SL to 185 and wait for 182.35
Solusdtsignal

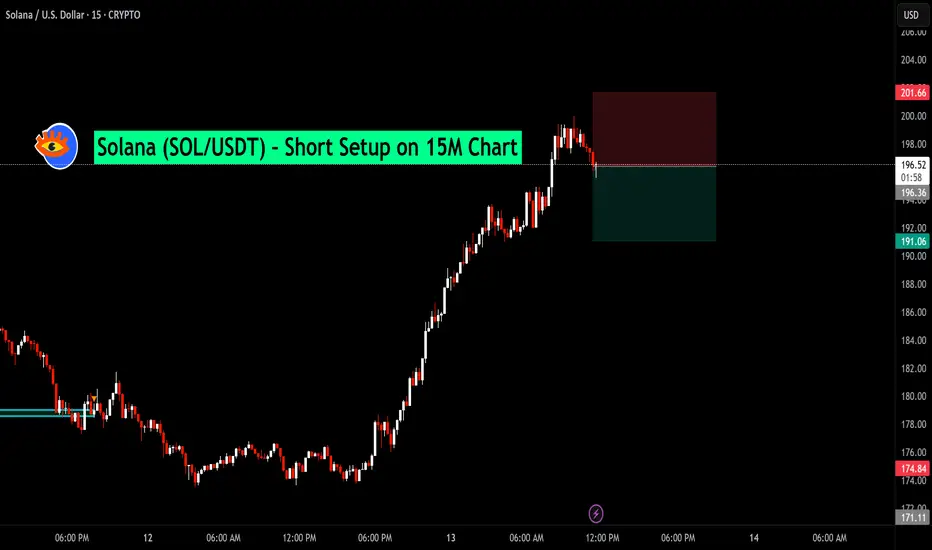
Solana (SOL/USDT) – Short Setup on 15M ChartAfter an extended bullish run, Solana is showing early signs of exhaustion near the $196–$197 zone. Price has failed to sustain above recent highs, forming a potential short-term reversal pattern.
📉 Trade Idea:
Entry: $196.40
Stop Loss: $201.66 (Above recent swing high)
Target: $191.06 (Support zone from prior consolidation)
This setup aims to capture a pullback move following a strong rally, with a favorable risk-to-reward ratio.
SOL/USDT 1H Chart Analysis – Bullish Reversal Targeting Resistan🚀 SOL/USDT 1H Chart Analysis – Bullish Reversal Targeting Resistance Zone 🎯
📊 Pair: SOL/USDT
🕐 Timeframe: 1H
📈 Platform: Binance
🔍 Technical Overview:
🔵 Support Zone (145.00 – 147.50 USDT)
Price has bounced multiple times from this strong demand zone marked in light blue.
Recent price action shows buyers defending this level aggressively — potential accumulation area. ✅
🔴 Resistance Zone (159.50 – 162.00 USDT)
Marked in red, this zone has historically rejected price twice (confirmed by red & yellow arrows).
Currently, the market is expected to retest this supply area once again. ⚠️
📈 Bullish Pathway:
Current structure suggests a reversal from support, aiming for:
TP1: $150.46
TP2: $154.31
TP3 / Final Target: $160.89 (within resistance)
🔄 Trend Structure:
Price is forming higher lows, hinting at early reversal stages.
Break above $150.46 would confirm bullish momentum. 🟢
🧠 Conclusion:
SOL/USDT is setting up for a bullish reversal from a strong support zone, with targets aligned toward previous resistance. Traders should monitor the reaction at $150.46 and $154.31 — a clean break may propel price to $160.89.
📌 Watch for:
Confirmation candle at support zone
Break and retest patterns on intraday resistance levels
📉 Support: 145.00 – 147.50
📈 Resistance: 159.50 – 162.00
🎯 Bullish Targets: 150.46 → 154.31 → 160.89
🔔 Stay updated, manage risk, and trade wisely! 💹📈

MY ANALYSIS IS HITTING THE TARGET! WHAT A CATCHING VIEW!🎯🔥 MY ANALYSIS IS HITTING THE TARGET! WHAT A CATCHING VIEW! 🔥🎯
✨📈 Everything is playing out as I expected – let’s keep riding this wave! 🌊💹
🚀 SOL/USDT Analysis Update 🚀
📅 Date: June 11, 2025
📊 Timeframe: 4H
✅ Key Zones & Levels:
🟢 Support Level Zone: 144.00 – 147.24
🔴 Resistance Level Zone: 184.00 – 187.99
⚠️ Mini Support/Resistance: Around 160.00
🎯 Current Price Action:
The price has respected my previously marked Support Zone (🟢), resulting in a strong rebound. After forming a bottom at the support level (marked with green arrows), SOL/USDT is now on an impressive upward move.
🟡 The current upward momentum is targeting the Resistance Level Zone near 187.99.
💡 Expected Movement:
If the price approaches the Resistance Zone (🔴), a reversal may occur, creating a potential short-term sell opportunity. Conversely, if it breaks above, we might see further bullish momentum.
🟦 Potential Path:
🔁 Expect a retest of the resistance zone → Possible rejection → Revisit the mini support (~160.00) before a decisive move either back to support or a breakout above 187.99.
💪 Key Takeaways:
Support Zone held strongly, confirming my analysis.
Mini Support/Resistance acts as a pivot for short-term reactions.
Watch closely as the price nears the Resistance Zone – this will be a key area for possible reversals or breakouts.
🔥 Let’s keep an eye on the next moves! Your feedback and thoughts are always welcome. Happy trading! 💪📈

SOL/USDT 4H Chart Analysis📊 SOL/USDT 4H Chart Analysis
🟢 Key Zones:
🔴 Resistance Level Zone:
Marked at approximately 185–188 USDT
Multiple rejections in this area (red arrows 📉), confirming it as a significant supply zone.
🟩 Support Level Zone:
Found around 140–147 USDT
Price has previously bounced off this zone (green arrows 📈), indicating strong demand.
⚖️ Mini Levels:
🟡 Mini Support/Resistance:
Around 157 USDT, previously acted as both support and resistance (yellow box).
Price reacts to this zone during its downtrend and uptrend, highlighting its significance.
🔮 Current Price Action:
The price is currently at 153.36 USDT.
The recent low was just above 140 USDT, confirming a higher low formation.
A small pullback is visible after testing the support zone.
📝 Trade Outlook & Scenarios:
🔵 Bullish Scenario (Main Bias):
If the price maintains above the support zone (140–147 USDT) and breaks the mini resistance (~157 USDT):
Possible continuation towards the resistance zone (185–188 USDT).
Target 🎯 at 187.99 USDT (highlighted in the yellow zone).
🔴 Bearish Scenario:
If the price breaks below the 140 USDT support:
Downward continuation to 132 USDT or lower, as shown in the chart (red zone).
🔧 Risk Management:
🛑 Stop Loss:
Conservative traders: below 140 USDT (red zone 🚨).
Aggressive traders: below the last swing low (~144 USDT).
💡 Professional Takeaway:
✅ Support and resistance zones are well-defined.
✅ Current bounce from support zone suggests a possible reversal.
✅ A break and close above the mini-resistance at 157 USDT would confirm strength.
✅ Risk management and patience are key for this potential upside move.

SOLUSDT - PRE BREAKOUT CONSOLIDATION - BREAKOUT ON THE HORIZON?Symbol - SOLUSDT
CMP - 134.70
SOLUSDT recently exhibited a false breakdown near the lower boundary of its established range. The market responded positively, with price action recovering and consolidating just below a key resistance level.
Bitcoin is also undergoing a consolidation phase. While both Bitcoin and SOL display similar movement patterns, Bitcoin has recently shown stronger correlation with equity markets and appears to be taking the lead.
Currently, SOLUSDT is consolidating below a significant resistance zone around 134.00-136.00, The initial test of this level could result in a minor pullback - potentially toward the 0.5 Fib retracement or continued consolidation near resistance. However, a confirmed breakout followed by sustained price action above this consolidation range would be a constructive signal, indicating potential for further upward movement. It is important to note that a broader trend reversal is not yet in play, the focus remains on short-term price targets at 140, 147, and 152.
Key Resistance levels: 147, 152
Key Support levels: 129, 123, 111
The overall macro trend remains bearish. Locally, the market is neutral, with price moving sideways within a defined range. The recent false breakdown beneath support may indicate a liquidity grab, suggesting the potential for price to move toward upper resistance zones between 147 and 152 in the short term.

Solana Next Target is 202, 251 USD.. Triangle Pattern BreakoutSolana has formed a Triangle Pattern and Breakout, with the Next Target at 202 USD and a Final Target of 251 USD. Take advantage of this Great Opportunity to Earn a Potential Profit of +45% ROI and Overall +74%ROI. Check my Previous Analysis below, already reached the first Target at 174 USD with (+20% Profit).
This is a Long-Term Analysis, it's important to follow Trend continuation techniques.
I want to help People Make Profit all over the World.
PREVIOUS ANALYSIS : Before & After,

Solana Next Target is 174 USD, Gain +20% ProfitIn Solana, Triangle Pattern formed and Expecting Breakout. So Next Target is Top of the Triangle Pattern, Target price is around 174 USD. Potential to Achieve a +20% percentage Profit.
I want to help people to Make Profit all over the "World".

Solana Long Term Analysis- Solana is currently trading at 146$
- Solana is building up a strong base where I easily see Solana purging 200$
- Solana from a Spot Accumulation perspective is sitting at a very bargained price if you are still fiat then add 50% Sol here
- From a swing trade perspective Solana can easily yield 20% from its current price and go up to 163-178$
- Solana's fundamentals are strong so in a major bull run you can expect Solana to easily move up to 500%
- Solana tops all the crypto when it comes to transactions
- Solana also tops all the cryptos when it comes to meme coins listing
- After considering all these points, please avoid becoming overly optimistic and thinking that Solana at this price is the only great option, so you should invest all your funds. Instead, consider adding 50% of your desired investment size here and wait for a significant price drop. If the price doesn't drop further, you can still benefit from the 50% you've invested and let it reach your financial goals.

Solana Breakout Check my previous updates.
As I told you, price are same on my analysis.
Already 12% pumped. 🔥
First Target Hits. ✔

SOLUSDT ShortTime Frame: 4H
Symbol: SOLUSDT
Entry: 32.96
TP: 30.72
SL: 35.13
Bias: Short
This instrument has a selling bias. We are planning a selling set up based on current market dynamics.

SOLUSDT NeutralTime Frame: 4H
Symbol: SOLUSDT
Bias: Neutral
There is no bias for this instrument . We have to wait for a better opportunity.

SOLUSDT ShortTime Frame: 4H
Symbol: SOLUSDT
Entry: 30.92
TP: 26.56
SL: 34.16
Bias: Short
The current price trend is showing a bearish bias and therefore we are looking for a short opportunity.

SOLUSDT NeutralTime Frame: 4H
Symbol: SOLUSDT
Bias: Neutral
We do not recommend any directional bias for this pair.
