Sonata Software Ltd- Trend and chart pattern analysisSonata Software Ltd-
technical + fundamental analysis based on chart and industry outlook 👇
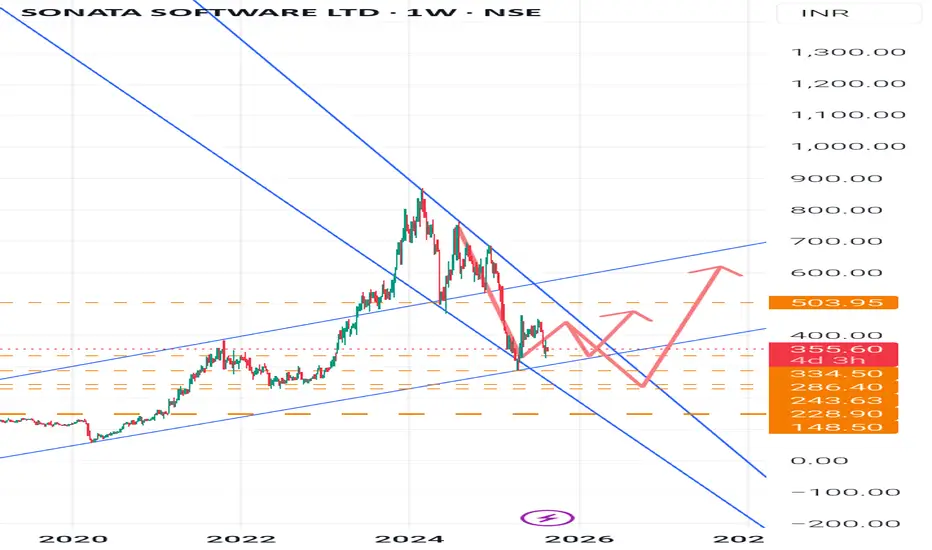
Technical Chart Analysis (Weekly Chart)
Current Price: 356.40
Trend: The stock had a steep rally till 1,200 and then corrected sharply into a downtrend channel. Now it is stabilizing and attempting a base formation.
- Support Levels
334 - immediate support
286 - strong support zone
243 - medium-term support
228 - long-term crucial base
148 - major bottom support
- Resistance Levels
400 - near-term hurdle
503 - key weekly resistance (breakout confirmation if crossed)
600 - medium-term target if trend sustains
700+ - only after strong momentum breakout
- Chart Pattern
Stock is currently consolidating between 330-400.
Possible formation of a W-bottom / double bottom, if 330-334 holds.
A sustained move above 503 could trigger a trend reversal rally toward 600-700.
If it breaks below 286, weakness may extend to 243/228 zone.
🏢 Business & Competition
Sonata Software operates in IT services, cloud, and digital transformation. It earns revenues from export-oriented IT services, particularly in Microsoft ecosystem solutions.
- Key Competitors
Mid-cap IT peers: Mphasis, L&T Technology, Persistent Systems, Coforge, Birlasoft, Mindtree (merged into LTIMindtree).
Sonata is relatively smaller in scale compared to peers but has a niche in Microsoft Dynamics 365 solutions.
📈 Fundamental Ratios (Latest available FY24 data)
Market Cap: 9,500 Cr
P/E Ratio: 27 (mid-cap IT avg. 30-35) - slightly undervalued compared to peers
ROE (Return on Equity): 25% - very strong
ROCE (Return on Capital Employed): 30% - efficient capital use
Debt-to-Equity: 0.05 - virtually debt-free
Dividend Yield: 1.5% - decent payout for investors
Revenue Growth (3Y CAGR): 15-18%
EPS Growth (3Y CAGR): 20%
👍 Investment View
Technicals: Base building in progress. Sustaining above the 400-503 zone is crucial for the next uptrend.
Fundamentals: Strong ROE/ROCE, debt-free, consistent dividend payer. Attractive in mid-cap IT basket.
Risks: Global IT slowdown, client concentration risk, strong USD-INR dependency.
👉Disclaimer
This analysis is for educational & informational purposes only.
It is not financial advice or a buy/sell recommendation.
Stock markets are subject to risks - please consult your financial advisor before making any investment decisions.
#sonatasoftware #trendanalysis #chartpattern
Sonatasoftware
SONATA SOFTWARE - Expecting ATH | 40% upside potential Price Analysis & Overview:
1. Prices have taken support from the fib golden zone.
2. EMA are also supporting the trend.
3. Minimum ATH resistance level will be expected.
4. Above 720 RSI will show further strength for bullish momentum.
5. RRR is favourable.
6. Retracement based trade setup.
Trade Plan:
1. ENTRY = CMP 590
2. SL = 10% 530
3. TARGET = 40% 800++
- Stay tuned for further insights, updates and trade safely!
- These are my personal views.
- If you liked the analysis, don't forget to leave a comment and boost the post. Happy trading!
Disclaimer: This is NOT a buy/sell recommendation. This post is meant for learning purposes only. Please, do your due diligence before investing.
Thanks & Regards,
Anubrata Ray

SonataSoftware-An IT stock for ATH targets!As I had mentioned in my NiftyIT analysis, Sonata software is showing good reversal signs.
Today, stock gave a breakout of trendline after bouncing from support.
It is going to fill gap till 630 tomorrow which can be a good trade any intraday traders.
Swing traders shouldn't miss opportunity of adding this multibagger stock in watchlist.
Good stock for long term investors as well but please invest only after own research.

SONATA SOFTWARE - Swing Trade - 14th January #stocksSONATA SOFTWARE (1D TF) - Swing Trade Analysis given on 14th Jan, 2024
Pattern: FALLING WEDGE BREAKOUT
- Breakout - Done ✓
- Volume Spike at Resistance - Done ✓
- Retest & Consolidation - In Progress
#stocks #swingtrade #chartanalysis #priceaction #traderyte #sonatasoftware

Trade-44/100-SONATA-R:R Experiment-BuyBuying SONATA in DAILY positional trade
Good structure making HH-HL.

SONATA SOFTWARE: Flag breakoutSONATASOFTW has broken out of a long flag on the upside and holding the level. Previously it broke out of a long cup pattern and never looked back. High Volume and High RSI.

SONATSOFTW RECTANGULAR BREAKOUTsonata software breaking rectangle box
trading above 20ema
educational idea only

Formation of cup pattern in 15mins1.Break of trendline in 1day
2.Sonatsoftware forming 2 cups and breakout had happened in 15mins
3.Trendline resistance in 15min once it breaks can expect 3-5%returs

SONATSOFTW - Ichimoku Bullish Breakout Stock Name - Sonata Software Limited
Ichimoku Cloud Setup :
1). Today's close is above the Conversion Line
2). Future Kumo is Turning Bullish
3). Chikou span is slanting upwards
All these parameters are showing bullishness at Current Market Price
and more bullishness AFTER crossing 738
#This is not Buy and Sell recommendation to any one. This is for education purpose and a helping hand to learn trading in Market.
# Cloud Trading
# Ichimoku Cloud
# Ichimoku Followers
I hope you all like my analysis.
Please do share your thoughts into comment section.
Please give a like, share & subscribe for daily analysis.

Sonata Software Rounding bottom Breakout with huge volume Sonata Software can breakout from rounding bottom pattern.
Above 754 with Targets of 25% and 35% respectively
This is purely for education purpose

Sonata Software is in Consoilidation Phase | NIFTY | NIFTY ITThe last 2 Year's chart is shared here.
Just wait and watch the game.
Fundamentals: YoY on YoY Revenue and EPS Growth.
Technicals :
It Breached the 1-Year-Old Trendline and Consolidation around it.
Last 2 Years RS compared to Nifty and Nifty has been Strong.
Although Its Sector's RS Is Weak Compared to Nifty.
Stock is trading above 50 SMA.
It's following a short-term Channel of around 6 Months and it broke its support of it recently.
Now it's again going to enter the channel.
Stock is in an uptrend for the last 6 months.
Stock is printing a VCP-looking alike Pattern in Daily Timeframe.

36# Sonata SoftwareNSE:SONATSOFTW Looks good if
1.Weekly closing crosse above 603
2. Symmetrical Triangle Pattern Breakout
3. Bullish Crossover: Weekly EMA 20 Crosses Above Weekly EMA 50
if you liked it please don't forget to follow me
#Disclaimer: I'm not a SEBI Registered Research Analyst, These are my views, please consult your Investment Advisor before buying and selling any position. This is just for Education purposes.

NSE:SONATSOFTW BuyNSE:SONATSOFTW
#SONATSOFTW One of our MO selected #Multibagger showing positive results,
Check out the levels, After touching 633 level Never look back to that level and reached till 1010 and retraced to 961.
Sustaining above this level might give good momentum, Good above 1015.
Have a Happy trading.

SONATA SOFTWAREThe stock is in uptrend. The RSI presently is 61 and is moving up gradually. See charts for the next few targets.

SONATA SOFTWARE DARVAS BOXbuy above the box that is 909. targets and stoploss are mentioned in the chart

Sonata Software Near its Support (Long Trade)The White line acts as a Great Support. Risk to Reward is Quite favourable at this position.
Entry: 860
Stroploss: 830
Target 1:905
Target 2: 980
you can trail until it Doesn't Breaks White line

Sonata Software- May Breakout soon | Swing trade ideaKey Highlights:
-Consolidating in range
-May retrace a bit before the breakout
-If it gives a clean breakout with volume, then enter only above 815
-Bullish Market structure
-Volume expansion
Disclaimer: This is NOT investment advice. This chart is meant for learning purposes only. Invest your capital at your own risk.

SONATA SOFTWARE | Regression Trend Analysis Rational - Regression Trend Analysis & RSI and CCO Divergence


#SONATSOFTW.. Predicting next price level..It can be a possible opportunity for swing trade in SONATSOFTW..
However, for minimal risk I would buy if price closes above 735 (maybe on 22nd Jun/23rd Jun)
Target- 765-770
Timeframe - expected to reach target before 30th Jun


Sonata Soft - Buy Breakout at daily TF done
Pull back on hourly Tf done
Currently stock is active on hourly TF from 668
Sl below 650 area on CBSL (hourly)

Close connection with 50MAYou'll be surprised to see if you go in back date till now , the stock trades close to its 50 MA... So buy when it touches the 50 MA line, short term holders can trail their stop losses in line with the 50MA
~for educational purpose only~
