BTCUSD 1D TIMEFRAME🔍 What's Driving Bitcoin Today
Institutional Adoption Increasing
Major financial institutions — hedge funds, asset managers, corporate treasuries — are heavily investing in Bitcoin. Dedicated crypto prime brokers are stepping up to serve these clients, signaling a growing institutional footprint.
Stable Institutional Holdings
While Bitcoin has touched record highs, recent dips reflect profit-taking rather than panic. That’s healthy consolidation, not a crash.
Regulatory Tailwinds in the U.S.
New laws (like the “Genius” and “Clarity” Acts) are clarifying the status of stablecoins and digital assets, boosting confidence. Political support from the current administration has incentivized institutional participation and even the creation of a national Bitcoin reserve.
Technical Patterns Suggesting Continuation
Bitcoin appears to be forming a bullish flag or pennant consolidation near the $118K–$120K level — suggesting a likely continuation toward $140K–$250K, depending on momentum and catalysts.
🧭 Market Outlook
Short-Term: Slight consolidation or mild pullback (common after sharp rallies). Key support zones are $115K–$118K. A bounce here may drive prices back toward $120K–$123K.
Mid-Term: If bulls hold momentum and institutional inflows persist, the next major upside targets are in the $140K–$200K range.
Long-Term: With long-term models and institutional forecasts in play, targets stretch as high as $250K by year-end, and some ultra-bullish scenarios envision even $500K+ over a longer time horizon.
⚠️ Key Risks to Watch
Breakdowns below $115K could trigger a deeper correction toward $112K–$110K.
Volatility spikes may occur if macroeconomic factors shift, even as regulatory clarity improves.
Caution from macro critics: Some thought leaders warn of bubble-like conditions, advising risk management.
✅ Summary
Bitcoin remains in a strong bull phase. Today's dip is healthy consolidation after reaching all-time highs. Key support sits between $115K–$118K. A sustained bounce from here could drive a move to $120K–$140K, potentially even higher if institutional flows stay strong. However, a breakdown below that support zone would flip the outlook to neutral or slightly bearish.
Spy!

RELIANCE 1D TIMEFRAME🧾 Basic Market Overview
Open: ₹2,990
High: ₹3,012
Low: ₹2,943
Close: ₹2,956
Change: Down by ~₹34 (approx. -1.13%)
Today, Reliance started strong but faced immediate selling near the ₹3,000 mark, resulting in a negative close. The price remained weak for most of the session, and closed near the day’s low, which is a bearish sign.
🕯️ Candlestick Formation
The candle formed on the daily chart resembles a strong bearish candle — possibly a long red candle or bearish engulfing if it closes below the previous day’s close. This shows:
📈 Trend Overview
Short-Term Trend: Weak — downward momentum building
Medium-Term Trend: Sideways to slightly bullish
Long-Term Trend: Bullish — still intact unless price breaks ₹2,850
Today’s weakness has not yet broken long-term structure, but short-term traders should be cautious.
🔮 What Could Happen Next?
✅ Bullish Recovery:
If Reliance moves back above ₹3,000 and sustains with volume, it can retest ₹3,050–₹3,080
A bullish engulfing or reversal pattern needed for upside confirmation
⚠️ Bearish Continuation:
If it breaks below ₹2,940, more downside is possible toward ₹2,915–₹2,875
Traders may take short positions below this level with tight stop-loss
🔄 Consolidation:
If the price holds between ₹2,940 and ₹3,000, expect sideways movement or base building before a big move
🎯 Strategy Suggestions
For Intraday Traders:
Watch ₹2,940 – ₹3,000 levels closely
Short below ₹2,940 with a target of ₹2,915
Long above ₹3,000 only if backed by strong buying
For Swing Traders:
Avoid new longs until daily candle shows strength
Consider fresh buys near ₹2,900–₹2,915 with SL below ₹2,875
Wait for a breakout above ₹3,050 to confirm bullish reversal
For Investors:
No need to panic; long-term uptrend still valid
Add in dips if it reaches ₹2,875–₹2,850 with confirmation
Fundamental strength supports medium-to-long-term outlook
📌 Summary
Reliance showed bearish sentiment today, breaking below the short-term support of ₹2,975 and closing weak at ₹2,956. It’s trading between a critical support zone of ₹2,940–₹2,915 and facing resistance around ₹3,000–₹3,020.
Short-term: Bearish bias
Medium-term: Neutral to weak bullish
Long-term: Still bullish unless ₹2,850 breaks decisively
Traders should be cautious and wait for confirmation before taking aggressive positions.
Buyers attempted a push above ₹3,000 but failed.
Bears took over the session.
Closing near the day’s low suggests strong downside momentum.
SENSEX 1D TIMEFRAME🧾 Basic Market Overview
Open: ~80,135
High: ~80,177
Low: ~79,513
Close: ~79,698
Net Change: Down by approximately -437 points or -0.55%
The SENSEX index opened slightly positive today but faced strong resistance near the 80,200 level and then reversed sharply during the session. It closed lower than the opening, indicating bearish pressure.
🕯️ Candlestick Analysis
Today’s candlestick is bearish, forming something close to a bearish engulfing or long red candle. It:
Opened higher than yesterday’s close
Rejected higher levels
Closed near the bottom of the day’s range
This suggests supply pressure and profit-booking near the all-time high zone.
📈 Trend & Structure
Short-Term: Weakening; showing signs of reversal
Medium-Term: Still bullish, but cautious near highs
Long-Term: Uptrend still intact (higher highs and higher lows)
The index is currently facing a resistance zone around 80,200–80,300. This is a psychological and technical barrier.
📌 Sector-wise Observation
Banks (ICICI, HDFC Bank): Weak today; contributed to downside
Reliance: Also showed weakness; contributed to fall
IT Sector: Mixed performance; Infosys held flat
FMCG and Pharma: Stable or slightly positive
Major drag came from financials and heavyweight Reliance.
📉 Price Action Summary
SENSEX failed to hold above 80,000, showing resistance
Sellers active at higher levels
First signs of minor distribution phase near the top
May now move into short-term correction or consolidation
🔮 Possible Scenarios Ahead
✅ Bullish Case:
If Sensex can reclaim and hold above 80,200, a breakout rally toward 80,800–81,000 is possible
⚠️ Bearish Case:
If it breaks below 79,400, the index could fall to 78,800, which is the 20-day moving average and prior swing support
🔄 Consolidation Case:
If it trades between 79,400–80,200 for a few days, it would be in a range-bound phase, waiting for new cues
🧠 Strategy Suggestions
Intraday Traders: Look for reversals near support/resistance. Volatility likely near 79,500 and 80,200.
Swing Traders: Avoid fresh long positions until SENSEX closes above 80,300. Short only below 79,400.
Investors: Trend is healthy but wait for a correction before adding large-cap positions.
✅ Conclusion
SENSEX on July 23, 2025, showed clear signs of resistance at 80,200 and closed lower. Although the broader trend remains intact, today’s action hints at short-term profit booking and potential consolidation.
Be watchful of the 79,400–79,500 support zone tomorrow. A break below this could trigger further weakness, while holding above it could stabilize the index.
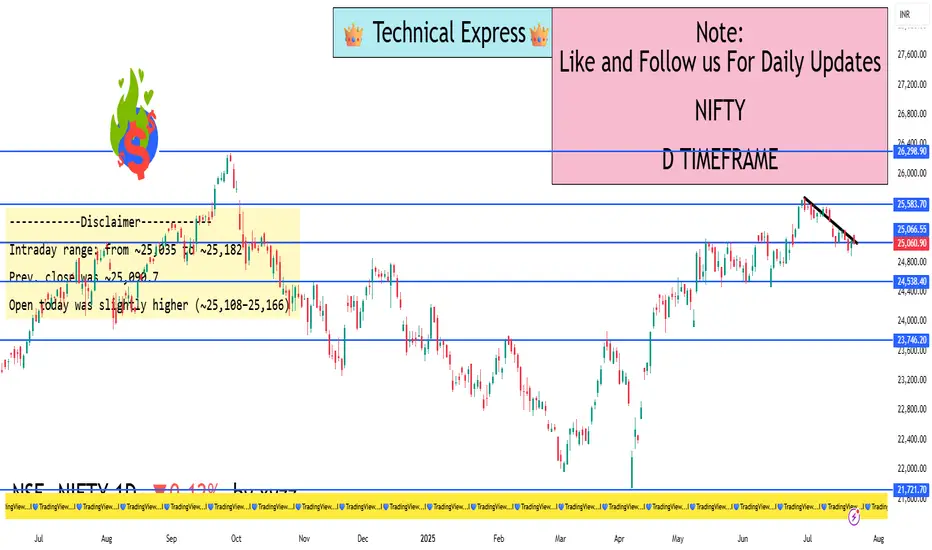
NIFTY 1D TIMEFRAME🟢 Market Overview
Current Status: Nifty 50 opened with strength today, showing positive momentum.
Previous Close: Around 25,123
Today’s Opening: Roughly +60 to +90 points higher, showing bullish intent
Intraday Range: Between 25,100 (Low) and 25,290 (High)
Current Price (as of late afternoon): Trading around 25,270 to 25,285, indicating a +0.6% to +0.7% gain
🔍 Technical Structure
📈 Trend:
Nifty remains in a bullish trend on the daily chart. Price is holding above 21-EMA and 50-EMA, a sign of strength. The recent breakout above 25,100 confirms bullish continuation.
💹 Candlestick Pattern:
The current candle is forming a strong green bar with minor upper wick – indicating buyers are in control.
Past few candles show a rising channel or ascending triangle, suggesting higher highs and higher lows.
📊 Key Technical Levels
Level Type Price Zone Description
🔼 Resistance 25,300 – 25,350 Immediate resistance zone
🔽 Support 25,050 – 25,100 Strong support (breakout retest area)
📉 Deeper Support 24,800 – 24,900 Demand zone if correction happens
🔁 Indicators Summary
RSI (Relative Strength Index): Around 65–68, in bullish territory but not overbought
MACD: Positive crossover still active, supporting bullish momentum
Volume: Healthy volume on green days, slightly higher than red days — bullish sign
🧠 Price Action Summary
Nifty broke out from a consolidation range between 24,800–25,100
The breakout is holding above the resistance now turned into support, showing market strength
No major reversal patterns spotted yet – trend is intact unless we see heavy selling with volume
🔮 Possible Scenarios
✅ Bullish Case
If Nifty breaks above 25,300, expect move toward 25,450 – 25,500 in coming days
Strength in banking, IT, and auto sectors support this view
⚠️ Bearish Case (Short-Term Only)
If it closes below 25,100, could test 24,800 in short term
Watch for sudden global triggers or heavy profit booking
📦 Sector Performance Overview
🔋 Strong: Banking, Auto, FMCG
🛑 Weak/Flat: Realty, Pharma, Metal
📝 Expert Notes
Institutional buying seen in index-heavyweights like HDFC Bank, Reliance, and TCS
FIIs (Foreign Institutional Investors) have shown net buying in the last two sessions
Market breadth is positive – more stocks advancing than declining
📌 Conclusion
Nifty 50 is showing strong bullish momentum on the 1D chart. Unless we see a sudden breakdown below 25,100, the trend remains positive. A breakout above 25,300 will add more fuel to the rally, possibly pushing the index toward 25,500+ in the coming sessions.
Ideal strategy: Buy on dips near 25,100–25,150 with a stop loss below 25,000 and upside targets of 25,300–25,500.

Institution Option TradingWhy Do Institutions Use Options?
Hedging Large Portfolios:
Institutional investors often manage portfolios worth billions. They use options to hedge against unexpected market movements.
✅ Example: A mutual fund holding a large amount of Nifty 50 stocks might buy put options on Nifty as insurance against market crashes.
Generating Income (Option Selling):
Institutions often sell options to earn consistent income (like premiums). They use strategies like covered calls or cash-secured puts to generate returns even in sideways markets.
Capital Efficiency:
Options provide leverage, meaning institutions can control large positions with relatively less capital. This helps them manage cash flow better.
Volatility Arbitrage:
Institutions track and exploit differences in Implied Volatility (IV) vs. Realized Volatility (RV). When the IV is overpriced, they may sell options; when it’s underpriced, they may buy.
Algorithmic and Quant-Based Trading:
Many institutions rely on algorithms and quantitative models that execute thousands of options trades based on volatility, delta exposure, or arbitrage opportunities.
Tools and Techniques Used by Institutions
🔹 1. Option Greeks Mastery
Institutional traders constantly analyze Delta, Gamma, Theta, Vega, and Rho to build and adjust complex positions:
Delta-neutral strategies are used to stay market-neutral.
Theta-positive positions (time decay advantage) are used for income.
Vega-sensitive positions help trade volatility instead of direction.
🔹 2. Open Interest and Volume Tracking
Institutions monitor Open Interest (OI) and volume build-up to identify where other big players are active. A sudden rise in OI on certain strikes may indicate accumulation or unwinding by institutions.
🔹 3. Option Chain Data + Order Flow Analysis
Institutions use Option Chain Analysis with depth data (buy/sell orders) to track smart money movement. Tools like Delta Hedging ratio calculators and OI heatmaps help them find critical levels.
🔹 4. Institutional Spread Strategies
They execute multi-leg strategies like:
Calendar spreads
Diagonal spreads
Ratio spreads
Iron Condors
Iron Butterflies
These are designed to control risk and reward precisely, often with market neutrality.
Examples of Institutional Option Strategies
✅ Covered Call Strategy:
Used by asset managers to generate extra returns on stocks they hold. They sell out-of-the-money calls on the stock positions.
✅ Protective Put Strategy:
A long-term investor may buy put options to protect their holdings against short-term downside risks (especially around earnings or global events).
✅ Straddle or Strangle Before Events:
Institutions sometimes buy or sell straddles/strangles before major events like:
Budget announcements
Central bank meetings
Election results
These help them play or hedge volatility without picking a direction.
Institutional Footprint: How to Spot It
As a retail trader, you can follow institutional activity by:
Watching sudden spikes in OI with price movement.
Observing IV movements before major events.
Looking at the Put/Call Ratio (PCR) and Max Pain points.
Analyzing volume build-up in deep ITM/OTM strikes.
Important: Institutions Are Often Option Sellers
Most institutions are option sellers because:
They have enough capital to absorb risk.
They manage trades professionally.
They benefit from time decay.
They hedge and adjust positions dynamically.
This is why most option premiums decay, and retail buyers often lose unless timed perfectly.
Conclusion
Institutional Option Trading is all about control, precision, and risk management. Institutions don’t look for jackpot trades. They build portfolios, hedge positions, generate consistent income, and use complex strategies that are rarely visible to retail eyes.
For retail traders aiming to "Trade Like Institutions", the path is:
Learn the Greeks deeply.
Understand volatility behavior.
Build strategies with proper risk-to-reward ratios.
Use data, not emotions.
Don’t chase profits—focus on consistency.
You can’t match institutions in capital, but you can definitely match them in discipline, knowledge, and system-based trading.

Option TradingWhat Is an Option?
An option is a financial contract that gives the buyer the right, but not the obligation, to buy or sell an underlying asset at a specific price (called the strike price) on or before a specific date (called the expiry date).
There are two main types of options:
Call Option – Gives the right to BUY the underlying asset.
Put Option – Gives the right to SELL the underlying asset.
🔹 Example:
If you buy a Call Option on Reliance with a strike price of ₹2,500 and the stock goes to ₹2,600, you can buy it at ₹2,500 and sell it at market for ₹2,600 – making a profit.
Basic Terminologies in Option Trading
Strike Price: The fixed price at which the option holder can buy or sell the asset.
Premium: The price paid to buy the option contract.
Expiry Date: The last date on which the option can be exercised.
Lot Size: The fixed quantity of the underlying asset in one options contract.
ITM/ATM/OTM (Moneyness):
In the Money (ITM): Option has intrinsic value.
At the Money (ATM): Strike price = current market price.
Out of the Money (OTM): Option has no intrinsic value yet.
Core Concepts of Option Trading
1. Option Buying vs Option Selling
Option Buyers pay a premium and have limited risk but unlimited profit potential.
Option Sellers (Writers) receive the premium but take on potentially higher risk.
2. Time Decay (Theta)
Options lose value as they approach expiry. This is called time decay. It works against buyers and in favor of sellers. Therefore, option sellers benefit more from time decay.
3. Volatility (Vega)
Volatility affects the premium of options. Higher expected volatility leads to higher premiums. Traders often use Implied Volatility (IV) and Historical Volatility (HV) to make trading decisions.
4. Option Greeks
Advanced traders use Greeks to measure different risks in an option:
Delta: Sensitivity to price change.
Gamma: Change in Delta with price movement.
Theta: Impact of time decay.
Vega: Impact of volatility changes.
Rho: Impact of interest rate changes.
Understanding Greeks is crucial for adjusting and managing option positions.
Popular Option Strategies
Once a trader understands calls and puts, they can use strategies combining multiple options:
✅ Single-Leg Strategies (Basic)
Buying Call or Put: Speculative strategy to profit from movement in one direction.
Selling Call or Put: Used to earn premium with a view that the market will stay flat or move in the opposite direction.
✅ Multi-Leg Strategies (Advanced)
Bull Call Spread: Buy one call and sell another at a higher strike. Used in moderately bullish outlook.
Bear Put Spread: Buy one put and sell another at a lower strike. Used in moderately bearish outlook.
Straddle: Buy a call and a put at the same strike and expiry. Used when expecting a big move, but unsure of the direction.
Iron Condor: Four-option strategy used in sideways markets to earn limited profits with limited risk.
Risk Management in Option Trading
Because options involve leverage, managing risk is crucial. Key practices include:
Position sizing: Only use a small portion of capital per trade.
Stop-loss and Target levels: Always have a predefined exit plan.
Avoid overtrading: Overuse of leverage leads to quick losses.
Understand margin requirements: Especially important for sellers.
Tools Used in Option Trading
Traders use various tools to analyze the market:
Option Chain Analysis: Shows available strike prices, premiums, and Open Interest (OI).
OI Data: High OI at certain strikes indicates strong support/resistance.
IV Chart: Helps spot overbought or oversold options.
Payoff Diagrams: Visual representation of potential profit or loss.
Why Trade Options?
Advantages:
Lower capital requirement
Multiple strategies in all market conditions
Potential for high returns
Useful for hedging equity positions
Disadvantages:
Complex for beginners
Time decay works against buyers
Can incur large losses if misused (especially in option selling)
Conclusion
Option trading offers a dynamic and powerful way to engage with the stock market. It provides flexibility, leverage, and a range of strategies to suit any market condition — bullish, bearish, or neutral. However, it's not a shortcut to riches. Success in option trading demands proper knowledge, discipline, and strategy. Whether you're a beginner or an advanced trader, continuously learning and practicing is key. Start small, understand the risk, and build a system that suits your trading psychology and capital.
If you master the fundamentals — Calls, Puts, Greeks, Time Decay, Volatility, and Risk Management — you can take your trading to the next level and even venture into the world of institutional-style trading strategies.

Advance Option TradingKey Concepts in Advanced Options Trading
Multi-Leg Strategies:
Advanced options trading heavily involves multi-leg strategies — using two or more options contracts in a single trade. Popular ones include:
Iron Condor: A neutral strategy involving four different options contracts to profit from low volatility. It generates a limited profit if the stock remains within a specific range.
Straddles and Strangles: Used when expecting a large price move, but unsure of the direction. Traders buy both a call and a put option.
Butterfly Spreads: These limit both risk and reward and are ideal when the trader believes the stock will stay near a specific price.
Adjustments and Rolling:
Unlike basic options traders who may let contracts expire, advanced traders constantly adjust positions. For example, if a trade moves against them, they may "roll" the position — closing it and reopening another at a different strike or expiry.
Understanding Option Greeks:
Advanced traders don’t just bet on direction; they manage exposure to:
Delta (Direction)
Gamma (Rate of change of delta)
Theta (Time decay)
Vega (Volatility sensitivity)
Rho (Interest rate impact)
This helps in building more calculated, data-driven trades.
Volatility Trading:
Volatility is key in advanced options. Some traders look to exploit Implied Volatility (IV) — pricing of future volatility — by trading IV crush around earnings or economic events. For instance, an Iron Condor may be used when IV is high, aiming to profit from the IV drop.
Directional vs. Non-Directional Trading:
Advanced traders often prefer non-directional strategies. These are setups where you can make money even if the market goes sideways, such as with Iron Condors or Calendar Spreads.
Risks in Advanced Options Trading
While the rewards can be higher, so are the risks. Complex strategies can lead to significant losses if misunderstood. Margin requirements can be high, and some trades may have unlimited loss potential (e.g., uncovered calls). Hence, strict risk management, stop-loss rules, and position sizing are essential.
Final Thoughts
Advanced options trading is not for beginners, but for those who want to move beyond simply guessing market direction. It’s about constructing trades that work in various market conditions — bullish, bearish, or sideways — and using volatility and time as weapons. With the right knowledge and discipline, advanced options can become a powerful tool in any trader’s arsenal. However, success requires education, continuous learning, and a clear understanding of risk and reward

Institutional Objectives in Options Trading🎯 1. Hedging Large Portfolios
One of the primary institutional goals is to protect investments from unfavorable market movements. Since institutions hold large quantities of stocks, they face massive risk if the market turns against them.
✅ Example:
A mutual fund holding ₹100 crore worth of Nifty 50 stocks might buy Put Options on Nifty to protect against a market crash.
This acts like insurance — a small premium is paid to avoid a huge loss.
🔹 This is called a protective put strategy.
📈 2. Generating Additional Income
Institutions also use options to generate consistent income. Since they often hold large amounts of shares, they can write (sell) options against these positions.
✅ Example:
Selling Covered Calls against stock holdings generates premium income, especially when expecting the market to remain sideways.
Writing Cash-Secured Puts allows them to earn premium while preparing to buy a stock at a lower price.
🔹 This enhances portfolio returns without needing to sell the core holdings.
📉 3. Managing Volatility Exposure
Volatility is a double-edged sword. Institutions analyze and trade implied volatility (IV) rather than just direction. They adjust their portfolios using options to profit from volatility changes or to reduce risk when volatility spikes.
✅ Common practices:
Use straddles and strangles before major events like earnings or elections.
Buy options when IV is low (expecting a spike) and sell options when IV is high (expecting it to drop).
🔹 This is called volatility arbitrage or vega trading.
🔁 4. Portfolio Adjustment and Rebalancing
Institutions use options to rebalance exposure without triggering capital gains taxes or disturbing existing stock positions.
✅ Example:
Instead of selling shares, an institution might:
Buy puts to reduce downside risk.
Sell calls to lock in profits.
Use spreads or collars to control price bands of risk/reward.
🔹 This helps in making tactical moves without liquidating long-term holdings.
💡 5. Directional Bets With Limited Risk
Though not their primary objective, institutions sometimes make directional bets using options for leveraged exposure, with defined risk.
✅ Example:
If a fund expects a strong upside in a stock, it might buy call options instead of the stock itself.
This reduces capital requirement and limits downside to the premium paid.
🔹 This is common in event-driven trading, such as earnings, mergers, or regulatory announcements.
🔄 6. Capital Efficiency
Institutions are under constant pressure to manage capital efficiently. Buying or selling options allows them to control larger positions with less money, keeping more capital available for other trades.
✅ Example:
Instead of buying 1,00,000 shares of a company, they might buy deep ITM call options to replicate stock movement with lower capital.
🔹 This is known as synthetic long exposure.
⚖️ 7. Risk Transfer and Insurance
Options allow institutions to transfer market risk to willing counterparties. They use customized derivatives or listed options to insure specific risks, such as:
Currency risk
Interest rate risk
Commodity price risk
Equity drawdowns
🔹 Large institutions like banks and insurance firms use over-the-counter (OTC) options for complex hedging.
🛠️ 8. Complex Strategy Execution
Institutions often use multi-leg strategies for market-neutral setups or for fine-tuned payoff structures. These include:
Iron Condors
Butterfly Spreads
Calendar/Diagonal Spreads
Box Spreads
Delta-neutral gamma scalping
🔹 These allow fine control over expected profits and losses, based on volatility, time decay, and price movement.

Institutional Trading StrategiesWhat is Institutional Trading?
Institutional trading means the buying and selling of stocks, futures, options, and other financial instruments by large organizations. These organizations are often:
Mutual Funds
Pension Funds
Hedge Funds
Banks and Insurance Companies
Foreign Institutional Investors (FII)
Domestic Institutional Investors (DII)
Unlike retail traders who trade with small amounts of capital, institutional players move huge sums of money, sometimes trading in crores or billions in a single day.
Why Do Institutions Trade Differently?
Institutions have massive capital, so their approach is completely different:
They can’t enter or exit a stock quickly without moving its price.
They focus more on long-term positions or large short-term trades.
They use advanced tools like algorithms, high-frequency trading, and exclusive market data.
In simple words: they trade like whales in the ocean, while retail traders are like small fish.
Core Institutional Trading Strategies Explained
1. Order Flow and Volume Analysis
Institutions often leave their footprint in the market by how much they buy or sell. This is visible through volume spikes and order flow. Retail traders can track this by:
Watching unusual volume on a stock
Monitoring delivery percentage (for cash segment)
Using indicators like VWAP (Volume Weighted Average Price) to see where large trades are happening
Institutions use volume as a key indicator because when big money flows in, prices generally follow.
2. Order Block and Supply-Demand Zones
Institutions don’t buy stocks in one go. They accumulate positions slowly within certain price ranges. These areas are called:
Order Blocks – zones where large buying or selling has happened in the past.
Supply-Demand Zones – areas where the market reacts due to prior institutional activity.
When price comes back to these zones, you will often see a strong bounce (demand) or rejection (supply).
3. Breakout and False Breakout Manipulation
Institutions are masters of manipulation. They often cause:
False Breakouts to trap retail traders.
Breakdown traps to collect positions cheaply.
You will see prices breaking key levels (like support or resistance), triggering retail stop losses, and then reversing sharply. Institutions use liquidity from these retail stop losses to enter or exit positions.
4. Volume Weighted Average Price (VWAP) Strategy
Most institutions benchmark their trades around VWAP.
When prices are above VWAP, the bias is bullish.
When prices are below VWAP, the bias is bearish.
Institutions often buy when price retraces to VWAP after a breakout and sell when it tests VWAP after a breakdown. VWAP acts like a fair value line for many large traders.
5. Liquidity Hunting and Stop Loss Fishing
Institutions need liquidity to place large orders. So they create fake moves:
Push prices higher to make retail buy, then sell into it.
Push prices lower to trigger retail stop-losses and then reverse the price upwards.
This is why retail traders often feel the market is “hitting my stop-loss and then moving in my direction”.
6. Options Data Analysis
Institutions hedge their cash and futures positions using options:
High Open Interest (OI) at certain strike prices indicates important levels.
Sudden OI build-up can show institutional call writing (bearish) or put writing (bullish).
Institutions use Option Selling strategies because time decay (theta) works in their favor.
Retail traders can track option data to understand institutional bias, especially around expiry.
7. Algorithmic Trading (Algo Trading)
Institutions use computers (algos) to execute trades based on pre-defined rules:
Speed: Algos trade in microseconds.
Precision: No emotions, just system-based entries and exits.
Scalability: Handles thousands of orders simultaneously.
You can’t compete with algos on speed, but you can follow the flow by watching patterns like sudden large candles without news or price bouncing off VWAP repeatedly.
8. Fundamental Catalysts Trading
Institutions also trade based on news, earnings, and economic data:
Positive quarterly results → gradual accumulation before the news
Interest rate changes → repositioning in banking stocks
Government policy changes → entering sectors like infrastructure or defense
They often buy early before the public knows and sell after retail traders start entering.
9. Sector Rotation Strategy
Institutions rotate money between sectors:
Moving from IT to Banks
From FMCG to Auto
From Metal to Pharma
Retail traders get stuck chasing one stock, while institutions follow where big sector money is flowing. You can track sector indices (like Nifty Bank, Nifty Auto) to ride these moves.
10. Index Balancing Strategy
In indices like Nifty 50 or Sensex, institutions adjust portfolios based on:
Index addition/removal
Rebalancing due to quarterly reviews
Passive fund flows
Stock prices often jump or fall sharply around these events, giving smart traders easy trading opportunities.
How to Identify Institutional Activity as a Retail Trader
Look for unusual volume spikes
Watch for rejection or breakout around order blocks
Use VWAP as a guidance tool
Track option chain data before key events
Follow sector rotation via index charts
Watch price-action near important news events
Practical Tips for Retail Traders
Trade less, trade better: Institutions don’t chase every small move, neither should you.
Wait for confirmation: Let institutions show their hand through volume before entering.
Avoid emotional trades: The market is designed to make you emotional — don’t fall for it.
Risk management is king: Institutions have risk teams; you must use stop-loss.
Never blindly follow tips: By the time you hear news, institutions are already in or out.
Why Institutional Strategies Work Better
Institutions follow a data-driven approach backed by:
Risk management policies
Trained analysts
Large capital to manage volatility
No emotional trading
Use of technology (Algos)
Retail traders who respect market structure and trade alongside institutions improve their win rate dramatically.
Final Thoughts
Institutional Trading is all about structure, discipline, and patience. It’s not about guessing but about observing market behavior — where are the big players active? Why is volume rising? Where is liquidity flowing?
You don’t need huge capital to benefit from institutional strategies. You simply need to follow the footprints, avoid traps, and focus on high-probability trades.
Bank Nifty and Nifty50 Scalping TechniquesWhat is Scalping in Index Trading?
Scalping is a high-frequency intraday trading style where a trader looks to capture small price movements multiple times throughout the day. In indices like Nifty50 and Bank Nifty, where price movement is fast and often sharp, scalping is a preferred strategy for many traders.
Scalpers don't aim to catch a ₹100 move. Even ₹20–₹30 on a Bank Nifty option, done 3–4 times a day with volume and discipline, can generate consistent returns.
Why Nifty50 & Bank Nifty for Scalping?
High Liquidity: Tight bid-ask spreads make it easier to enter and exit quickly.
Option Volatility: Options on these indices give quick 5–10% moves in minutes.
Trend & Momentum Friendly: These indices often move in clean intraday trends, giving plenty of scalping chances.
Institutional Interest: Nifty and Bank Nifty are tracked by institutions, so technical levels work well.
Tools Every Scalper Must Use
Before we dive into strategies, make sure you have these ready:
5-Minute / 3-Minute Candlestick Chart
VWAP (Volume Weighted Average Price)
CPR (Central Pivot Range)
Price Action Levels (Previous Day High/Low, Opening Range)
Option Chain Analysis (for OI build-up)
Volume & Momentum Indicators (e.g., RSI, MACD)
Top Scalping Techniques for Nifty & Bank Nifty
1. VWAP Bounce Strategy
Best Time: 9:30 AM to 11:00 AM or 1:30 PM to 3:00 PM
How it works:
Wait for price to test the VWAP line.
If trend is up, and price bounces from VWAP with a bullish candle → enter Call Option.
If trend is down, and price rejects VWAP with bearish candle → enter Put Option.
Entry: On confirmation candle after touching VWAP
Target: 15–25 points on option premium
Stop Loss: 5-minute candle close above/below VWAP
Why it works: Institutions use VWAP for entries; many intraday algos are VWAP-based.
2. CPR Breakout Scalping
Best Time: Opening hour or post-lunch (2:00 PM onwards)
How it works:
If the day’s CPR is narrow, expect trending moves.
Wait for a breakout above CPR high (for long) or below CPR low (for short).
Entry only after a strong 5-minute candle closes outside CPR.
Bonus Tip: Narrow CPR + gap-up = trend day; very scalper-friendly.
Targets: 1:1.5 or trailing stop loss
Risk: High if you trade before confirmation—wait for candle close.
3. Opening Range Breakout (ORB)
Best Time: 9:15 AM – 9:45 AM
How it works:
Mark high and low of first 15 minutes (Opening Range).
Wait for price to break above high or below low with volume.
Ride the momentum for a quick 20–30 point move.
Ideal with: Volume spike + option chain confirmation (OI buildup)
Setup Example:
Bank Nifty breaks above 15-min high, with strong buying in 44,000 CE option → go long.
4. Momentum Scalping with RSI + Candles
How it works:
Use 3-minute chart.
If RSI crosses 60 and a strong green candle forms → go long.
If RSI drops below 40 and red candle forms → go short.
Why this works: Combines price momentum with volume conviction.
Targets: Small, quick moves (10–20 points in Nifty, 20–40 in Bank Nifty options)
Stop Loss: Fixed SL or previous candle high/low
5. Option Chain Scalping – "Smart Money Footprint"
How it works:
Track OI build-up in real-time (especially at ATM or 1-step OTM strikes).
If you see heavy OI build-up + volume spike at 44,000 CE → momentum may build.
Enter on confirmation from price chart (ideally with VWAP or CPR confluence).
Bonus: Combine this with Live Change in OI (many brokers offer this now).
Tools to watch:
Strike Price OI Build-up
IV Rise (Implied Volatility)
Volume on Option Contracts
Important Scalping Do’s & Don'ts
Do’s:
Trade only when price structure + indicator + volume align.
Use limit orders to reduce slippage.
Cut losses fast. Scalping is risk-first.
Have fixed daily targets (e.g., ₹1,500/day)
Trade less when market is choppy
Don’ts:
Don’t chase after big moves already gone.
Don’t increase lot size without system consistency.
Don’t scalp in low volatility phases (e.g., between 12–1:30 PM).
Mindset of a Nifty/Bank Nifty Scalper
You are not a trend trader – you’re a sniper.
Profits come from repetition, not jackpot moves.
You must read the pulse of the market within the first 30 minutes.
No trade > bad trade.
Scalping is about control, discipline, and micro-decisions. Even 3–5 successful trades in a session can result in high accuracy days.
Example Live Scenario (Bank Nifty)
Date: Suppose Bank Nifty opens at 44,000
CPR Range: 43,940–44,060 (tight)
VWAP: At 44,020
Option Chain: 44,000 CE OI increasing rapidly, price trading above VWAP
Setup: CPR breakout + VWAP hold + OI build-up at CE
Trade: Buy 44,000 CE @ ₹120
Target: ₹140–₹160
SL: ₹110
Exit: Within 10–15 mins
Avoid trading just on gut feeling. Use structure.
Conclusion
Scalping in Nifty and Bank Nifty is not gambling—it's calculated, quick decision-making with small but consistent profits. Whether you’re using VWAP, CPR, or live option data, your edge comes from preparation and discipline, not prediction.
If you're just starting, begin with paper trading or small lots, and gradually scale up once your win-rate improves. With time, you'll find the setup that fits your personality best—whether it’s breakout-based, pullback scalping, or OI-driven.
Nifty 1D Timeframe📈 Nifty 50 – Market Overview
Opening Level: Nifty 50 opened positive above 25,100, continuing momentum from the previous session.
Intraday High: Touched around 25,166 during the early session.
Intraday Low: Hovered around 25,111 in the later session.
Current Range: Mostly trading between 25,110 to 25,160, with a slight upward bias.
Previous Close: Around 25,090.
Current Gains: Around +0.1% to +0.3% for the day.
🔍 What’s Driving Nifty Today
Banking Sector Strength: Strong performance from HDFC Bank, ICICI Bank, and other financial stocks lifted the index.
Quick Commerce Rally: Companies like Eternal (Zomato parent) showed double-digit gains, adding upward pressure.
Volatility Decline: The India VIX dropped nearly 3%, suggesting reduced market fear and more stable price action.
Mid-Session Profit Booking: Sectors like Realty, Pharma, and Media witnessed some selling, causing small dips during the day.
📊 Technical Snapshot
Support Level: Immediate support seen around 25,100, below which the next strong zone is around 24,950.
Resistance Level: Strong resistance around 25,160–25,200, with breakout potential toward 25,300–25,400 if breached.
Trend Outlook: The market is holding a bullish tone, with minor intraday corrections typical in a trending market.
💡 Traders’ Perspective
Direction Trigger Level Expected Move
Bullish Scenario Above 25,166–25,200 Target next zone between 25,300–25,400
Neutral/Range-bound Between 25,100–25,160 Choppy movement, watch sector rotation
Bearish Scenario Below 25,100 Possible quick slide toward 24,950–25,000
✅ Summary
Today’s session on Nifty 50 shows mild positivity driven by financial stocks and quick-commerce momentum. The market remains range-bound near recent highs, with sectors like realty and pharma underperforming. The index is showing strength above 25,100, and a breakout above 25,200 could lead to further upside in the coming days
Banknifty 1D Timeframe📈 Bank Nifty – Market Overview
Opening Price: Opened strong near 57,250–57,300.
Intraday High: Touched around 57,286 in early trading hours.
Intraday Low: Dropped towards 56,730 during mid to late session.
Current Trading Range: Between 56,730 and 57,280, with a mild negative bias.
Previous Close: Around 56,953.
Current Loss: Trading -0.3% to -0.5% lower compared to previous close.
🔍 Key Drivers Today
Private Banks Hold Strength: Stocks like HDFC Bank and ICICI Bank showed resilience, limiting the downside.
PSU Banks Under Pressure: Public sector banks including SBI, PNB, and Canara Bank underperformed, causing the index to drift lower.
Profit Booking Seen: After an early positive move, intraday profit booking pulled the index back.
Low Volatility: Reduced intraday swings, though a narrow downtrend was visible after the first hour.
📊 Technical Picture
Support Zone: Strong support is visible around 56,730–56,700. A breach could see a quick move toward 56,500–56,000.
Resistance Zone: Resistance remains at 57,250–57,300. If this level is crossed, the next upside target is around 57,500–57,700.
Trend Bias: Neutral to bearish for the day due to selling pressure after opening strength.
✅ Summary Conclusion
Bank Nifty is showing slight weakness today, mainly dragged by public sector banks. The index gave up early gains, but private banks kept the fall in check. Current range is 56,730–57,280. Watch for either a bounce above 57,300 or a break below 56,700 for the next clear trend direction.

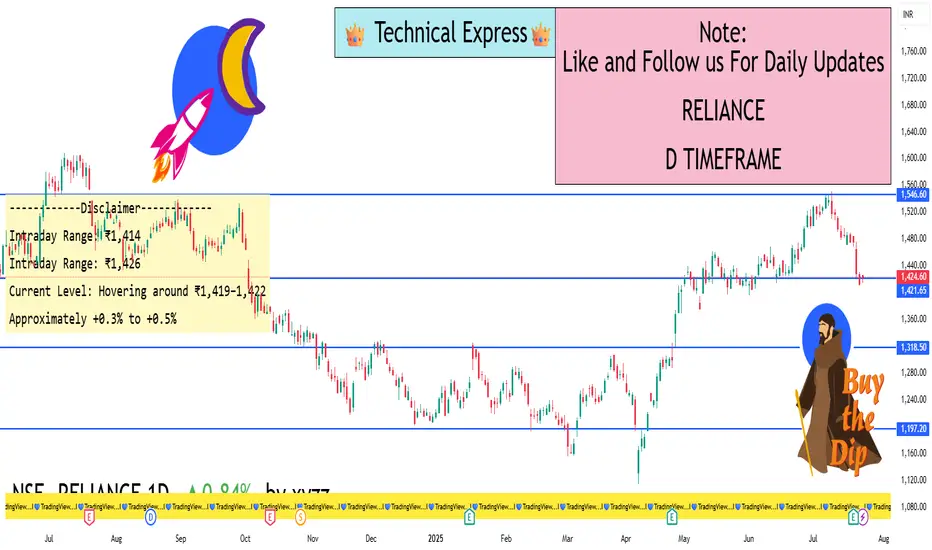
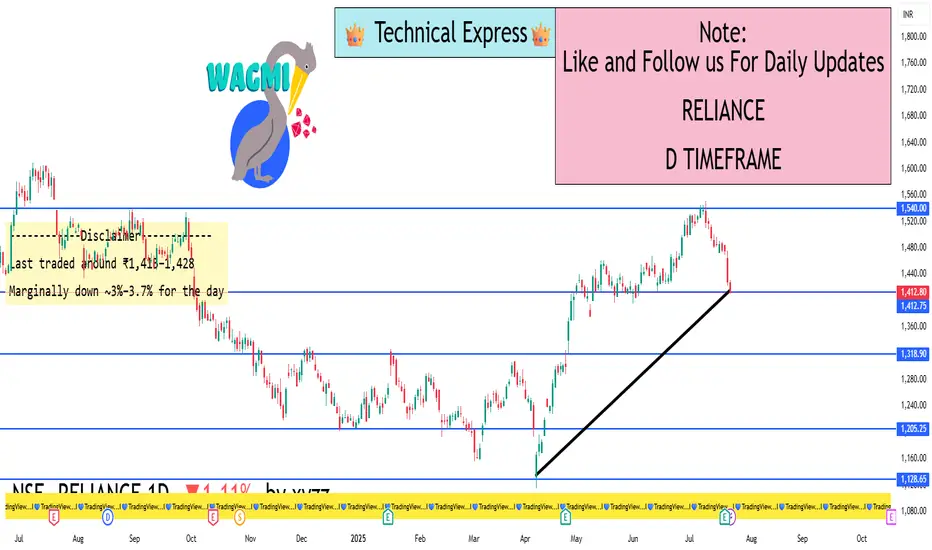
Reliance 1D Timeframe📊 Reliance Industries – Intraday Overview
Previous Close: ₹1,428.6
Opening Price: Opened slightly lower around ₹1,427–₹1,431.
Intraday High: Approximately ₹1,432 during early session.
Intraday Low: Dropped towards ₹1,410 during the mid-session.
Current Trading Price: Trading near ₹1,415, showing around 0.9% to 1% decline from the previous close.
🔍 Key Reasons for Movement Today
Post-Earnings Pressure: After recent earnings, Reliance faced profit booking as some investors booked gains following a previous rally.
Sector Weakness: Energy and telecom segments showed subdued strength while retail remained flat.
Heavy Volume: Trading volume remained above average, suggesting active participation from institutions and retail traders.
📈 Technical Snapshot
Immediate Support Zone: ₹1,410–₹1,412. If this breaks, next support could be near ₹1,400.
Immediate Resistance Zone: ₹1,430–₹1,432. A breakout above this may lead towards ₹1,440–₹1,450.
Trend Positioning: Reliance is currently below its short-term (20-day) moving average, indicating mild short-term weakness but no major breakdown.
💡 Intraday Strategy Levels
Scenario Trigger Point Expected Move
Bullish Reversal Above ₹1,432 Potential upside towards ₹1,445–₹1,450
Neutral/Bearish Between ₹1,410–₹1,430 Consolidation zone with limited moves
Breakdown Risk Below ₹1,410 Could slide to ₹1,400 or even ₹1,390 short-term
✅ Summary Conclusion
Reliance is trading with a mild negative bias, with price action holding between ₹1,410–₹1,432. The overall short-term structure remains weak after intraday profit booking, but key support is holding near ₹1,410. Watch for recovery above ₹1,432 for any bullish reversal or break below ₹1,410 for further downside.
HDFCBANK 1D Timeframe📈 HDFC Bank – Intraday Overview
Opening Price: Opened strong around ₹2,005–₹2,010.
Intraday High: Touched approximately ₹2,018 during early trading.
Intraday Low: Maintained support around ₹2,000.
Current Price: Trading near ₹2,016, showing a gain of around +0.8% to +0.9%.
Previous Close: ₹2,005.
🔍 What’s Driving HDFC Bank Today
Positive Earnings Effect: Strong Q1 earnings with around 12% year-on-year profit growth, bonus share announcements, and dividends have boosted buying interest.
Sector Leadership: Among the strongest performers in the banking sector, helping to support indices like Nifty50 and Bank Nifty.
Consistent Volume: Healthy trading volumes indicate sustained institutional participation.
Strong Sentiment: Momentum remains high with overall positive cues from private banking space.
📊 Technical Summary
Support Level: Strong support exists around ₹2,000–₹2,005.
Resistance Level: Intraday resistance at ₹2,018 with major resistance near ₹2,027 (recent all-time high).
Trend Direction: Bullish trend, as it is making higher lows and maintaining strength above the psychological ₹2,000 mark
✅ Summary Conclusion
HDFC Bank is trading positively today with sustained momentum after strong earnings and corporate actions. Intraday action shows bullish strength above ₹2,000, with the possibility of new highs if it crosses ₹2,018–₹2,027 levels. Technical trend remains positive to bullish for the day.

Institution Option Trading📈 Institutional Option Trading – Complete Detailed Guide
Institutional Option Trading refers to how big financial institutions, such as banks, hedge funds, and proprietary trading firms, use options strategically in the market to manage risk, maximize profits, and control large positions with precision. This approach is highly systematic, data-driven, and based on volume, volatility, and liquidity analysis — very different from how retail traders trade options.
💡 What is Institutional Option Trading?
Institutions don’t gamble with options — they use options for:
✅ Hedging — Protecting big portfolios from market drops.
✅ Income Generation — Earning regular profits through premium selling.
✅ Directional Bets — Placing large directional trades with minimal risk.
✅ Volatility Trading — Making profits from changes in volatility without caring about market direction.
📚 Key Features of Institutional Option Trading
1. Focus on Liquidity
Institutions trade highly liquid options, usually:
Index Options (NIFTY, BANKNIFTY, SPX)
Blue-Chip Stocks (Apple, Reliance, TCS, Infosys)
Commodity Options (Gold, Crude Oil)
They avoid low-volume contracts and always trade in markets where they can enter and exit positions without slippage.
2. Use of Option Greeks
Institutions are masters of Option Greeks:
Delta for direction,
Theta for time decay profits,
Vega for volatility play,
Gamma for adjusting positions dynamically.
They don’t trade blindly but monitor how their positions react to price, time, and volatility changes.
3. Premium Selling Bias
Most institutional setups involve selling options (not just buying).
✅ Credit Spreads, Iron Condors, and Covered Calls are preferred.
Why? Because time decay works in their favor, giving consistent income.
4. Hedging Big Positions
Institutions always hedge their trades.
✅ Example: They may hold large stock positions and sell Covered Calls or buy Protective Puts to reduce risk.
✅ This creates balanced portfolios, minimizing market shocks.
✅ Institutional Trading Tools
Open Interest Analysis
Option Chain Data
IV (Implied Volatility) charts
Volume Profile & Market Profile
Real-time Greeks exposure tools
Delta-neutral hedging platforms
📝 Example of Institutional Option Trade
Scenario: NIFTY at 22,000, sideways expectation for next week.
✅ Strategy: Sell 22,500 Call, Sell 21,500 Put (Iron Condor).
✅ Buy hedges: 23,000 Call, 21,000 Put.
✅ Profit Range: If NIFTY stays between 21,500-22,500 → Max Profit.
✅ Risk Managed: Losses capped, steady time decay profit.
🚀 Benefits of Learning Institutional Option Trading
✅ Consistent income instead of gambling
✅ Risk protection using proper hedging
✅ Trade size management for scalability
✅ Ability to handle big accounts with steady growth
✅ Professional market understanding

Trade Like Istitution💡 What It Means to Trade Like Institution
✅ You analyze the market like a pro, focusing on price action and key liquidity areas.
✅ You avoid retail traps like false breakouts and late entries.
✅ You follow smart money flow, using higher timeframes for bias and lower timeframes for precision entries.
✅ You target high-probability zones, not random entry signals.
🟣 Core Institutional Trading Concepts
1. Liquidity Hunting
Institutions know where most traders place stop-losses — above recent highs and below recent lows. They:
Push the price to grab liquidity,
Then reverse the market to their original direction.
2. Order Block Theory
An Order Block (OB) is the last bullish or bearish candle before a major move.
Institutions leave footprints at these points:
Bullish Order Block = Entry zone for long trades.
Bearish Order Block = Entry zone for short trades.
3. Market Structure
Smart money never trades randomly. Institutions:
Trade with the trend: identifying Break of Structure (BOS).
Change bias when Change of Character (CHOCH) happens.
Always trade in alignment with market structure.
4. Fair Value Gaps (FVG)
When price moves rapidly, it leaves imbalances on the chart (FVG zones). Institutions often come back to fill these gaps before continuing.
🎁 Trade Like Institution – Step-by-Step Method
Step 1: Mark Higher Timeframe Zones
Use 4H or Daily timeframe to identify major order blocks and liquidity zones.
Step 2: Track Liquidity
Look for equal highs/lows (liquidity build-up).
Wait for liquidity grabs before entering.
Step 3: Look for Break of Structure (BOS)
After liquidity is grabbed, wait for a market structure shift (BOS or CHOCH).
Step 4: Refine Entries on Lower Timeframes
Drop to 5min or 15min timeframe.
Wait for clean entry at order block or FVG, with a small stop loss.
Step 5: Manage Risk Like Institutions
Risk 1-2% per trade maximum.
Target 2:1, 3:1, or more, but exit partially at key liquidity zones.
📝 Institutional Trading Mindset
✅ Patience is Power: Institutions wait for price to come to them.
✅ Quality over Quantity: Few high-probability trades, not dozens of small trades.
✅ Risk Management First: Protect capital like a professional fund.
✅ Follow the Smart Money Flow, never the crowd.
🧩 Example Institutional Trade Setup (Simple):
✅ Timeframe: 4H for direction, 15min for entry.
✅ Mark Daily Order Block → Wait for liquidity grab.
✅ Wait for CHOCH on 15min → Enter after FVG fill.
✅ SL below OB → Target last high (RR 1:3).

Learn Institutional Trading💡 What Does “Learn Institutional Trading” Mean?
When you learn institutional trading, you focus on:
Smart Money Behavior — How institutions think and trade.
Market Manipulation — How the big players create fake moves to trick small traders.
Liquidity Zones — Areas where institutions enter or exit trades.
Order Blocks, Breaker Blocks, Fair Value Gaps — Special price zones where banks place their orders.
Higher Time Frame Analysis — Institutions trade on bigger time frames like 4H, Daily, and Weekly.
🎁 Why Learn Institutional Trading?
✅ Understand why price moves before big news.
✅ Learn where to enter trades with high accuracy.
✅ Trade with peace of mind by following market logic, not emotions.
✅ Get consistent profits by following smart money footprints.
🔥 Key Topics to Learn in Institutional Trading
1. Market Structure
Learn how the price moves in trends: Higher Highs, Higher Lows (Uptrend) and Lower Highs, Lower Lows (Downtrend).
Identify key swing points used by big traders.
2. Liquidity Concepts
Price always goes where liquidity is (stop-loss clusters, pending orders).
Learn about liquidity grabs, stop hunts, and false breakouts.
3. Order Blocks
The secret zones where institutions enter trades.
Once you spot order blocks, you can trade before the market moves big.
4. Fair Value Gap (FVG)
Price always returns to imbalance zones where few trades happened.
Learn to trade the gap fills with high accuracy.
5. Entry Techniques
Learn how to enter using Break of Structure (BOS) or Change of Character (CHOCH).
Use confirmation entries on lower time frames (5min, 15min) after spotting order blocks on higher time frames (4H, Daily)
🧩 Tools You Need to Learn Institutional Trading
✅ TradingView — For chart analysis.
✅ Forex Factory — For news events and market sessions.
✅ SMC Indicators — Some free, some paid tools available for order block marking.
✅ YouTube or Paid Courses — Channels like Mentfx, ICT (Inner Circle Trader), etc.
✅ Trading Journal — To track every trade and improve.
📊 Example Setup (Simple Explanation):
Timeframe: Daily chart for order block → 15min chart for entry.
Step 1: Spot Order Block on Daily.
Step 2: Wait for Liquidity Grab.
Step 3: Wait for CHOCH on 15min.
Step 4: Enter trade with SL below OB → Target previous high/low.
📝 Conclusion:
Learning Institutional Trading = Trading Smart Money Way
This method teaches you to follow the banks and big traders — not get trapped by them. Mastering these skills takes time and practice, but it transforms you from a random gambler into a professional trader.

Master Institutional Trading What is Institutional Trading?
Institutional trading involves market participation by major financial organizations that trade massive volumes of stocks, forex, commodities, or derivatives. Their trades are usually well-planned, research-driven, and executed with precision to avoid large price movements during entries and exits.
Institutions have:
Access to insider research.
Priority order execution.
Advanced algorithmic trading tools.
Huge capital, which can shift market directions.
Retail traders, in contrast, often lack these tools and operate with limited funds. However, by mastering institutional trading concepts, a retail trader can "follow the smart money" and make better, more informed trades.
🎯 Key Concepts in Master Institutional Trading
1. Market Structure
Institutional traders rely heavily on market structure — identifying how price moves in trends, ranges, and key swing points.
Higher Highs & Higher Lows in uptrends.
Lower Highs & Lower Lows in downtrends.
Liquidity zones where institutions place orders.
2. Order Blocks
Order blocks are areas on the chart where institutions have placed large buy or sell orders. These blocks often act as strong support or resistance zones where price reacts heavily.
Bullish Order Block: A zone of institutional buying.
Bearish Order Block: A zone of institutional selling.
3. Liquidity Grabs & Stop Hunts
Institutions often "hunt liquidity" by pushing the price to take out retail stop-losses before moving in the desired direction.
Stop Loss Liquidity: Targeting areas where many traders have their stops placed.
Fakeouts & Traps: Creating false breakouts to capture liquidity.
4. Imbalances / Fair Value Gaps
After strong institutional moves, price often leaves imbalances (gaps) in the market where few or no trades occur. Institutions usually revisit these gaps to "fill" them before continuing the trend.
5. Smart Money Concepts
This strategy focuses on aligning your trades with institutional activity using:
Internal/External Liquidity
Premium/Discount Pricing
High Timeframe Bias
Refined Entry Models
✅ Benefits of Mastering Institutional Trading
Trade with the Market Movers instead of against them.
Higher Accuracy, fewer fakeouts.
Better Risk Management, learning how and where institutions place their stops.
Improved Patience & Discipline, by following smart money footprints.
🚀 Popular Institutional Trading Tools
TradingView for clean charts and liquidity mapping.
MT4/MT5 with SMC indicators.
Volume Profile to see where high-volume trades occur.
Order Flow Tools (more advanced) to analyze order book data.
📝 Final Thoughts
Mastering Institutional Trading is not about copying a magic strategy but learning how the market truly operates from a smart money perspective. It requires patience, backtesting, and constant observation of market behavior. Once you align yourself with institutional flows, your win rate and consistency can dramatically improve.

SEBI’s Derivatives Market Reforms & Jane Street Fallout1. The Bigger Picture: Why SEBI Intervened
India is currently the world’s largest equity derivatives market in terms of contracts traded. On expiry days, the trading volume in index derivatives—especially options—is often more than 300 times higher than that of the cash market. This unprecedented scale might sound like a success story at first glance, but SEBI, the Securities and Exchange Board of India, saw warning signs flashing bright red.
Over the past few years, retail traders have swarmed into the derivatives space, especially index options like Bank Nifty and Nifty 50. Most of them are drawn in by the promise of quick profits and leveraged exposure. However, a SEBI study revealed that 91% of retail traders in derivatives ended up losing money. That’s an alarming statistic. It signaled that the market was becoming speculative rather than investment-oriented.
Additionally, the structure of the market had become heavily tilted towards short-tenure options—weekly, and even daily expiries—turning it into a speculative playground. This over-dependence on weekly contracts resulted in wild swings, sharp intraday moves, and extreme volatility, especially on Thursdays (the weekly expiry day). This environment wasn't healthy—neither for long-term investors nor for the broader financial ecosystem.
SEBI saw this as a structural issue and decided to take bold steps to reform the derivatives market and make it safer, more rational, and more sustainable.
2. SEBI’s Core Reforms: Changing the Game
a) Extending Contract Tenure
One of the biggest problems SEBI identified was the overuse of ultra-short-term contracts. Weekly options had become the norm, with traders focusing on short bursts of market movement rather than making informed investment or hedging decisions.
To counter this, SEBI is planning to extend the tenure of derivative contracts. This means:
Less frequent expiries.
Longer-dated instruments becoming more liquid.
Reduced scope for expiry-based volatility and manipulation.
By pushing the market toward longer expiry contracts (like monthly and quarterly), SEBI wants to encourage thoughtful strategies, proper hedging, and discourage fast-money, short-term gambling.
b) Discouraging Retail Over-Speculation
Retail participation in the F&O market has skyrocketed, but most retail traders don’t fully understand the risks involved. SEBI has already taken several steps to discourage reckless speculation, such as:
Reducing the number of expiries per month.
Increasing the lot size of index futures and options, making it harder for small-ticket traders to over-leverage.
Introducing detailed risk disclosures on broker apps to educate traders about potential losses.
These steps are aimed at protecting small investors and bringing more stability to the market.
c) Focusing on the Cash Market
India’s cash equity market is relatively underdeveloped when compared to its derivatives segment. SEBI aims to rebalance this. By encouraging growth in the cash market, SEBI hopes to reduce the over-reliance on F&O and create a healthier, more resilient market structure.
3. The Jane Street Controversy: What Happened?
In July 2025, SEBI dropped a regulatory bombshell by banning Jane Street, a major US-based high-frequency trading (HFT) firm, from Indian markets. This wasn’t just a slap on the wrist—it was a full-blown interim order with massive consequences.
The Allegations:
SEBI alleged that Jane Street engaged in manipulative expiry-day strategies over a multi-year period. Here’s what SEBI believes happened:
In the morning of expiry days, Jane Street allegedly bought large volumes of index-heavy stocks. This artificially pushed the index higher.
At the same time, they opened short positions in index options, betting that the index would fall later.
In the afternoon, they unwound their stock positions, which pulled the index down.
As the index dropped, their short options positions profited heavily.
This strategy allowed them to make massive profits on expiry days, using their firepower to allegedly manipulate both the cash and derivative markets.
SEBI’s Action:
Barred Jane Street from trading in Indian markets.
Ordered them to deposit over ₹4,800 crore (~$570 million) in suspected unlawful gains.
Accused the firm of using its dominant market position to rig expiry-day movements.
Jane Street, of course, denied the allegations, claiming that their trades were legal arbitrage and part of liquidity provisioning. They are challenging the order in court, but the damage—both reputational and market-wide—has already been done.
4. The Immediate Fallout: Markets Take a Hit
The ban on Jane Street had a chilling effect on the market. Here's what followed:
a) Volume Drops
Jane Street was a major market maker in India’s derivatives space, especially on expiry days. After the ban:
F&O volumes dropped by over 30%.
Index options saw significantly reduced liquidity.
The premium turnover on the NSE fell by nearly 36%.
This wasn’t just a temporary blip. It revealed how dependent the Indian market had become on a few HFT firms to provide liquidity and manage spreads.
b) Volatility Dips
Interestingly, India’s volatility index (VIX) dropped to multi-month lows post the ban. With fewer players like Jane Street aggressively trading expiry moves, the markets became calmer. While this might seem good, too little volatility can reduce trading opportunities and narrow market participation.
c) Wider Spreads and Execution Slippage
With fewer market makers and less volume, traders—especially institutions—began facing wider bid-ask spreads. That means it became more expensive to execute trades, especially in large quantities. This can hurt mutual funds, FIIs, and even large domestic traders.
5. Broader Implications for the Indian Market
a) SEBI’s Strength as a Regulator
This episode showcases that SEBI is serious about enforcing discipline, even if it means challenging a global giant like Jane Street. That sends a strong signal to both domestic and international players: India’s markets are not a free-for-all.
b) Liquidity Vacuum
With Jane Street gone, there's a temporary liquidity vacuum. Other firms are cautious, unsure if they might be targeted next. SEBI needs to strike a balance—encouraging good players while weeding out bad behavior.
c) Investor Confidence and Market Maturity
While retail traders might find the new reforms and lower volatility frustrating, long-term investors and institutions are likely to benefit from a more predictable and transparent market.
6. Legal Battle and Global Ramifications
Jane Street has taken the legal route, depositing the required funds while appealing the SEBI ban. Depending on how the case proceeds:
It could set new legal precedents in Indian market jurisprudence.
It may influence how SEBI handles future cases involving algorithmic or HFT trading.
Other global firms might review or revise their India strategies, balancing opportunity with regulatory risk.
If SEBI wins the case, it strengthens its position as a tough, credible regulator. If Jane Street wins, it may force SEBI to revisit how it defines and regulates market manipulation, especially in the algo/HFT space.
7. What This Means for You (the Trader/Investor)
For Retail Traders:
Expect fewer sharp expiry-day moves. Strategies based on quick, expiry-day scalping may need to be adapted.
Market may feel slower, but potentially safer.
You’ll need to focus more on strategy, research, and planning, instead of gambling on weekly moves.
For Institutions:
Market access costs may rise due to wider spreads.
Less volatility may reduce arbitrage and quant trading opportunities.
Need for more diversified trading models, including participation in the cash and bond markets.
For Market Observers and Policy Thinkers:
This is a rare opportunity to watch a major regulatory shift unfold.
India’s market is transitioning from being a trader’s playground to an investor’s ecosystem.
8. What Comes Next?
SEBI will likely roll out more reforms—stricter monitoring, revised rules for expiry days, and enhanced surveillance.
New market makers may enter the space, possibly Indian firms or global ones with stronger compliance protocols.
Jane Street’s legal outcome will influence how aggressively foreign algo firms operate in India going forward.
✍️ Final Word
The SEBI vs Jane Street saga is more than a single enforcement action—it’s a symbol of India’s market maturity. By reforming derivatives and holding big players accountable, SEBI is trying to create a safer, more balanced market for everyone—from retail investors to institutional giants.
The road ahead may involve some pain—lower volumes, fewer trading thrills—but the foundation being laid could ensure a more sustainable, fair, and globally respected financial market

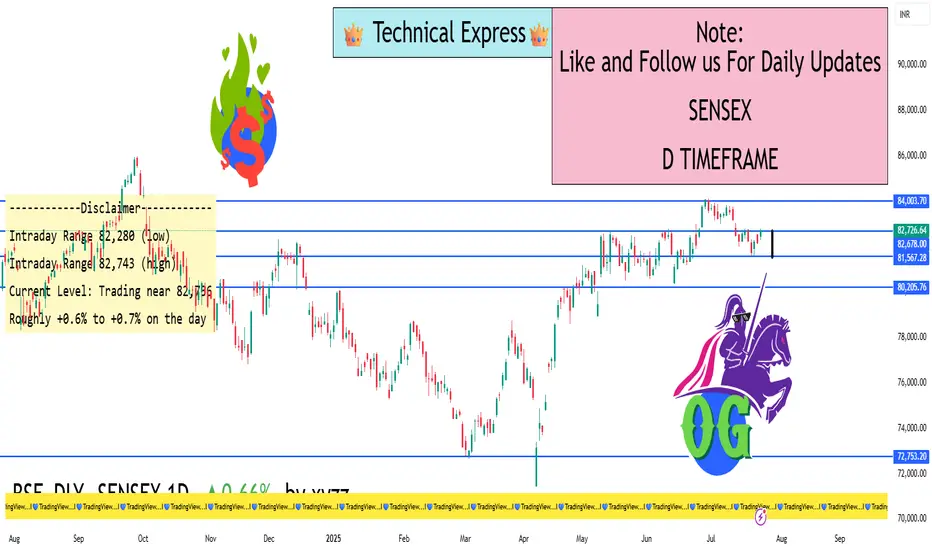
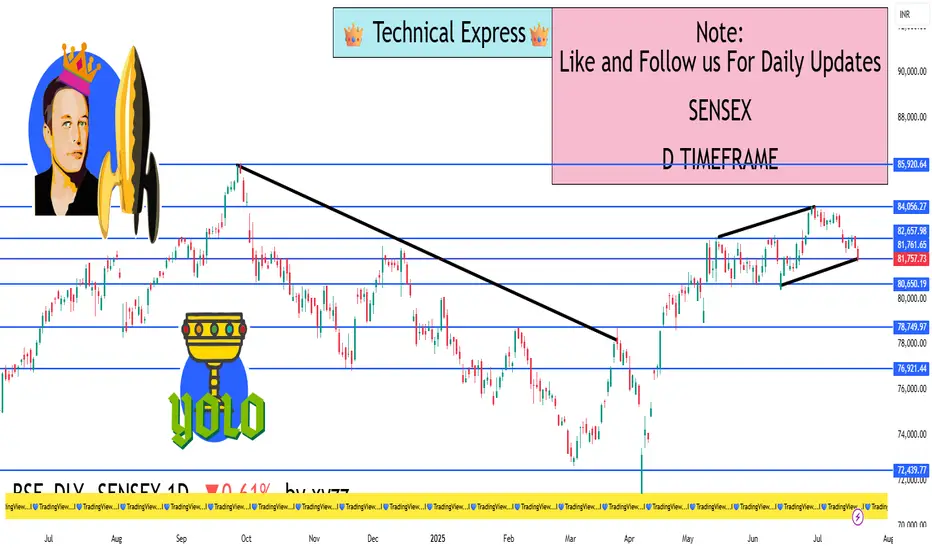
Sensex 1D Timeframe✅ Current Market Status:
Closing Price: ₹82,452.00
Change: –148.32 points
Percentage Change: –0.18%
Day’s Range: ₹82,300.70 – ₹82,892.30
52-Week Range: ₹65,302.20 – ₹83,822.00
🔍 Key Technical Levels:
📌 Support Zones:
Support 1: ₹82,200 – minor trendline support
Support 2: ₹81,800 – recent bounce zone
Support 3: ₹81,000 – strong institutional buying level
📌 Resistance Zones:
Resistance 1: ₹82,900 – intraday high rejected
Resistance 2: ₹83,400 – multi-session top
Resistance 3: ₹83,800 – all-time high zone
🕯️ Candlestick Pattern:
Candle Type: Bearish body with upper wick
Formation: Reversal candle after a small bounce
Implication: Supply seen near highs; indicates hesitation in buying
📈 Indicator Status (1D Timeframe):
Indicator Value & Signal
RSI (14) ~45 – Neutral but slipping downward
MACD Bearish crossover – sellers gaining control
20 EMA ~₹82,780 – Price below this level (short-term bearish)
50 EMA ~₹82,000 – May act as dynamic support soon
📊 Price Structure Summary:
Sensex is in a tight range between ₹81,800 and ₹83,400.
The price rejected from ₹82,900, showing sellers are active.
If ₹82,200 breaks, we might see movement toward ₹81,800 and ₹81,000.
A bullish breakout will only occur above ₹83,400 with strong volume.
🧠 Market Sentiment & Institutional View:
Volatility: Moderate — no extreme panic or euphoria
Volume: Average — no big accumulation seen
Smart Money Activity: Likely waiting near breakout levels or lower discount zones (₹81,000)
🔚 Summary:
🔴 Short-Term Bias: Slightly Bearish
🟡 Key Range: ₹81,800 – ₹83,400
✅ Buyers' Entry Point: Above ₹83,400
⚠️ Sellers' Trigger: Below ₹82,200 or ₹81,800 for more downside
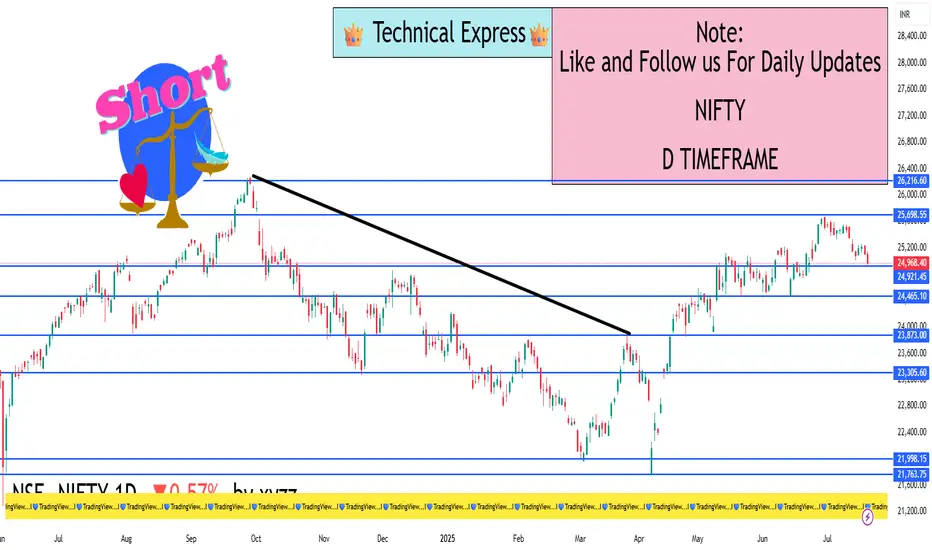
Nifty 1D Timeframe✅ Current Market Status:
Closing Price: ₹24,972.50
Change: –95.20 points
Percentage Change: –0.38%
Day’s Range: ₹24,905.60 – ₹25,095.10
52-Week Range: ₹19,638.30 – ₹25,194.60
🔍 Key Technical Levels:
📌 Support Zones:
Support 1: ₹24,900 – Intraday low and key psychological level
Support 2: ₹24,750 – Previous breakout zone
Support 3: ₹24,500 – Short-term trendline base
📌 Resistance Zones:
Resistance 1: ₹25,100 – Day’s high and minor barrier
Resistance 2: ₹25,200 – All-time high
Resistance 3: ₹25,500 – Next potential rally target if breakout succeeds
🕯️ Candlestick Pattern:
Recent Candle: Bearish candle after range-bound session
Price Action: Failed to sustain above ₹25,100
Implication: Weakness around highs, possible pullback toward support
📊 Market Structure Summary:
Nifty formed a double top near ₹25,200, indicating exhaustion
Currently testing ₹24,900 – if broken, next support is ₹24,750
A breakout will only be valid above ₹25,200 with strong volume
🧠 Institutional Behavior:
Likely profit booking near highs
No major signs of heavy accumulation
May re-enter above ₹25,200 or below ₹24,500 for value buying
🔚 Summary:
🔴 Short-Term Bias: Slightly Bearish
🟡 Watch Levels: ₹24,900 (support) and ₹25,200 (resistance)
✅ Buyers: Wait for breakout above ₹25,200
⚠️ Sellers: Watch for breakdown below ₹24,900 or ₹24,750
Learn Institutional Trading Part-8✅ What is the Trading Master Class?
The Trading Master Class with Experts is a comprehensive and interactive program where seasoned market professionals share their knowledge, trading systems, and live market experience. It’s not just about theory — it's about real techniques that work in today’s volatile and highly manipulated markets.
You’ll learn:
How institutions really move the markets
When and why price reverses (not just where)
How to build your own strategy with risk management
Live chart reading and trade planning with expert commentary
🧠 What You’ll Learn in the Master Class
1. Market Basics to Advanced Concepts
Understand price action, market structure, order flow, and key indicators. Move from beginner to strategic thinker.
2. Smart Money Concepts
Learn how hedge funds and institutions trade. Understand concepts like:
Order Blocks
Liquidity Zones
Fair Value Gaps
Trap Moves & Stop Hunts
3. Live Market Analysis
Watch experts break down charts in real-time. Learn how they spot opportunities, manage risk, and plan entries/exits.
4. Risk Management & Trading Psychology
Know how much to risk, where to place stop-losses, and how to stay disciplined. Learn how pros control emotions and trade with confidence.
5. Strategy Building
You won’t just follow someone else’s setup — you’ll learn how to build your own based on logic and data, not guesswork.
👨🏫 Why Learn From Experts?
Books and free videos can only take you so far. Expert traders bring:
Years of market experience
Real trade breakdowns with proof
Live Q&A support
Mentorship that corrects your mistakes
You get access to tested methods, real examples, and market insight that’s hard to find elsewhere.
🚀 Who Should Join?
New traders wanting proper guidance
Retail traders tired of inconsistent results
Intermediate traders wanting to go pro
Investors looking to add short-term income through trading
🎯 Final Thought
Success in trading doesn’t come from signals, hype, or luck — it comes from education, mentorship, and practice. The Trading Master Class with Experts gives you a shortcut to years of trial-and-error by putting you in direct contact with those who have already mastered the craft.
Join the master class, learn from the best, and take your trading journey to the next level.

Learn Institutional Trading Part-7🎯 What is Institutional Trading?
Institutional trading is the process by which large entities — such as investment banks, hedge funds, mutual funds, and proprietary trading firms — participate in the market using large volumes of capital. These institutions don’t follow the strategies used by most retail traders. Instead, they use techniques that are based on market structure, liquidity, and logic, not indicators or news.
When you master institutional trading, you learn how to think like the smart money. You understand why price moves, not just how. This knowledge allows you to anticipate large moves instead of reacting to them late.
🔍 Key Concepts to Master
✅ Market Structure Phases
Institutions move through four major phases:
Accumulation – Quiet buying or selling in a range
Manipulation – False moves to trap retail traders
Expansion – Sharp move in the real direction
Distribution – Profit-taking while the crowd enters late
Understanding these phases helps you spot entries early and avoid fakeouts.
✅ Liquidity & Stop Hunts
Institutions need liquidity to enter large positions. They often drive price toward zones full of stop-losses or breakout traders, then reverse the market. These areas are called liquidity pools.
Retail traders get stopped out — smart traders enter after the trap, with the institutions.
✅ Order Blocks & Imbalances
Institutions often leave footprints through large unbalanced candles or zones (called order blocks and fair value gaps). These areas act as magnets for future price moves. Mastering these zones gives you high-accuracy entries with solid risk-reward.
💼 Why It Works
Retail traders lose because they follow emotion and indicators. Institutional traders win because they:
Wait for precision setups
Manage risk with discipline
Trade based on logic, structure, and liquidity
Don’t chase trades — they let the market come to them
When you master institutional trading, you adopt this same mindset. You become patient, calculated, and consistent
