BSOFT: Trendline BO, Double Bottom Formation, Chart of the WeekIs NSE:BSOFT Technical Breakout Real? What the Charts Tell You About This Mid-Cap IT Giant's Next Move after Weaking Rupee and Strong Margins Recovery in Q2FY26. Let's Analyze in Chart of the Week.
As per the Latest SEBI Mandate, this isn't a Trading/Investment RECOMMENDATION nor for Educational Purposes; it is just for Informational purposes only. The chart data used is 3 Months old, as Showing Live Chart Data is not allowed according to the New SEBI Mandate.
Disclaimer: "I am not a SEBI REGISTERED RESEARCH ANALYST AND INVESTMENT ADVISER."
This analysis is intended solely for informational purposes and should not be interpreted as financial advice. It is advisable to consult a qualified financial advisor or conduct thorough research before making investment decisions.
Price Action Analysis:
Long-Term Trend Structure:
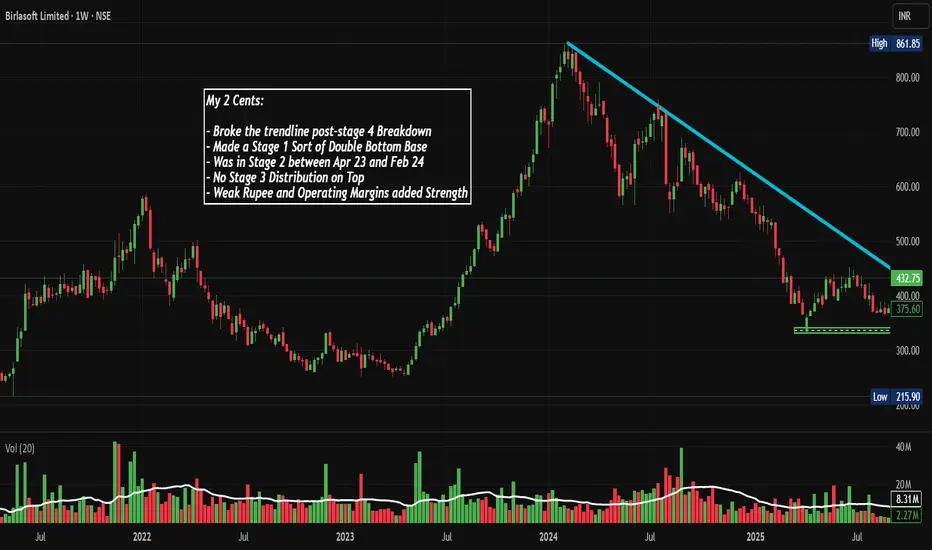
- The stock experienced a strong uptrend from early 2022 to peak levels around ₹861.85 (High) in early 2024, representing a massive rally from the ₹250-300 base
- Following the peak, Birlasoft entered a prolonged correction phase, declining from ₹861.85 to a low of ₹250.25, marking approximately 71% retracement from the top
- Currently trading at ₹432.75 as of December 6, 2025, showing a recent +13.82% bounce
- The stock has been consolidating in the ₹350-450 range for the past several months after bottoming out
Current Price Action Characteristics:
- Recent price action shows signs of accumulation near the ₹350-380 support zone
- The stock broke above a descending trendline (cyan line on the chart) which connected the highs from early 2024 through late 2025
- This trendline break suggests a potential shift in momentum from bearish to bullish
- The green horizontal box at the bottom (₹300-350 zone) appears to mark a strong demand zone where buyers stepped in aggressively
- Post-trendline breakout, the stock has shown resilience with higher lows being formed
Stage Analysis Interpretation:
- The stock broke the trendline after a Stage 4 breakdown
- Formed a Stage 1 type of double bottom base pattern
- Was in Stage 2 Uptrend between April 2023 and February 2024
- No Stage 3 distribution pattern was visible on top
- The presence of weak rupee and improving operating margins has added fundamental strength
Volume Spread Analysis:
Volume Distribution Patterns:
- The volume chart shows significant spikes during key price movements
- Major volume accumulation visible during the decline phase in late 2024 and early 2025, suggesting capitulation
- Recent volume (25.13M) is substantially higher than the average (7.84M), indicating increased participation
- Volume spikes coinciding with the recent rally from ₹350-380 levels suggest genuine buying interest
- The green volume bars in recent sessions indicate buying pressure supporting the upward move
Volume-Price Relationship:
- During the downtrend, volume increased on down days, confirming selling pressure
- At the bottom formation (₹300-350 zone), volume remained elevated but price held ground - classic accumulation behavior
- The breakout from the descending trendline came with above-average volume, validating the move
- Current volume levels suggest institutional interest is returning to the stock
Base Formation and Support Levels:
Base Structure:
- A clear double bottom pattern formed at approximately ₹350-380 levels
- The base formation period spans from mid-2025 to current levels
- This base represents a 5-7 month consolidation, allowing weak hands to exit and strong hands to accumulate
- The green box marked on the chart (₹300-350) represents the primary support zone
Key Support Levels:
- Immediate support: ₹380-400 (previous resistance turned support)
- Strong support: ₹350-365 (double bottom lows)
- Critical support: ₹300-320 (absolute base of consolidation)
- The 52-week low at ₹250.25 acts as a psychological support level
Support Significance:
- The ₹350-380 zone has been tested multiple times and held firm, indicating strong buying interest
- Volume accumulation in this zone suggests institutional accumulation
- Any pullback toward ₹380-400 would be a retest opportunity for the breakout
Resistance Levels:
Immediate Resistance Zones:
- First resistance: ₹450-460 (previous consolidation highs)
- Second resistance: ₹500-520 (psychological level and minor supply zone)
- Major resistance: ₹600-650 (significant supply zone from the downtrend)
- Ultimate resistance: ₹750-800 (prior distribution zone before major correction)
Resistance Analysis:
- The descending trendline, now broken, may act as dynamic support on pullbacks
- The ₹450 level represents a minor hurdle but has been approached multiple times recently
- Breaking above ₹500 would confirm the bullish structure and potentially trigger momentum buying
- The journey to ₹600+ would require sustained buying and improvement in business fundamentals
Technical Patterns:
- Double Bottom Pattern: Clearly visible at ₹350-380 levels with two distinct lows
- Descending Trendline Breakout: The cyan trendline connecting lower highs has been decisively broken
- Rounding Bottom Formation: The overall structure from the peak shows a gradual rounding bottom (Not a Textbook Kind)
- Higher Low Pattern: Recent price action shows formation of higher lows post-breakout (on Lower TF)
Pattern Implications:
- Double bottom patterns typically indicate trend reversal
- The trendline breakout adds conviction to the bullish thesis
- Continuation patterns forming above ₹400 would strengthen the uptrend structure
Risk Considerations:
- Failure to hold above the descending trendline (now support at ₹400-410) would negate the bullish setup
- A break below ₹380 would signal renewed weakness
- The stock must close above ₹450 on good volume to confirm the breakout
Sectoral Backdrop - Indian IT Services Industry:
Current Industry Landscape:
- The Indian IT sector is navigating a challenging demand environment with 77% of providers expecting higher business growth in FY26 compared to last year, driven by growing foundational digital scope, emerging markets, and strategic AI-led demand
- IT exports are expected to cross the $200 billion mark, growing 4.6% year-over-year to reach $224 billion in FY25
- The sector faces uncertainty due to global macroeconomic conditions, with clients delaying discretionary technology spending
- However, IT spending in India is expected to rise 11.1% year-on-year to $161.5 billion in 2025
Emerging Trends and Opportunities:
- AI and digital transformation continue to be major growth drivers across the industry
- Overall IT hiring grew 16% year-over-year in April 2025, driven by AI adoption, cloud modernization, and rapid expansion of Global Capability Centres
- Non-metro cities like Udaipur, Vizag, Coimbatore, and Nagpur are experiencing over 50% IT hiring growth
- Mid-tier IT companies have shown better agility in navigating uncertain macroeconomic conditions compared to larger counterparts
Sector Challenges:
- The sector faces its eighth consecutive quarter of single-digit revenue growth, with weak client spending and reduced digital transformation budgets as main culprits
- Rising H-1B visa fees and Trump tariffs are creating indirect headwinds for the industry
- Life sciences and manufacturing verticals are experiencing softness
- Margin pressures from rising wages, talent shortages, and shift to more onsite work models
Fundamental Backdrop:
Business Overview:
- Birlasoft Limited provides cloud, artificial intelligence (AI), and digital technologies, combining domain expertise with enterprise solutions across banking, financial services, insurance, life sciences, energy resources, utilities, and manufacturing verticals
- The company offers services in customer experience, data analytics, connected products, intelligent automation, blockchain, and generative AI
- In fiscal year 2025, the company achieved consolidated revenue of ₹53,752 million, with the Americas contributing 86.5% of total revenue
- Part of the CK Birla Group, bringing strong promoter backing and group pedigree
Recent Financial Performance:
- Q2 FY25 revenue was $163.3 million, showing 3.1% sequential growth in rupee terms and 2.6% in dollar terms, with year-over-year growth of 4.5%
- Q3 FY25 revenue reached ₹1,383.48 crore, up 0.9% year-over-year but down 1.29% quarter-over-quarter
- EBITDA margin dropped to 12.1% in Q2 FY25 from 14.7% in the previous quarter, partly due to pricing flexibility and increased on-site work
- Net profit was ₹116.10 crore in Q2 FY26, down 8.95% year-over-year but showing 9.09% sequential growth
Operational Highlights:
- The company delivered approximately $300 million in deal signings in the first half of FY25, though lower than the previous year
- Cash and bank balance stood at $221.8 million with operating cash flow of $12.9 million
- Days sales outstanding (DSO) at 58 days remains among the best in the industry
- Workforce strength of approximately 12,500+ professionals with attrition improving to around 11.8%
Key Challenges:
- Life sciences vertical has been underperforming and is expected to remain soft for a couple more quarters
- Manufacturing vertical, the company's largest, experienced project closures and ramp-downs
- Shift in revenue mix toward 51% onsite work has pressured margins
- Customer decision-making delays have affected deal flow and total contract value performance
Positive Catalysts:
- Three of four verticals (BFSI, Life Sciences & Services, Energy & Utilities) delivered sequential growth in Q2
- Management indicates improving pipeline with expectations of better deal flow in H2
- Recent AWS competency achievements in Manufacturing and Industrial Consulting enhance credibility
- CEO Angan Guha's reappointment for another two-year term provides leadership continuity
- Weak rupee environment provides tailwinds for export-oriented revenue
- Focus on improving operational efficiency and margin expansion through offshore shift
Valuation Context:
- Market capitalization stands at approximately ₹10,816 crore
- The stock has corrected significantly from highs, potentially offering better risk-reward at current levels
- P/E multiple compression during the correction phase may present opportunity if earnings stabilize
Overall Technical Assessment:
- The stock has completed a multi-month base formation and broken above a critical descending trendline
- Volume confirmation on the breakout adds credibility to the move
- The double bottom pattern at ₹350-380 provides a well-defined risk level for traders
- Risk-reward ratio favors bulls with clear support and resistance levels
Bull Case:
- A decisive close above ₹500 would open doors for ₹600+ levels
- Improving business fundamentals and sectoral recovery would support the technical breakout
Bear Case:
- Failure to hold the breakout level (₹400-410) would indicate a false breakout
- A breach below ₹380 would negate the bullish setup and potentially retest the ₹350 base
- Weak quarterly results or deteriorating sector conditions could trigger profit booking
My 2 Cents:
NSE:BSOFT presents an interesting technical setup after a prolonged correction. The completion of a double bottom base formation, coupled with a descending trendline breakout on good volume, suggests the worst may be behind for the stock. While fundamental challenges persist in the form of muted demand environment and margin pressures, the company's focus on operational efficiency, improving deal pipeline, and sector positioning in high-growth areas like AI and cloud provide reasons for optimism.
The technical structure suggests that patient accumulation in the current range with strict risk management could be rewarded if the company executes on its operational plans and the broader IT sector demand improves. However, investors should remain cognizant of the challenging macroeconomic backdrop and monitor quarterly results closely for signs of sustainable business improvement.
The confluence of technical breakout and improving operational metrics makes Birlasoft a stock worth watching for both tactical trades and strategic accumulation, provided risk management principles are strictly followed.
Full Coverage on my Newsletter this Week
Keep in the Watchlist and DOYR.
NO RECO. For Buy/Sell.
📌Thank you for exploring my idea! I hope you found it valuable.
🙏FOLLOW for more
👍BOOST if you found it useful.
✍️COMMENT below with your views.
Meanwhile, check out my other stock ideas on the right side until this trade is activated. I would love your feedback.
As per the Latest SEBI Mandate, this isn't a Trading/Investment RECOMMENDATION nor for Educational Purposes; it is just for Informational purposes only. The chart data used is 3 Months old, as Showing Live Chart Data is not allowed according to the New SEBI Mandate.
Disclaimer: "I am not a SEBI REGISTERED RESEARCH ANALYST AND INVESTMENT ADVISER."
This analysis is intended solely for informational purposes and should not be interpreted as financial advice. It is advisable to consult a qualified financial advisor or conduct thorough research before making investment decisions.
Stageanalysis
IZMO: From ₹6 to ₹671 - What's Next? Chart of the MonthNSE:IZMO Why This ₹671 Unknown Indian AI Factory Stock Could Be the Next Multibagger in 2025? Let's analyze in the "Chart of the Month"
As per the Latest SEBI Mandate, this isn't a Trading/Investment RECOMMENDATION nor for Educational Purposes; it is just for Informational purposes only. The chart data used is 3 Months old, as Showing Live Chart Data is not allowed according to the New SEBI Mandate.
Disclaimer: "I am not a SEBI REGISTERED RESEARCH ANALYST AND INVESTMENT ADVISER."
This analysis is intended solely for informational purposes and should not be interpreted as financial advice. It is advisable to consult a qualified financial advisor or conduct thorough research before making investment decisions.
Price Action:
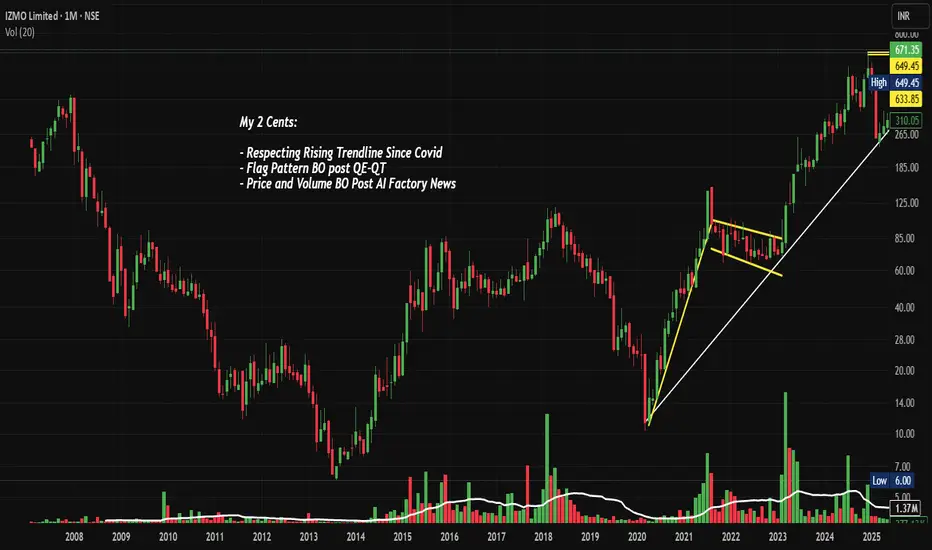
- Current Price: ₹671.35 (as of Aug 31, 2025)
- 52-Week Range: ₹230.00 - ₹738.40
- Stock has demonstrated exceptional momentum with 11,000%+ returns since COVID lows
- Currently trading near all-time highs with strong volume confirmation
Volume Spread Analysis:
- Volume spike evident during recent breakout phases
- 13.5M volume this month, showing active institutional participation
- Volume pattern confirms genuine breakout above resistance zones
- Higher volume on up days indicates accumulation by smart money
Key Technical Levels:
Support Levels:
- Primary Support: ₹633.85 (previous resistance turned support)
- Secondary Support: ₹580-590 zone (trend line confluence)
- Critical Support: ₹520-540 (major demand zone)
Resistance Levels:
- Immediate Resistance: ₹738.40 (all-time high)
- Secondary Resistance: ₹800-850 (psychological levels)
- Extended Target: ₹950-1000 (measured move projection)
Base Formation:
- Multi-year base formation from 2020-2022 (₹20-80 range)
- Clean breakout above ₹100 marked the beginning of the current uptrend
- Stage 2 markup phase with consistently higher highs and higher lows
Technical Patterns Identified:
- Cup and Handle pattern completed on a monthly timeframe
- Ascending triangle breakout above ₹600
- Bull flag consolidation pattern near current levels
- Rising wedge formation within broader uptrend (caution signal)
Sectoral and Fundamental Backdrop:
Company Overview:
- NSE:IZMO is a global leader in automotive interactive marketing solutions, providing hi-tech automotive e-retailing solutions across North America, Europe, and Asia
- Founded by Dinanath Soni and Sanjay Vedprakash Soni in 1995, headquartered in Bangalore
Recent Catalysts:
- The company recently launched its Automotive AI Factory, a breakthrough innovation hub to accelerate AI adoption across the automotive industry
- The AI Factory can deliver enterprise-grade AI capabilities at 70-80% lower cost than Western markets
- The hub will deliver customized AI models that optimize pricing and operations while enhancing customer engagement
Financial Metrics:
- Market Cap: ₹1,000 Crores (up 64.5% in 1 year)
- Revenue: ₹234 Crores, Profit: ₹49 Crores
- Trading at 2.78 times book value and 19.6x P/E
- Promoter holding: 34.95%
Sectoral Trends:
- The automotive industry is increasingly adopting AI-driven solutions
- Digital transformation in automotive retail is accelerating post-COVID
- Growing demand for interactive marketing solutions globally
- India emerging as a cost-effective hub for AI and tech services
Key Risks:
- Recent Q1FY26 results showed a -5.52% QoQ revenue decline and -12.9% QoQ net profit decrease
- Concentration risk in the automotive sector
- Currency fluctuation risk due to international operations
Bullish Factors:
- Revolutionary AI Factory launch provides new growth avenue
- Strong technical breakout with volume confirmation
- Global leadership position in niche automotive marketing space
- Cost advantage in AI solutions delivery
- Multi-year base breakout suggesting sustainable uptrend
Risk Factors:
- Recent quarterly performance decline
- Elevated valuation levels
- Potential for profit-taking near all-time highs
- Sector-specific risks and economic sensitivity
Full Coverage on my Newsletter this Week
Keep in the Watchlist and DOYR.
NO RECO. For Buy/Sell.
📌Thank you for exploring my idea! I hope you found it valuable.
🙏FOLLOW for more
👍BOOST if you found it useful.
✍️COMMENT below with your views.
Meanwhile, check out my other stock ideas on the right side until this trade is activated. I would love your feedback.
As per the Latest SEBI Mandate, this isn't a Trading/Investment RECOMMENDATION nor for Educational Purposes, it is just for Informational purposes only. The chart data used is 3 Months old, as Showing Live Chart Data is not allowed according to the New SEBI Mandate.
Disclaimer: "I am not a SEBI REGISTERED RESEARCH ANALYST AND INVESTMENT ADVISER."
This analysis is intended solely for informational purposes and should not be interpreted as financial advice. It is advisable to consult a qualified financial advisor or conduct thorough research before making investment decisions.
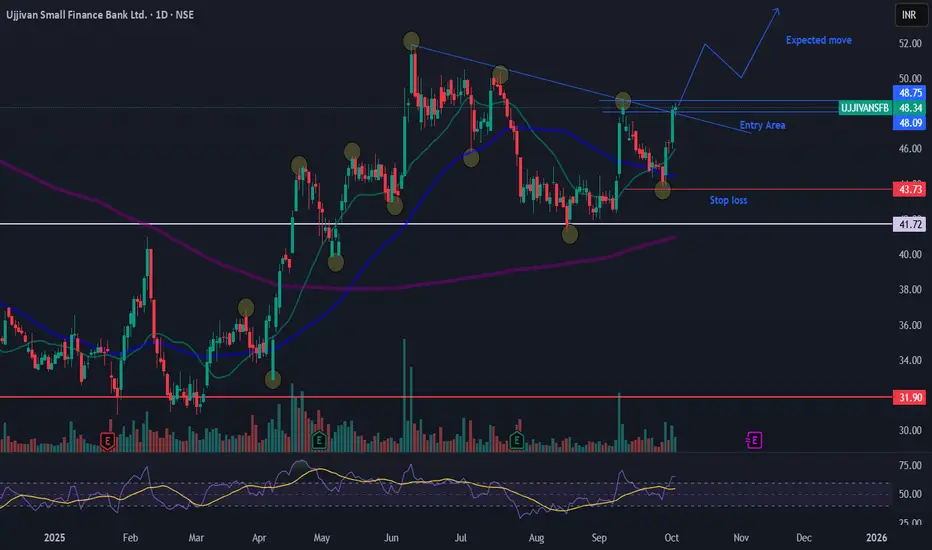
Ujjivan Small Finance Bank Ltd stage 2 continuation breakoutUjjivan Small Finance Bank Ltd stage 2 continuation breakout
Entry 48-49
SL 43.7
Only for journaling, not a trading/investing tip.
This post is for my personal use.
Note : only for learning, not a trading recommendation. i am posting as a trading journal for learning before and after breakout.
NMDC Steel Ltd1. Stage Analysis
The stock has completed a Stage 4 decline (prolonged downtrend).
It then built a Stage 1 base (consolidation in ₹33–₹42 zone for months).
Now, it has clearly broken out into Stage 2 (advancing phase) with a surge in volume.
This is the point where institutional money usually starts accumulating.
2. Price & Volume
Breakout confirmation: Price has broken above ₹43 (previous resistance).
Volume surge: Volume at breakout is significantly higher than average, confirming accumulation.
Pivot level: The ideal pivot was around ₹43–44, and it is now trading above ₹46.9.
Accumulation signs: Tight price ranges in the base before breakout = smart money entry.
3. Relative Strength
RS vs Nifty has turned positive after months of underperformance.
The sector (metals) is also in momentum, adding conviction.
RS line is making new highs before price = strong leadership sign.
4. Risk–Reward & Stop Placement
Stop-loss: Below ₹42 (previous resistance, now support).
Target zone (first leg): ₹52–55 (approx. 15–18% from breakout).
If momentum sustains, long-term potential is ₹65–70 (next major resistance).
📌 Conclusion
Trend: Fresh Stage 2 uptrend (bullish).
Setup: Strong breakout with volume + sector tailwind.
Action: Can be accumulated on dips near ₹45–47 with stop-loss below ₹42. Aggressive traders can buy at the current level with a SL below 45.
Risk/Reward: Favorable (reward 2.5x risk in first leg).
Ideal Holding Period: Short-to-medium term (3–12 weeks) depending on follow-through.

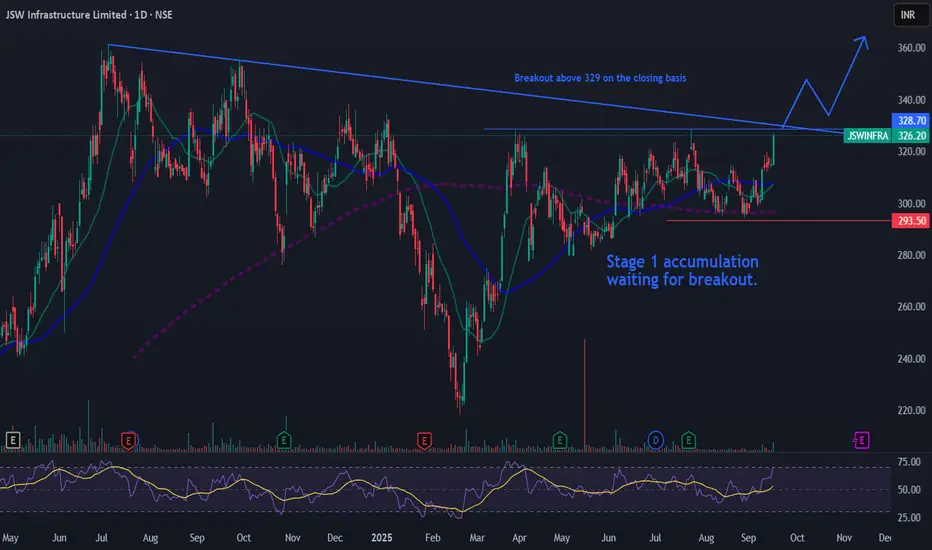
Jswinfra waiting for stage 1 breakoutJswinfra waiting for stage 1 breakout
Entry 329-340
SL 293
Only for journaling, not for a trading/investing.
This post is for my personal use.
Note : only for learning, not a trading recommendation. i am posting as a trading journal before and after breakout.
Ravindra energy stage 1 breakoutRavindra energy stage 1 breakout
Entry 166-173
SL 153
Only for journaling, not for a trading/investing.
This post is for my personal use.
Note : only for learning, not a trading recommendation. i am posting as a trading journal before and after breakout.

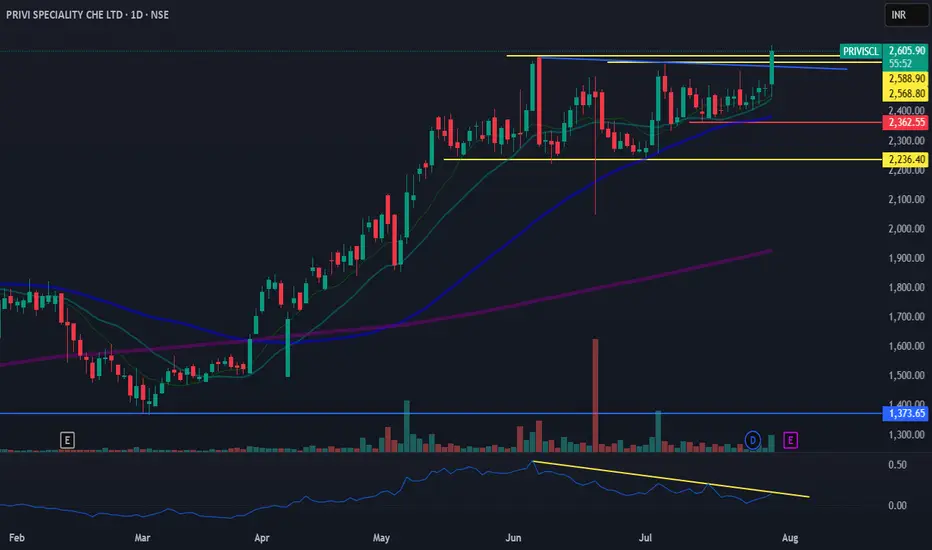
PRIVISCL stage 2 continuation breakoutPRIVISCL stage 2 continuation breakout
Entry 2565-2640
SL 2363
Only for journaling, not a trading/investing tip.
This post is for my personal use.
Note : only for learning, not a trading recommendation. i am posting as a trading journal for learning before and after breakout.
CARTRADE TECH LTD - The Second Race.As linked below, the previous analysis of this stock achieved all the targets in 4 months. It also with stood the sell off in the markets and reclaimed its trajectory at the first sign of market reversal. These are traits of strong stocks. Technically in Stage 2, this stock could see even higher targets but lets set targets step by step. Timely profit booking is also an art. Today it kissed the previous ATH of 2021. Above that a fresh new trend begins.
Talking about fundamentals:
- Company has a low Debt to Equity ratio
- Healthy long term growth as Net Sales has grown by an annual rate of 25.90% and Operating profit at 46.24%
- With a growth in Net Profit of 48.16%, the company declared Very Positive results in Dec 24
- Infact the company has declared positive results for the last 11 consecutive quarters
- OPERATING PROFIT TO INTEREST(Q) Highest at 17.21 times
- PAT(Q) Highest at Rs 42.69 cr.
- Over the past year, while the stock has generated a return of 109.11%, its profits have risen by 39.4%.
- High Institutional Holdings at 74.79%. These investors have better capability and resources to analyze fundamentals of companies than most retail investors. Their stake has increased by 1.15% over the previous quarter.

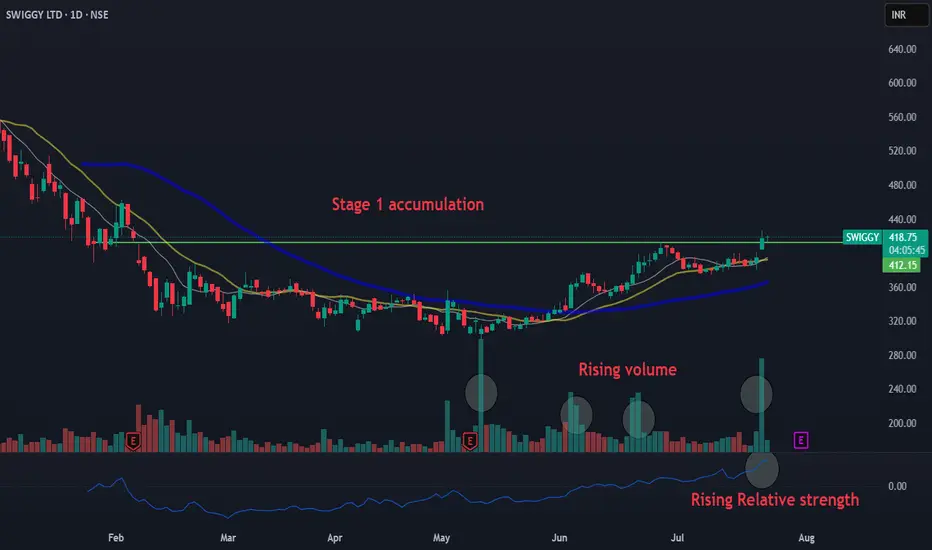
Swiggy stage 1 breakoutSwiggy stage 1 breakout
Entry 411-425
SL 399,389,372
Only for journaling, not for a trading/investing.
This post is for my personal use.
Note : only for learning, not a trading recommendation. i am posting as a trading journal before and after breakout.
Rossari Biotech – Stage 4 Ending? Stage 1 Base in Play!🧪 NSE:ROSSARI – 📉 Stage 4 Ending? Stage 1 Base in Play!
🕵️♂️ Technical Context
Rossari has been in a Stage 4 decline since its 2021 peak. But now it’s forming a solid Stage 1 base between ₹650–720, with signs of smart accumulation emerging.
🧩 Business Model Snapshot
🧵 Segments: Textile Chemicals, HPPC, Animal Nutrition
🛒 New Growth: Institutional & B2C (₹299 Cr, +67% YoY)
🌍 Markets: Strong domestic base, expanding in Middle East & SE Asia
🤝 Client Spread: Diversified, no over-reliance
🎙️ Management Commentary
⚙️ Focus on margin normalization across verticals
📊 Base EBITDA margin ~15% (excl. new segments)
🌐 FX risk control via new geographies (Egypt, Turkey, SE Asia)
🧱 Scaling up I&B2C as a future margin driver
📈 Trend Overview
📆 Monthly: Ending Stage 4 — beginning Stage 1 base
📉 Weekly: Consolidating in a tight rectangle ₹650–750
📅 Daily: Sideways movement; price hugging EMA — coiled for move
🔄 Volume: Subtle uptick — early sign of institutional interest
🧭 Indicators: MACD crossover possible, RSI turning positive
🎯 Trade Plan
💼 Accumulation Zone: ₹650–720
🔓 Breakout Buy: ₹750+ (weekly close + volume)
⛔ Stop-loss: ₹640
🎯 Targets: ₹900 → ₹1,100
📈 Risk-Reward: Up to 1:4.5 🚀
📊 Fundamental Edge
💰 FY25 Revenue: ₹2,080 Cr
🧼 Expanding B2C + Institutional verticals
🏗️ ₹192 Cr CapEx in progress
💹 ROE: ~13%, OPM: ~10%
🧾 Clean governance, no pledges
🟢 Momentum Score: 7/10
📉 Stage 1 base + rising volume
📊 Solid growth fundamentals
🧠 FX/geography risk being managed
📍 NSE: ROSSARI | Sector: Specialty Chemicals
⏳ Watch ₹720 breakout zone – Big move may be coming!
#Rossari #BreakoutStocks #StageAnalysis #SwingTrade #SmartMoney #TechFundamentals #TradingView #SpecialtyChemicals #IndiaEquity #finchoicebiz #markethunt

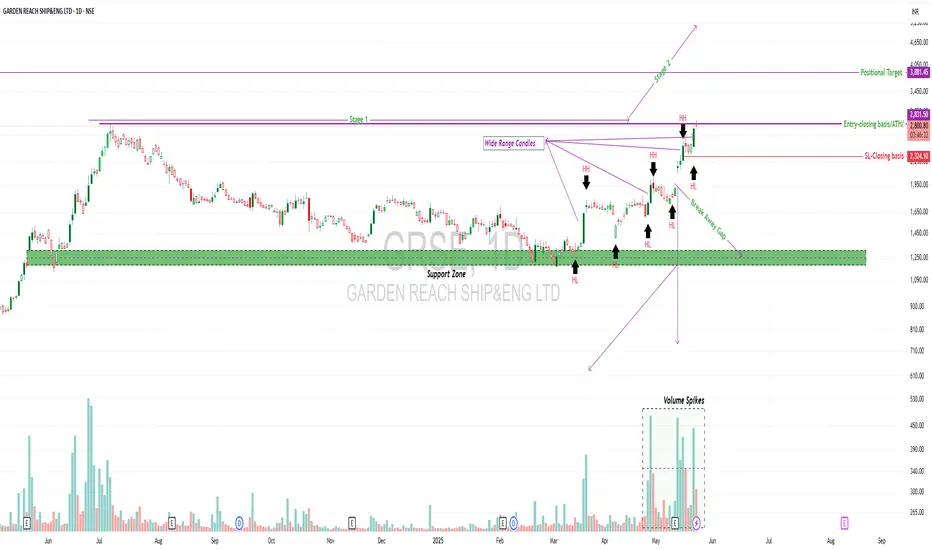
GRSE – Stage 2 Breakout WatchGRSE – Stage 2 Breakout Watch 🚢📈
CMP: ₹2,816
Structure: HH-HL forming | Wide Range Candles | ATH Zone
Stage: Transitioning from Stage 1 to potential Stage 2
Support Zone: ₹1,200–1,300
Breakout Trigger: ₹2,851+ (All-Time High zone)
🧠 Technical View
GRSE is attempting a breakout from a long consolidation base of nearly a year. The structure has turned constructive:
✅ Trading above all key DMAs
✅ Forming Higher Highs & Higher Lows
✅ Wide-range candles on upmoves, shallow pullbacks
✅ Breakaway gap followed by volume spikes
✅ Currently at All-Time High — part of a 1-year trading range breakout attempt
A clean close above ₹2,851 with volume could trigger a Stage 2 breakout, potentially unlocking a new leg of momentum.
📦 Entry Strategy
Add 50% exposure around current levels if comfortable with risk
Wait for retest of breakout zone for additional entry
Stop Loss (Closing Basis): ₹2,324.10
Target Zone: ₹3,880+ (measured move, continuation projection)
🎯 Risk : Reward
Entry: ₹2,816
Stop Loss: ₹2,324.10 → Risk: ~17.45%
Target: ₹3,881.45 → Reward: ~37.83%
📊 Risk : Reward = 1 : 2.17
Clean breakout setup with nearly 2x reward potential compared to the risk — solid structure for swing positioning.
🔍 Fundamentals Snapshot
Market Cap: ₹32,252 Cr
ROCE: 37.3% | ROE: 28.1%
Stock P/E: 61.1 (valuations are not cheap — price strength needs to sustain)
Dividend Yield: 0.33%
Excellent capital efficiency metrics, but don’t over-leverage based on fundamentals alone. Structure > Story.
📈 Sector Outlook + Market Conditions
The defence sector remains in focus, and GRSE is riding that thematic tailwind. However, overall market breadth remains weak, so expect pullbacks. Watch how price behaves during corrections — they could present opportunity if structure holds.
🛡️ Risk Management Notes
Don’t overcommit on a breakout — market volatility can fake moves.
Keep SL tight and re-enter if the structure continues
Trailing stop recommended post-breakout retest
⚠️ Disclaimer
I’m not a SEBI-registered advisor. This content is for educational purposes only. Please do your own research and manage risk based on your financial goals and position sizing strategy.
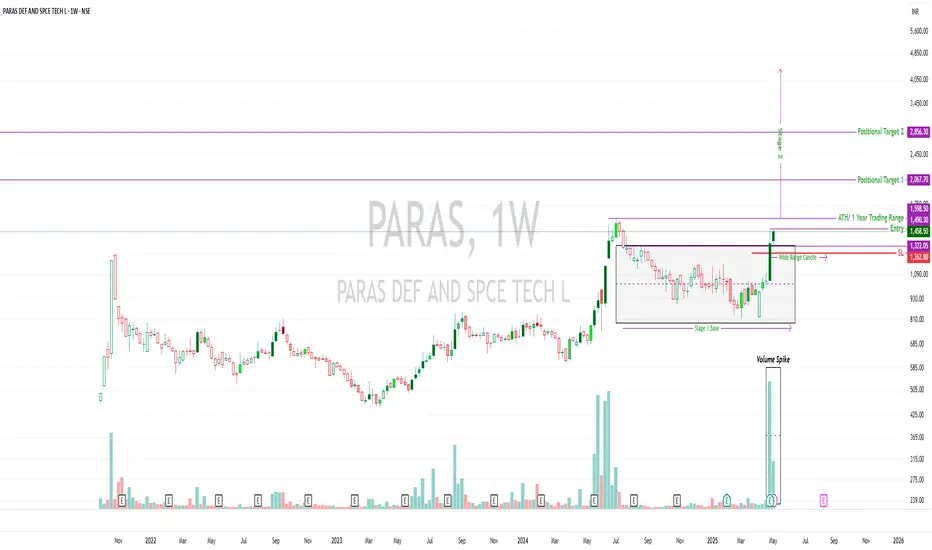
PARAS | Stage 2 Setup in Motion | ATH Watch🚀 PARAS | Stage 2 Setup in Motion | ATH Watch
Paras Defence & Space Tech Ltd | Weekly Chart
🔍 Technical Overview:
Stock has broken out of a Stage 1 base spanning nearly a year 📦
Printed a wide-range breakout candle with a massive volume spike – signs of institutional accumulation
Currently trading above all key DMAs, including the 50D, 200D, and 30W averages
Cleared the ₹1,490–₹1,598 zone (1-year range high), but...
⚠️ ATH Not Yet Broken
₹1,598.5 remains the all-time high (ATH)
A clean breakout + retest + continuation beyond this ATH will offer stronger confirmation for positional targets
Until then, it’s a high-potential but early breakout — watch follow-through closely
📊 Trade Levels
Entry: ₹1,458.5
SL (Closing Basis): ₹1,262.8
Positional Target 1: ₹2,067.7
Positional Target 2: ₹2,856.3
📐 Risk:Reward
Risk = ₹195.7
Reward to T1 = ₹609.2 → R:R = 1 : 3
Reward to T2 = ₹1,397.8 → R:R = 1 : 7
🧠 Notes for Traders:
This is a technically strong breakout from a deep base
But ATH is a major psychological level — wait for confirmation or follow-up strength
No early entries without defined risk, especially in a high-volume breakout
Retests can offer better entries with lower risk exposure
🛡️ Risk Management First
No matter how clean the chart looks, position sizing and stop-loss discipline are non-negotiable.
Trade only what aligns with your system and tolerance. Protect capital first, chase profits second.
📜 Disclaimer: This is a personal technical view. Not investment advice. Always do your own research or consult a SEBI-registered advisor before taking any trade.
#LAURUSLABS - Potential Stage 1 Breakout 📊 Script: LAURUSLABS
Key highlights: 💡⚡
📈 C&H formation in weekly chart.
📈 Price gave a good up move
📈 Went Side Ways, wait for more consolidation near Resistance
📈 Volume spike must be seen on BO
📈 MACD Bounce
📈 One can go for Swing Trade.
BUY ONLY ABOVE NA DCB
⏱️ C.M.P 📑💰- 602
🟢 Target 🎯🏆 – NA%
⚠️ Stoploss ☠️🚫 – NA%
⚠️ Important: Always Exit the trade before any Event.
⚠️ Important: Always maintain your Risk & Reward Ratio.
✅Boost, Like and follow to never miss a new idea! ✅
Disclaimer: I am not SEBI Registered Advisor. My posts are purely for training and educational purposes.
Eat🍜 Sleep😴 TradingView📈 Repeat 🔁
Happy learning with MMT. Cheers!🥂

#SRF - Potential STAGE 1 Break Out (Multi Year Consolidation)📊 Script: SRF
Key highlights: 💡⚡
📈 STAGE 1 - Accumulation formation in Weekly chart.
📈 Price gave a good up move, then went Side Ways
📈 Multi year Price consolidation
📈 Multiple Inside Bars formed in Daily chart
📈 Enter on BO when spike in Volume is seen
📈 MACD Cross Over
📈 One can go for Swing Trade.
BUY ONLY ABOVE 2700 DCB
⏱️ C.M.P 📑💰- 2583
🟢 Target 🎯🏆 – NA%
⚠️ Stoploss ☠️🚫 – NA%
⚠️ Important: Always Exit the trade before any Event.
⚠️ Important: Always maintain your Risk & Reward Ratio.
✅Boost, Like and follow to never miss a new idea! ✅
Disclaimer: I am not SEBI Registered Advisor. My posts are purely for training and educational purposes.
Eat🍜 Sleep😴 TradingView📈 Repeat 🔁
Happy learning with MMT. Cheers!🥂

BIOCON - Swing/Positional Trading opportunity This is a weekly chart to analyze the bigger picture in the stock
One can clearly see that stock is in Stage-2 uptrend with both Key MAs sloping up
Price bouncing from Key MAs (especially 40 week MA)
Volume activity is also favorable as of now
Relative strength of the stock is also high as compared to CNX500 on 52 week basis
Instead of just jumping on to the stock the very next day, I would prefer to wait for a low risk entry so that I can have bigger position with lower SL size.
This is not a recommendation. Pls do your own study before putting any money in any stock.
Share this with your friends if you find this useful.
For more learning stuff related to chart analysis, pls check out my other ideas (some of them are linked below)
You can always reach out to me anytime for any query or feedback.
Keep learning

#SIEMENS: Bearish Setup for NowMy indicator recently gave a SELL signal on #SIEMENS. Here's what the chart indicates:
📉 Technical Overview:
🔹 Triple top pattern formed—a bearish signal.
🔹 Trading below all key moving averages, which are sloping downward.
🔹 Indicates a digestion phase after a strong run-up in the past.
📊 Fundamental Context:
🔹 Fundamentals remain strong, so a reversal wouldn’t be surprising.
💡 My Take:
For now, the chart signals weakness, and I’ll wait for a positive setup before considering any action.
⚠️ Disclaimer:
🔹 This analysis reflects my personal views and is for learning purposes only.
🔹 Not a recommendation to buy or sell—please do your own research or consult a professional.

Stock Analysis: #AZADHello, Traders! 👋
Here’s my take on #AZAD, a stock I’m currently holding:
📈 Technical Overview:
🔹 Volume activity looks promising, indicating growing interest.
🔹 My ILTF indicator signaled a BUY on 5th Nov 2024, and the trend remains favorable since then.
📊 Fundamental Insights:
While I focus on technicals, I also track fundamentals, which for #AZAD appear to be solid and supportive of long-term growth.
💡 Current Position:
As a holder, I’m monitoring both price action and fundamentals closely. My view might be a bit biased, but the setup looks strong for now.
⚠️ Disclaimer:
🔹 I am not a SEBI-registered advisor.
🔹 This analysis reflects my personal views and is not a recommendation to buy or sell.
🔹 Shared for learning purposes only—please do your own research or consult a professional.
What’s your take on #AZAD? Let’s discuss below! 🚀
#TradingView #StockAnalysis #MomentumTrading #AZAD

Bullish Outlook on #AIIL#AIIL Authum Investment & Infrastructure Ltd. has shown a promising breakout from a prolonged consolidation phase, forming a Cup and Handle pattern on the daily chart. Key
observations:
Volume Confirmation: The breakout is accompanied by a significant rise in volume, confirming strong buying interest .
All-Time High Potential: The price is moving toward uncharted territory, suggesting strong bullish momentum.
Support Zone: The consolidation range now acts as a strong support zone for any pullback.
Relative Strength: The stock is outperforming its peers, showcasing superior relative strength.
Recommendation:
Entry Point: Buy on dips near the breakout level (around ₹1,850–₹1,900) for optimal risk-reward.
Target: ₹2,100 and above, based on pattern projections.
Stop Loss: Place a stop loss below ₹1,750 to manage risk.
Authum appears to be in Stage 2 (Advancing), making it an attractive candidate for positional traders. Fundamentals and further price action will dictate long-term potential.

AIAENG#AIAENG - Add to Watchlist
Key Observations
Base Formation: The stock is currently forming a base, indicating a period of consolidation after a previous trend.
Price to Volume Anomaly: There's a noticeable anomaly in the price-to-volume ratio, suggesting that the stock's price movement is not entirely in sync with its trading volume.
Accumulation: The analysis suggests that there's significant accumulation (buying) happening at current levels, which could be a bullish sign.
Next Steps
Monitoring: I am planning to closely monitor the stock's movement in the coming days.
Entry Decision: Based on the stock's behaviour, I will decide on a potential entry point.

Wipro Gearing Up for a Stage 2? Add to your WL.After the bonus issue, Wipro is setting up again
-Forming a base right at a resistance level.
-Narrow Range candles.
-Dry Volume.
-Stock is in an uptrend.
-Could be a potential stage 2
Wait for the entry to trigger for a fresh entry. Wait for a confirmation of stage 2.
Entry: Above 315
SL: 283 day closing basis.
Risk- 9.7%
Potential Reward: 18%
RR: 1:1.9
A word of caution: The Quarterly earning releases are due on January 8.
Watch the Price action near the T1 ( 371) for further addition to the existing position or for fresh entry. Lock some profit at T1.

Riding Momentum with Precision – CRISIL Up 24%!Momentum is the lifeblood of profitable trades. My strategy identifies high-momentum Stage 2 stocks that are ready to outperform, combined with a time-tested exit mechanism to cap drawdowns.
Take CRISIL , for example. Entry was triggered perfectly, and we’re already up 24%!
This is not about chasing every move in the market—it’s about betting on individual high-performance stocks that move irrespective of market conditions. The strategy thrives even in sideways markets because momentum is always king.
What You Get:
Simple buy/sell signals.
Automatic entries and exits with defined risk.
Focus on high-conviction stocks (max 10-stock portfolio).

Time to Buy/Bottomfish #cochinship ?At this juncture cochin Shipyard offers good RR. From a deep price and Time correction, the stock formed a base and broke out of it and showing signs of reversal. A potential stage 2.
The reasons for going long are as follows.
-Stage 2 Breakout
-Formed Double Bottom in DTF
-Narrow Range candles with Dry Volume
- Channel Breakout.
Keep In mind:
- Volumes need to improve.
-Expect Shakeouts.
Tweak the SL as per your risk appetite. Like I mentioned in the beginning, if this is a reversal then the reward will be high.
As always- Please study the chart and do your due diligence. And please do not trade on any tips. Enter only if you understand the company, the chart and the price.
#StocksInFocus

Dhani aiming for a stage 2??#Dhani
After a long downtrend, started the uptrend and is now at a 2-year resistance forming CNH. If broken out then this could be a potential stage 2 candidate.
Keep on the radar as a positional pick. SL is very deep so position the size accordingly and manage the risk.
The chart shared is just to notify you of this setup and is not a buy-sell recommendation.
DLong
