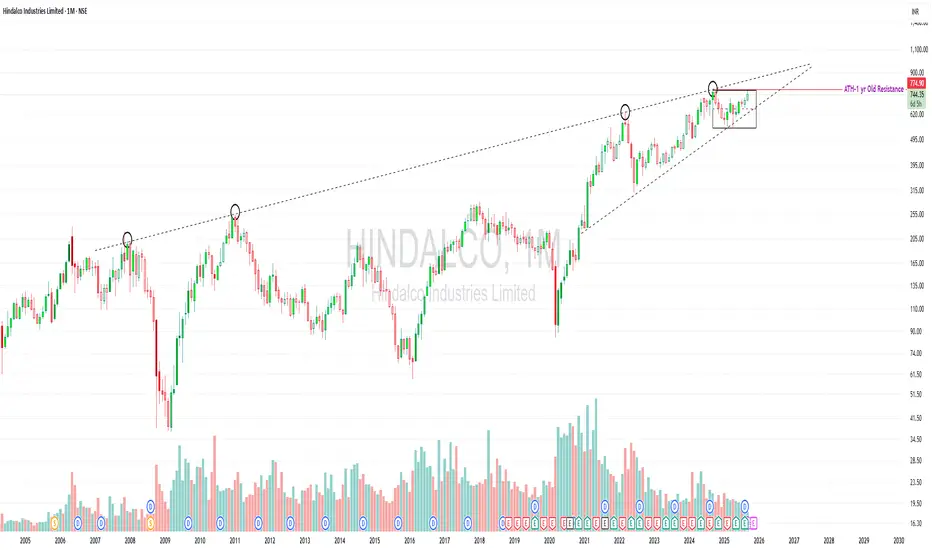
Hindalco – Monthly Chart | Educational View
Near ATH, testing a 20-year trendline — worth studying.
Price is trading inside a long-term rising wedge.
The upper trendline has acted as resistance multiple times (2007, 2011, 2022, and now).
Currently consolidating in a tight range near ATH (~₹775).
Volume needs improvement — a decisive breakout above resistance should ideally come with strong volume confirmation.
⚠️ Risks / Watch-outs:
Rising wedge patterns can also resolve downwards if breakout fails.
Repeated rejections from the same long-term trendline may trigger profit-taking.
Without big volume, any breakout attempt may not sustain.
💡 Learning Point: Long-term trendlines and volume behavior are crucial in studying potential breakouts vs. failed attempts.
⚠️ Disclaimer: This post is for educational purposes only. It is not a buy/sell recommendation or financial advice. Please do your own research or consult a SEBI-registered advisor before making investment decisions.
Stanweinstein
NMDC Steel Ltd1. Stage Analysis
The stock has completed a Stage 4 decline (prolonged downtrend).
It then built a Stage 1 base (consolidation in ₹33–₹42 zone for months).
Now, it has clearly broken out into Stage 2 (advancing phase) with a surge in volume.
This is the point where institutional money usually starts accumulating.
2. Price & Volume
Breakout confirmation: Price has broken above ₹43 (previous resistance).
Volume surge: Volume at breakout is significantly higher than average, confirming accumulation.
Pivot level: The ideal pivot was around ₹43–44, and it is now trading above ₹46.9.
Accumulation signs: Tight price ranges in the base before breakout = smart money entry.
3. Relative Strength
RS vs Nifty has turned positive after months of underperformance.
The sector (metals) is also in momentum, adding conviction.
RS line is making new highs before price = strong leadership sign.
4. Risk–Reward & Stop Placement
Stop-loss: Below ₹42 (previous resistance, now support).
Target zone (first leg): ₹52–55 (approx. 15–18% from breakout).
If momentum sustains, long-term potential is ₹65–70 (next major resistance).
📌 Conclusion
Trend: Fresh Stage 2 uptrend (bullish).
Setup: Strong breakout with volume + sector tailwind.
Action: Can be accumulated on dips near ₹45–47 with stop-loss below ₹42. Aggressive traders can buy at the current level with a SL below 45.
Risk/Reward: Favorable (reward 2.5x risk in first leg).
Ideal Holding Period: Short-to-medium term (3–12 weeks) depending on follow-through.

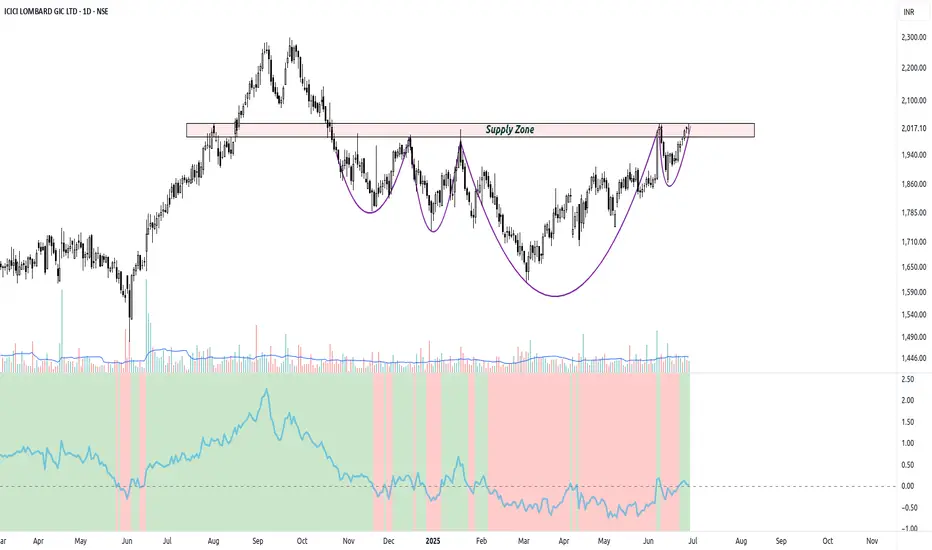
ICICIGITechnical Analysis Breakdown:
1. Rounded Bottom + Multi-stage Base Formation
The stock has carved out a long rounded bottom, forming three notable cup-like bases over the past year.
Each time the price pulled back, it found support near key demand zones (highlighted in blue), forming higher lows — a sign of accumulation.
The current price action shows a smooth rounding structure that suggests growing buyer interest and waning seller pressure.
2. Supply Zone Test in Progress
Price is now approaching a strong supply zone (~₹2,030–2,050), where it has previously faced rejection multiple times.
The presence of long wicks in this zone in the past signals institutional selling pressure.
Watch for a decisive breakout with strong volume to confirm that supply has been absorbed.
3. Relative Strength Turning Up
The RS line vs Nifty has moved into positive territory after several months of underperformance.
This shift is crucial — especially if confirmed on the weekly chart — it implies sector rotation or renewed leadership from ICICIGI.
4. Moving Averages in Bullish Alignment
The stock is now trading above all key moving averages (20, 50, 100, 200 EMA), all of which are curling upwards.
This signals a strong trend resumption, especially as the 200 EMA acts as long-term support.
The breakout above the 200 EMA (around ₹1,940) was a major structural shift.
5. Volume and VCP Context
Recent price action shows tighter price ranges with reduced volatility near resistance, a characteristic of Volatility Contraction Pattern (VCP).
Volume has remained subdued but consistently stable, which is constructive as long as it expands on breakout attempts.
Interpretation & Trade Strategy
✅ Bullish Scenario:
A strong breakout above ₹2,050 with above-average volume can lead to a fresh rally, possibly retesting the previous all-time high zone (₹2,250+).
Follow-up candle should ideally close strong with range expansion.
⚠️ Risk Management:
Any rejection around ₹2,030–2,050 accompanied by high volume selling could lead to another correction within the base.
Traders should be cautious of false breakouts and manage entries based on volume confirmation or wait for a pullback entry near ₹1,970–1,990 if risk/reward improves.
📝 Conclusion
ICICIGI is showing classic signs of long-term accumulation, emerging strength, and trend reversal.
With the supply zone being tested now, the stock is at a critical inflection point. If buyers can overcome this hurdle with conviction, ICICIGI may rejoin the list of strong performers in the insurance space.
📌 Watch for:
Volume confirmation on breakout
Retest and hold of the ₹2,000–2,020 zone
RS staying above zero
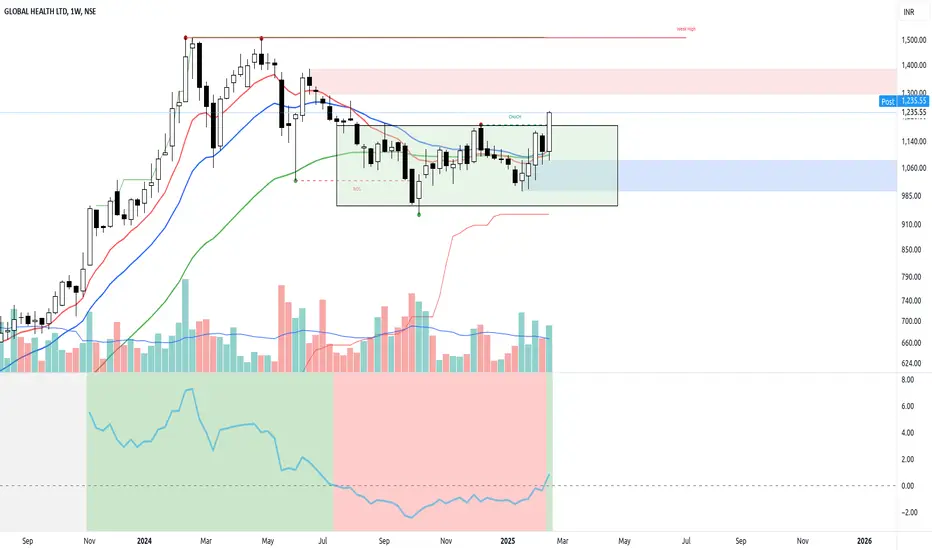
MEDANTA – Strong Breakout After 6-Month Base! #MEDANTA – Strong Breakout After 6-Month Base! 🚀
✅ Bullish Momentum Building! #Medanta (GLOBAL HEALTH LTD) has broken out of a 6-month consolidation base with above-average volume, signaling renewed buying interest.
Key Technical Highlights:
Breakout Confirmation: Price has decisively moved above its 6-month base, indicating strength.
Volume Surge: The breakout is supported by above-average volume, confirming strong accumulation.
Relative Strength vs. Nifty: Turned positive, showing outperformance and potential trend continuation.
Moving Averages: Price is trending above key moving averages, reinforcing bullish sentiment.
Trading Plan:
📌 Entry: Looking for sustained price action above the breakout zone.
📌 Stop Loss: Below key support levels to manage risk effectively.
📌 Targets: Monitoring for potential upside continuation based on past price structures.
Final Thoughts:
With a strong base breakout, volume confirmation, and positive relative strength, Medanta is showing strong momentum. I expect the stock to continue its upward move and will be watching closely for further confirmation.
📢 Do you agree with this breakout? Share your insights below! 🔥
CLEAN SCIENCE - About to enter Stage-2 after big Accumulation ? The analysis is done on Weekly TF.
The purpose of sharing this analysis is to make viewers understand the stage concept
Legendary Trader - Stan Weinstein has introduced this concept of Stage analysis of a stock.
A stock goes through 4 stages in its lifetime and the cycle repeats.
Check below charts to understand the concept and results better -
1) CAMS -
2) GUJGASLTD -
The stock - CLEAN SCIENCE has been in accumulation phase for more than 570 days and now seems to be coming out of its stage-1 and entering into Stage-2
A stock moves fastest in its stage-2 and hence a stock entering stage-2 should always be on our radar for opportunities if we want to make good money.
This concept of Stage analysis has been used by many traders/investors like Mark Minervini and others.
The above analysis is purely for educational purpose. Traders must do their own study & follow risk management before entering into any trade
Checkout my other ideas to understand how one can earn from stock markets with simple trade setups. Feel Free to comment below this or connect with me for any query or suggestion regarding this stock or Price Action Analysis.

Don't miss this - A market leader is available at a good price. How to do good in the markets ? - Buy low and sell high :-D
Well, in this article, I will try to explain how can you really do well in the markets, practically. Not just an advice like - Buy low and sell high.
Here's an explanation for this analysis:
Fundamental:
1. A Market leader - Castrol is the second highest market share holder with more than 20% market.
2. Very strong Fundamentals - These numbers are just dream for any company. The below figures are twice as good as any competitors in this business.
ROCE - 60.8 %
ROE - 45.9 %
3. Consistent profit growth.
There could be other parameters also, but I am highlighting the above three for fundamental analysis.
Technical:
1. Huge buying force: A good share is known for performance and this has given 600% from the listing. Which is significant.
2. Correction: 60% correction from the top which catches my attention to notice a good share.
3. Base formation: Like my other analysis, I like to see a good base formation for a decent time frame. Here, the stock stops making lower lows and starts showing the sign of strengths.
4. Breakout: The dream begins here. As per Stan Weinstein (whom I have learnt a lot from), this is the stage 1 breakout. Here the stock shows first sign of strength again.
Summary: If the stock confirms the breakout above 148-150 on the monthly charts, it can be a good entry location for the long term.
Please understand that, nobody can make you rich by just giving you a share name, it is you who should understand your inner self and play the games by your own rules. !!

IRCTC#IRCTC - Is close to breaking out from the long base. RS has entered the positive zone after a long time. Hope the stock manages to close above the zone and enter stage 2.

If you like Stan Weinstein - then you need to track this stock
As per Stan Weinstein methodology, stock is in late stages of accumulation
Trading above 30 Week EMA
People following that methodology will be keeping a sharp eye on this stock.
From EW - Price has reached the resistance level in a clean 5 wave rise, after completing a 78.60% retracement of the whole rise since its listing.
Any retracement would offer good entry point.
Lets see how this develops.

Stages of stock market cycleNSE:SRTRANSFIN
stock market stages by Stan Weinstein
Most important rules to grow and protect capital :
1) only go long when stock is in confirmed stage 2
2) never hold a stage in stage 4

Cerebra integrated- Stan Weinstein modelStan Weinstein framework:
1) Price above rising 30 Wma
2) Rising relative strength
3) Volume expansion during breakout
4) no prior resistance, stock consolidating at all time high level
entry above 86
sl below 77

Stan Weinstein framework for investorsSW criteria for multibagger stocks :
1) BO above rising 30 Weekly moving average
2) Volume expansion during BO
3) Rising relative strength
4) no significant prior resistance over last 2 years

DIXON Technologies | A Point of viewPossibilities hereon:
1) Continuation of Stage 3 & then enter Stage 2.
2) If Weekly close below 30EMA then
Stage 4 -Downtrend & then enter Stage 1 again.
Let see how things unfold.
Any other view, suggestions are welcome.
