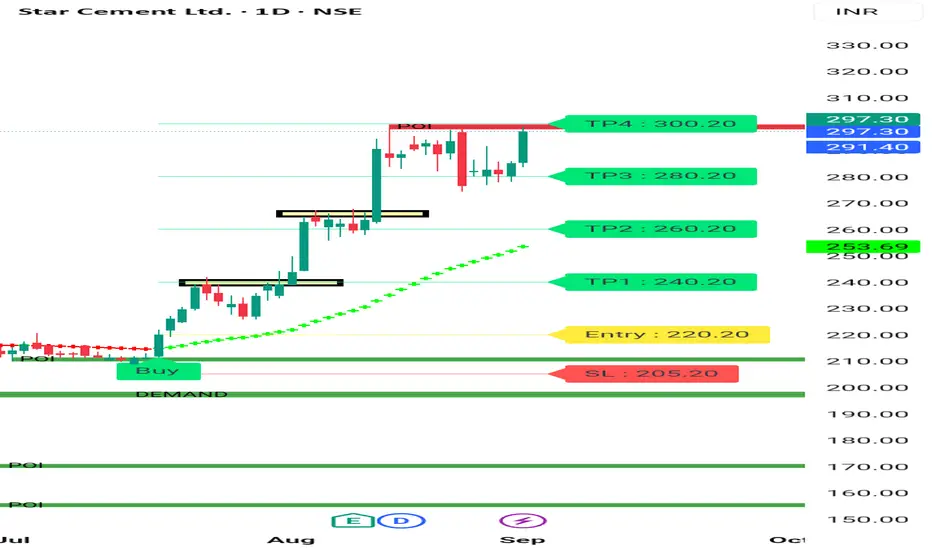
STAR CEMENT BREAKOUT/ Bullish Structure Star cement is good Stock fundamentally as well as Technicaly. It's moved from 220 to 297 . It's moving in a pattern you can see in chart . Now again it's at breakout level of its give movement above 300 then again 4 -5% move may give very fast . It's a high Momentum Stocks.
About company
Star Cements Ltd is engaged in manufacturing and selling of Cement Clinker & Cement. It sells its products across north-eastern and eastern states in India. It is the largest cement manufacturer in North-east India.
Key Points for star cement
Product Offerings
Ordinary portland cement (OPC), Portland Pozzolana cement(PPC), Anti-rust cement (ARC), Portland Composite Cement (PCC) and Weather Shield Cement (WSC)
Market Share
The company is the largest cement player in North-east India with ~24% market share. Star Cement has one of the finest limestone reserves.
Business-wise Sales
In Q1FY23, trade sales (sales to distributors & dealers) accounted for 86% of revenues while non-trade sales (sales to direct customers) accounted for the remaining 14% revenues.
Manufacturing Capabilities
Co. has 6 manufacturing facilities out of which 3 are situated in Meghalaya and 2 in Assam and 1 in West Bengal. The production capacities are as follows -
Clinker: 2.8 MTPA
Cement: 5.7 MTPA
Power: 51 MW & 12.3MW WHRS
The company plans to take cement capacity
to ~10MTPA by FY26.
Improvement in Capacity Utilization
The capacity utilization of the clinkerisation units was at ~86% during the FY22 as against ~75% during FY21.
Capex Plans
The company plans to expand:
A 3.3 MTPA clinker unit with 10 MW WHRS at
Lumshnong for ~Rs. 1,300 Cr.
B Two grinding units and 800 TPD AAC block
plant in Assam for ~Rs 950 Cr.
C 24 MW Captive solar power plant in
Guwahati, Assam for ~Rs 110 Cr.
STARCEMENT
STAR CEMENT LTD | Strong Breakout After Long-Term Consolidation 📝 Description:
📌 Stock: STAR CEMENT LTD (NSE)
📅 Timeframe: 1D (Daily)
📈 Breakout Date: 04-Aug-2025
💼 Sector: Cement / Infrastructure
⚡️ Technical Setup:
Breakout Above Long-Term Resistance:
Price has finally broken through the ₹240–₹256 resistance zone, which had capped upside for nearly a year.
Strong Volume Confirmation:
The breakout is accompanied by a significant rise in volume, adding credibility to the move and indicating strong buyer interest.
Bullish Market Structure:
Price has shifted into a higher high–higher low structure over the last few weeks, confirming momentum build-up.
Range Built-Up Base:
Price consolidated within ₹190–₹240 for over 10 months, creating a solid foundation for the breakout.
🔍 Key Observations:
📊 Chart Pattern:
The chart shows a horizontal breakout from a long-term consolidation zone between ₹240–₹256. This breakout signals a bullish continuation, as the stock pushes above a multi-month supply zone with strong momentum.
📈 Recent Price Action:
• The stock gave a clean breakout on 04-Aug-2025, closing above the resistance zone required with strong follow-through.
• The rally was supported by 2.5× surge in volume, indicating institutional interest.
• Price structure shows confirming trend reversal from range-bound to bullish.
• This breakout comes after 10+ months of consolidation, adding more weight to the move.
Add-ons:-
✅ Clean breakout with follow-through above ₹256.
🔼 No immediate supply zone until ₹280–₹290 range.
🔁 ₹240 now becomes a key support level.
📊 Increasing volume supports institutional accumulation possibility.
📌 Trade View:
Aggressive Entry:
• Entry around current levels if price holds above the breakout zone (₹256+).
• Use a stop-loss as per your risk plan.
Conservative Entry:
• Wait for a retest of the breakout zone (₹240–₹256) with confirmation through price action and volume support.
• Ideal for traders preferring high conviction and lower risk.
•Bias: Bullish
•Support: ₹240 (flip level), ₹225 (minor swing)
•Invalidation: Close below ₹240
🧠 Rationale:
The long base, clean breakout, and strong volume together suggest a high-probability bullish continuation. Absence of nearby resistance offers a decent runway towards the ₹280–₹290 zone. This move is also backed by strength in the broader cement sector.
🚨 Disclaimer: This is not financial advice. All views are shared for educational purposes only. Always do your own research and manage risk responsibly before making any trading decisions.
What is your view please comment it down and also boost the idea this help to motivate us.

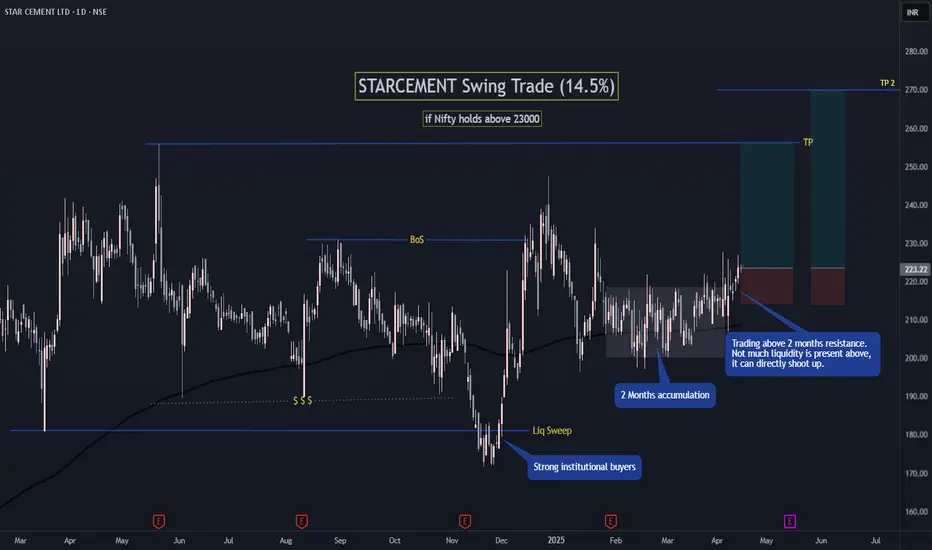
STARCEMENT Swing Trade (14.5%)If Nifty holds above 23000 then Star Cement can go 14.5% to 20% up.
It sweeped major liquidity at a demand zone and gave a BoS, which shows a bullish trend.
From last 2 months the price was consolidating in a zone, but now price has started trading above the resistance of this zone.
Not much liquidity is present above. Price can directly shoot up to ATH.
with1:3 minimum RR.
Follow for more such setups.
2 Amazing swing trading ideas for 24 December MarketsI daily make educational content videos for swing / positional trading
The first stock which is Raymond, is making a symmetrical triangle pattern, It is a volume-based price action and pattern trade idea, its also making a parallel channel which is important to watch before the big breakout candle comes ( if at all )
The second stock, Star Cement, is making a random pattern but more of a solid volumes and price movement type trade. It needs the breakout of my hidden line resistance to be on a weekly time frame.
Follow the Risk management rules and good luck trading.

Star Cement - On the Verge of BreakoutStock making a comeback with Highly unusual volumes
235-242 Strongest resistance area currently
210 Can be considered as excellent support as of now
Small resistance at 255, if taken out, it may reach 300 soon

🌟A Deep Dive into STARCEMENT: A Classic Case of Buy on Retest📊 Chart Analysis Overview
The technical chart of STARCEMENT presents a fascinating tale of consistent trading patterns that can intrigue both novice and seasoned traders. By deciphering these patterns, we can unearth potential trading opportunities. Here's a deep dive into the stock's behaviour on the chart:
🚀 Key Observations from STARCEMENT's Chart
Recurring Breakout Retests: One of the most striking features observed in STARCEMENT's chart is the pattern of breakout retests. Historically, after each significant breakout, the stock prices have tended to pull back to retest the breakout levels. This behavior has been a recurrent theme and provides a clear insight into the stock’s momentum.
Formation of New Highs: Post-retest, STARCEMENT often manages to carve out new highs. This suggests a strong underlying market sentiment favouring the stock, thereby indicating a bullish outlook in the wake of each retest.
Volume Insights: Throughout these phases, an intriguing aspect is the volume dynamics. The volumes recorded during the retest phases are unusually low. This low volume retest of breakouts is classic and indicative of a less aggressive retracement, which is a positive signal for bulls in the market.
📊 Key Financial Indicators
Market Position : Prominent with a market cap of ₹8,941 Cr.
Debt Status : Nearly debt-free, enhancing its financial stability.
Operational Performance : ROCE at 16.8% indicates efficient use of capital.
Profitability Issues : ROE is moderate at 10.8%, reflecting average equity returns.
🚀 Strategic Trading Tips
Buying Strategy : Considering the historical success of buying on retests, entering a buy trade at current levels could be advantageous.
Stop Loss Strategy : To manage risk effectively, it's prudent to place a stop loss just below the significant support marked by a thick red line on the chart.
📊 My thought
The STARCEMENT stock chart is a classic example of how consistent technical patterns can offer actionable insights. Given the recurring nature of breakout retests with low volume, coupled with the stock’s ability to forge new highs post-retest, the current scenario suggests a favorable buying opportunity. As always in trading, while the historical patterns can guide us, it's crucial to stay alert and responsive to any new market developments.
Lastly, Thank you for your support, your likes & comments. Feel free to ask if you have questions.
Remember, every successful trader keeps an eye on the past but focuses on the future! 🌟 Keep trading smart and stay optimistic!
Please note that this analysis is for educational purposes only and I am not a SEBI registered analyst.

Star Cement Ltd - Long Setup, Move is ON...#STARCEMENT trading above Resistance of 208
Next Resistance is at 300
Support is at 140
Here are previous charts:
Chart is self explanatory. Levels of breakout, possible up-moves (where stock may find resistances) and support (close below which, setup will be invalidated) are clearly defined.
Disclaimer: This is for demonstration and educational purpose only. This is not buying or selling recommendations. I am not SEBI registered. Please consult your financial advisor before taking any trade.

STARCEMENT - Breakout Setup, Move is ON..NSE:STARCEMENT
✅ #STARCEMENT trading above Resistance of 204
✅ Next Resistance is at 260
Related charts:
Charts are self-explanatory. Levels of breakout, possible up-moves (where stock may find resistances) and support (close below which, setup will be invalidated) are clearly defined.
Disclaimer: This is for demonstration and educational purpose only. This is not buying or selling recommendations. I am not SEBI registered. Please consult your financial advisor before taking any trade.

STARCEMENT - Ichimoku BreakoutStock Name - Star Cement Ltd
Ichimoku Cloud Setup :
1). Today's close is above the Conversion Line
2). Future Kumo is Turning Bullish
3). Chikou span is slanting upwards
All these parameters are showing bullishness at Current Market Price
and more bullishness AFTER crossing 175
#This is not Buy and Sell recommendation to any one. This is for education purpose and a helping hand to learn trading in Market.
#CloudTrading
#IchimokuCloud
#IchimokuFollowers
#Ichimokuexpert
I hope you all like my analysis.
Please do share your thoughts into comment section.
Please give a like, share & subscribe for daily analysis.

STARCEMENT - Long Setup, Move is ON..NSE:STARCEMENT
✅ #STARCEMENT trading above Resistance of 171
✅ Next Resistance is at 204
Related charts:
Charts are self-explanatory. Levels of breakout, possible up-moves (where stock may find resistances) and support (close below which, setup will be invalidated) are clearly defined.
Disclaimer: This is for demonstration and educational purpose only. This is not buying or selling recommendations. I am not SEBI registered. Please consult your financial advisor before taking any trade.

STARCEMENTSTARCEMENT :- The stock has given a breakout after 3 months of consolidation
Hello traders,
As always, simple and neat charts so everyone can understand and not make it too complicated.
rest details mentioned in the chart.
will be posting more such ideas like this. Until that, like share and follow :)
check my other ideas to get to know about all the successful trades based on price action.
Thanks,
Ajay.
keep learning and keep earning.

STARCEMENT - Bottom Triangle chart patternBottom Triangle chart pattern formed on Star Cement Ltd .
The pattern formed over 25 days which is roughly the period of time in which the possibility price range may be achieved, according to standard principles of technical analysis.
Tells Me: The price seems to have reached a bottom, showing signs of reversal as it has broken upward after a period of uncertainty or consolidation.
PLEASE NOTE THAT:
This chart analysis is only for reference purpose.
This is not buying or selling recommendations.
I am not SEBI registered.
Please consult your financial advisor before taking any trade.

STARCEMENT - Bullish Swing ReversalNSE: STARCEMENT is closing with a bullish swing reversal candle supported with volumes.
Today's volumes and candlestick formation indicates strong demand and stock should move to previous swing highs in the coming days.
The stock has been moving along the horizontal support for the past few days which is indicating demand.
One can look for a 8% to 12% gain on deployed capital in this swing trade.
The view is to be discarded in the event of the stock breaking previous swing low.
#NSEindia #Trading #StockMarketindia #Tradingview #SwingTrade

STARCEMENT - Ichimoku BreakoutStock Name - Star Cement Ltd
Ichimoku Cloud Setup :
1). Today's close is above the Conversion Line
2). Future Kumo is Turning Bullish
3). Chikou span is slanting upwards
All these parameters are showing bullishness at Current Market Price
and more bullishness AFTER crossing 163
#This is not Buy and Sell recommendation to any one. This is for education purpose and a helping hand to learn trading in Market.
#CloudTrading
#IchimokuCloud
#IchimokuFollowers
#Ichimokuexpert
I hope you all like my analysis.
Please do share your thoughts into comment section.
Please give a like, share & subscribe for daily analysis.

Star Cement Ltd. - Intraday(05/06/23) to Short term StockStar Cement Ltd is good for Intraday (05/06/23) to Short Term
Technical Scans :-
* Good Above Yesterday High
* 5 Days Breakout
* 10 Days Breakout
* 30 Days Breakout
* 90 Days Breakout
* 52 Week Breakout
* Volume Breakout
for educational purpose only

STARCEMENT - Ichimoku Bullish Breakout Stock Name - Star Cement Ltd
Ichimoku Cloud Setup :
1). Today's close is above the Conversion Line
2). Future Kumo is Turning Bullish
3). Chikou span is slanting upwards
All these parameters are showing bullishness at Current Market Price
and more bullishness AFTER crossing 143
#This is not Buy and Sell recommendation to any one. This is for education purpose and a helping hand to learn trading in Market.
# Cloud Trading
# Ichimoku Cloud
# Ichimoku Followers
I hope you all like my analysis.
Please do share your thoughts into comment section.
Please give a like, share & subscribe for daily analysis.

STARCEMENT - Long Setup, Move is ON..NSE:STARCEMENT
✅ #STARCEMENT trading above Resistance of 132
✅ Next Resistance is at 171
Related charts:
Charts are self-explanatory. Levels of breakout, possible up-moves (where stock may find resistances) and support (close below which, setup will be invalidated) are clearly defined.
Disclaimer: This is for demonstration and educational purpose only. This is not buying or selling recommendations. I am not SEBI registered. Please consult your financial advisor before taking any trade.

#Star Cement ATH BO will give or not!Stock is near to ATH BO with good volume build up forming round bottom pattern, good risk reward, follow chart for proper support and resistance levels.

Cup and handle breakoutChart -> Star Cement Weekly
A good-looking cup and handle breakout with volume bar, on the chart!
CMP: 127
Good Range: 120 to 125
Target: 140, 152
SL: 118 Weekly Close
Disclaimer: This is for educational purposes only, not any recommendations to buy or sell. As I am not SEBI registered, please consult your financial advisor before taking any action.

STAR CEMENT - LongStar cement has shown weekly GOLDEN CROSSOVER on weekly Time frame. There is good volume buildup as well

Long STARCEMENT - Move is ON..NSE:STARCEMENT
✅ #STARCEMENT trading above Resistance of 117
✅ Current strength may push the price to next Resistance at 132
✅ Now trading at 52 weeks high which is a sign of strength
Related chart:
Charts are self-explanatory. Levels of breakout, possible up-moves (where stock may find resistances) and support (close below which, setup will be invalidated) are clearly defined.
Disclaimer: This is for demonstration and educational purpose only. This is not buying or selling recommendations. I am not SEBI registered. Please consult your financial advisor before taking any trade.

Star Cement Ltd Technical AnalysisStar Cement Ltd.
▶️Buy above 105
▶️Targets:- 109/115/120/125+
▶️SL:- 97
▶️Range Breakout with Massive Volumes
{Chart shared for educational purpose}
Feedback/Suggestions are Welcome 🤗
#stockstobuy #Learner #starcement #stockmarket #cementstock #swingtrading

STAR CEMENT: BULLISH SETUP NSE:STARCEMENT
Star cement is in a long downtrend and it has broken its resistance trend line and forming a horizontal resistance at 96.50.
A trend reversal is forming.
Entry above 97 for a swing trade
1st target should be 103 which is a swing high and if it crosses 103 then 112 should be 2nd target.
Hope you found this helpful.
Happy Trading!
