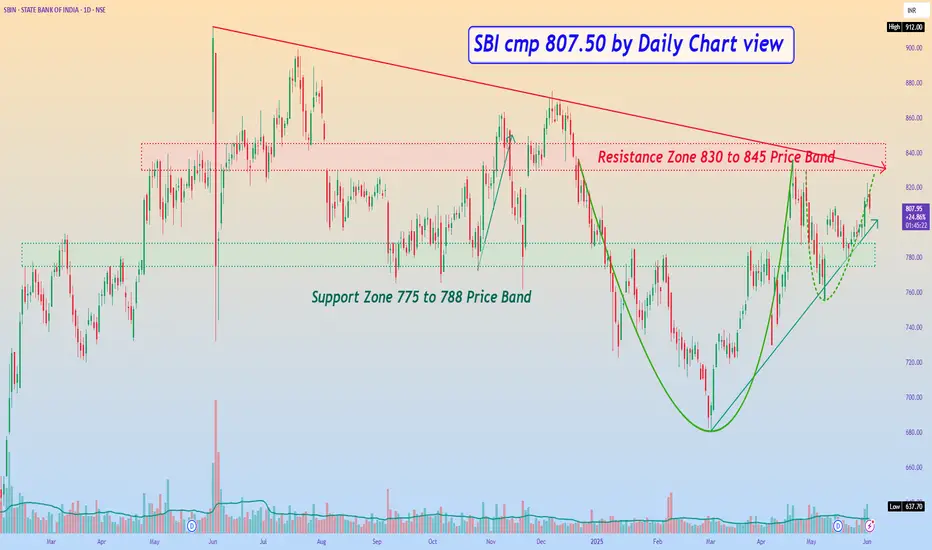
SBI cmp 807.50 by Daily Chart viewSBI cmp 807.50 by Daily Chart view
- Support Zone 775 to 788 Price Band
- Resistance Zone 830 to 845 Price Band
- Support Zone tested retested for probable upside move
- Back to Back Bullish Rounding Bottoms by Resistance Zone neckline
- *IF ..... Price takes breakout by Volumes increase support and sustain closure above Resistance Zone, fresh upside is anticipated*
Statebankofindiatechnicalanalysis
State Bank of India - Breakout OpportunityDate : 5-Dec-2024
LTP : Rs. 865.45
Targets: (T1) Rs. 912 --> (T2) Rs. 1,023
SL : Rs. 765
Technical View:
• NSE:SBIN is in primary uptrend and was recently going through it's secondary downtrend within primary uptrend.
• After touching the high of 912 on 3-Jun-2024, it has retraced 16% to 761.55 level.
• NSE:SBIN has breakout from it's secondary downtrend with high volume on 5-Dec-2024.
• NSE:SBIN is trading above 20 DEMA and 50 DEMA since last few sessions. 20 DEMA is also trading above 50 DEMA.
• RSI is in buy zone and trading at 62.74. MACD is bullish and trading at 10.63.
• Both RSI and MACD are showing positive divergence, indicating trend reversal.
• Looking good to start a new swing from here.
Liked the analysis? Boost/Like this idea and follow my ID.
Disclaimer: I am not a SEBI registered analyst/consultant and not recommending anyone to take any BUY or SELL position in stock market. Investing in stock market is risky and one should do a self analysis and validation before investing in stock market. My ideas are published for learning purpose only and are available to everyone at no cost/charge.

SBIN LEVELS FOR MONDAY - 24-10-2022Important SBIN Levels ( Support & Resistance ) for Monday Market- 24-10-2022.

State Bank of India (SBIN): What to do in times of correction...Currently State Bank of India (SBIN) is under pressure and its price action points to a correction, and its 50 day EMA was breached at 486.
Price violation below the trendline around 466 would create downward pressure. And the stock might test 456 and 438, which are 100 and 150 day EMA respectively, if weakness in the stock persists. However, these levels can also act as turning point, supported by chart structure, indicators and technical analysis.
RSI has broken the level of 60, so need to watch.
Relative Strength is still positive and above zero line. Would be cautious if it slips below the zero line.
However, amidst the current scenario, I am bullish on this stock in the long term and think this correction would make the stock attractive. But please also keep in mind the trajectory and the technical parameters of the stock and make an informed decision based on it.
