JTLIND: 3 year Downtrend Trendline Breakout, Chart of the WeekFrom ₹138 to ₹50: Why This Old Multi-Bagger Steel Stock Just Hit 20% Upper Circuit, Breaking 3-Year Downtrend and Getting a Big Order. Let's Understand in "Chart of The Week"
As per the Latest SEBI Mandate, this isn't a Trading/Investment RECOMMENDATION nor for Educational Purposes; it is just for Informational purposes only. The chart data used is 3 Months old, as Showing Live Chart Data is not allowed according to the New SEBI Mandate.
Disclaimer: "I am not a SEBI REGISTERED RESEARCH ANALYST AND INVESTMENT ADVISER."
This analysis is intended solely for informational purposes and should not be interpreted as financial advice. It is advisable to consult a qualified financial advisor or conduct thorough research before making investment decisions.
Price Action:
- Current Price: ₹72.29
- 52W High: ₹138.30
- 52W Low: ₹21.79
- The stock has recently broken above a critical downward trendline that had been in effect since mid-2024, showing strong reversal momentum with 15x average volume spike
Volume Spread Analysis:
Volume Characteristics:
- Average Volume: 1.42M shares
- Recent Spike: 21.33M shares (15x average)
- This represents exceptional institutional participation and strong momentum buying
- Historical volume spikes occurred during the 2021-2023 rally phase, suggesting similar strong hands accumulation
Volume Patterns:
- Volume dried up significantly during the downtrend, reaching multi-year lows near the ₹50 base
- This "spring" action with low volume at support followed by explosive volume on breakout is a classic Wyckoff accumulation pattern
- The volume bar chart shows distinct phases: high volume during 2023 rally, declining volume during correction, and massive spike on recent breakout
Volume-Price Correlation:
- The stock showed positive volume-price correlation during the breakout, confirming institutional buying
- Previous high-volume days in 2023 coincided with price rallies, suggesting volume leads price for this stock
- Current volume expansion suggests a potential multi-week rally ahead
Base Formation and Support Levels:
- Primary Base: ₹50-55 zone (marked with horizontal green dashed line)
- This base represents a critical accumulation zone where most institutional hands exchanged during the 2021-2022 period
- The stock tested this support multiple times between 2021-2022 before the explosive rally to ₹138
- Recent re-test of this base in late 2025/early 2026 at ₹50-52 suggests strong institutional buying interest
- Secondary Support: ₹21-22 zone represents the absolute low and panic bottom
Resistance Levels:
- Immediate Resistance: ₹80-85 zone
- Major Resistance: ₹95-100 (previous consolidation area in mid-2025)
- Critical Resistance: ₹110-115 zone
- Ultimate Resistance: ₹120-125 (prior to all-time high of ₹138.30)
Trendline Analysis:
- A clear downward trendline has been connecting lower highs since the peak at ₹138.30
- This trendline acted as resistance throughout 2024-2025, rejecting multiple bounce attempts
- Recent breakout above this trendline with massive volume confirms trend reversal
- The breakout occurred at approximately ₹60-62 level, suggesting the downtrend has been structurally broken
Breakout Confirmation:
- The recent 40% single-day rally with 20% upper circuit suggests strong momentum
- Breakout above the descending trendline with volume confirmation is a textbook bullish signal
- The stock reclaimed the ₹70 level, which previously acted as support-turned-resistance
Sectoral Backdrop:
Industry Overview:
- JTL Industries operates in the Steel Pipes & Tubes manufacturing sector, specifically focused on Electric Resistance Welded (ERW) pipes
- The company is positioned in the Basic Materials sector, under Steel & Iron Products subsector
- It serves critical end-use industries including Infrastructure, Oil & Gas, Power Transmission, Water Management, and Construction
Market Position:
- JTL is among the top 5 steel tube manufacturers in India and the largest ERW pipe manufacturer in North India
- Current manufacturing capacity: 9,36,000 MTPA (Metric Tons Per Annum) across 4 state-of-the-art facilities
- Geographic presence: Pan-India domestic market plus exports to 20+ countries across 5 continents
- Product portfolio: 1,200+ SKUs covering MS Black pipes, Galvanized pipes, Hollow sections, Solar mounting structures, Transmission towers, and specialty products
Sectoral Growth Drivers:
- Infrastructure Boom: India's infrastructure spending is accelerating with massive government projects including Bharatmala (34,800 km highways), PM-AWAS housing program, and Smart Cities 2.0
- Steel Demand Growth: India's steel demand is projected to grow at approximately 9% CAGR during 2025-2026, the highest globally according to World Steel Association
- Pipe Market Expansion: The Indian steel pipes market is expected to grow from USD 32.88 billion (2023) to USD 37.69 billion by 2030 at a CAGR of 6.43%
- Government Policy Support: Production Linked Incentive (PLI) scheme for specialty steel worth ₹27,106 crore and preferential procurement mandates support domestic manufacturers
- Power Sector Growth: Significant investments in power transmission infrastructure across India creating sustained demand for transmission towers and related products
Sector Challenges:
- Raw Material Volatility: Steel prices remain subject to global commodity cycles, coal costs, and iron ore price fluctuations
- Chinese Competition: China's steel oversupply and export surge create pricing pressure
- Environmental Regulations: EU's Carbon Border Adjustment Mechanism (CBAM) effective 2026 could add USD 80-397 per ton cost to exports
- Working Capital Intensity: Industry characterized by high working capital requirements (JTL's working capital days increased from 100 to 147 days)
Fundamental Backdrop:
Business Model:
- Integrated manufacturer of ERW steel pipes with backward integration capabilities
- Recent acquisition of 67% stake in Nabha Steels & Metals adds 2 lakh MT HRC (Hot Rolled Coil) capacity
- Diversified customer base across B2B, B2G, OEMs, and international markets reduces concentration risk
- Distribution network of 800+ dealers/distributors ensures strong market reach
Recent Corporate Actions:
- Major Order Win: Secured significant order from Punjab State Transmission Corporation Limited (PSTCL) for manufacturing 220kV transmission tower material and substation structures
- Execution Timeline: Order to be completed within FY 2025-26
- Strategic Significance: This order reinforces JTL's positioning in the power transmission infrastructure segment
- Stock Impact: The PSTCL order announcement triggered a 20% upper circuit rally, demonstrating market confidence
Financial Performance Snapshot:
- Q2 FY26 Revenue: ₹371 crores (down 22% YoY from ₹480 crores)
- Q2 FY26 EBITDA: ₹29 crores
- EBITDA Margin: Improved to 8% (from 6% YoY)
- EBITDA per ton: Increased 29% YoY to ₹4,247
- Market Capitalization: Approximately ₹2,360 crores
- Sales Mix: 88% domestic, 12% exports
Operational Efficiency Metrics:
- Despite revenue decline, operational efficiency has improved as evidenced by EBITDA margin expansion
- Higher EBITDA per ton suggests better realization and product mix optimization
- Working capital pressure visible with debtor days increasing from 40.1 to 52.8 days
Growth Catalysts:
- Capacity Expansion: With acquired Nabha Steels capacity, total capacity stands at 6 lakh MT for pipes + 2.5 lakh MT HRC + 1 lakh MT long products
- Product Diversification: Expansion into solar mounting structures, transmission towers, and specialty products reduces cyclicality
- Export Growth Potential: Recognition as "Star Export House" by Government of India supports international expansion
- Green Transition: Focus on sustainable practices and potential for green steel production aligns with global trends
Management & Governance:
- Promoter holding remains stable with recent inter-se transfers within promoter group
- ISO 9001:2015 certified operations demonstrating quality commitment
- Established in 1991, providing 30+ years of industry expertise
- Leadership under Pranav Singla (Executive Director) has articulated growth strategy and export targets
Competitive Landscape:
- Key competitors include APL Apollo Tubes, Rama Steel Tubes, Hi-Tech Pipes, Sambhv Steel
- Industry seeing consolidation with smaller players struggling with working capital and raw material costs
- JTL's integrated model and backward integration through Nabha Steels acquisition provides competitive advantage
Valuation Considerations:
- 5-Year Returns: Stock has delivered 312% returns over 5 years vs NIFTY 50's 79%
- Despite recent correction from ₹138 to ₹50, long-term value creation trajectory remains intact
- Current levels around ₹72 offer attractive entry for investors with 2-3 year horizon
- Recent order wins and capacity additions support earnings growth potential
Bull Case:
- Technical breakout from multi-month downtrend with exceptional volume confirmation
- Strong sectoral tailwinds from India's infrastructure boom and 9% steel demand growth
- Recent PSTCL order validates competitive positioning and execution capabilities
- Improved operational efficiency despite revenue headwinds
- Capacity expansion and backward integration strengthen margin profile
- Government policy support through PLI schemes and procurement preferences
Bear Case:
- Revenue declined 11% YoY in Q2 FY26, indicating near-term demand challenges
- Working capital pressure with increased debtor and working capital days
- Raw material cost volatility remains a persistent risk
- Global trade uncertainties and potential CBAM impact on exports
- Chinese steel oversupply creating pricing pressure
- Technical pattern needs confirmation with sustained trading above ₹65-70 zone
Key Monitorables:
- Quarterly revenue and EBITDA trend in coming quarters
- Execution and revenue recognition from PSTCL order
- Raw material cost trends and margin sustainability
- Order book build-up from infrastructure projects
- Working capital management improvements
- Technical price action: Holding above ₹65-70 support zone would confirm bullish reversal
My 2 Cents:
NSE:JTLIND presents an interesting technical setup following the breakout from a prolonged downtrend, supported by a major order win and improving operational metrics. The stock's 15x volume spike and 20% upper circuit rally suggest strong institutional interest resuming after extended consolidation at the ₹50-55 base.
From a sectoral perspective, the company is well-positioned to benefit from India's infrastructure boom, power transmission expansion, and robust steel demand growth. The recent PSTCL order validates its competitive capabilities in the high-value transmission infrastructure segment.
Full Coverage on my Mid-Week Newsletter coming Wednesday.
Keep in the Watchlist and DOYR.
NO RECO. For Buy/Sell.
📌Thank you for exploring my idea! I hope you found it valuable.
🙏FOLLOW for more
👍BOOST if you found it useful.
✍️COMMENT below with your views.
Meanwhile, check out my other stock ideas on the right side until this trade is activated. I would love your feedback.
As per the Latest SEBI Mandate, this isn't a Trading/Investment RECOMMENDATION nor for Educational Purposes; it is just for Informational purposes only. The chart data used is 3 Months old, as Showing Live Chart Data is not allowed according to the New SEBI Mandate.
Disclaimer: "I am not a SEBI REGISTERED RESEARCH ANALYST AND INVESTMENT ADVISER."
This analysis is intended solely for informational purposes and should not be interpreted as financial advice. It is advisable to consult a qualified financial advisor or conduct thorough research before making investment decisions.
Steelsector

SARDAEN: Triangle Breakout, Chart of the WeekWhy NSE:SARDAEN Triangle Breakout Could Signal the Next Big Move in it, let's analyze in "Chart of the Week" Post Strong Q1 FY26 Results
As per the Latest SEBI Mandate, this isn't a Trading/Investment RECOMMENDATION nor for Educational Purposes, it is just for Informational purposes only. The chart data used is 3 Months old, as Showing Live Chart Data is not allowed according to the New SEBI Mandate.
Disclaimer: "I am not a SEBI REGISTERED RESEARCH ANALYST AND INVESTMENT ADVISER."
This analysis is intended solely for informational purposes and should not be interpreted as financial advice. It is advisable to consult a qualified financial advisor or conduct thorough research before making investment decisions.
Price Action Analysis:
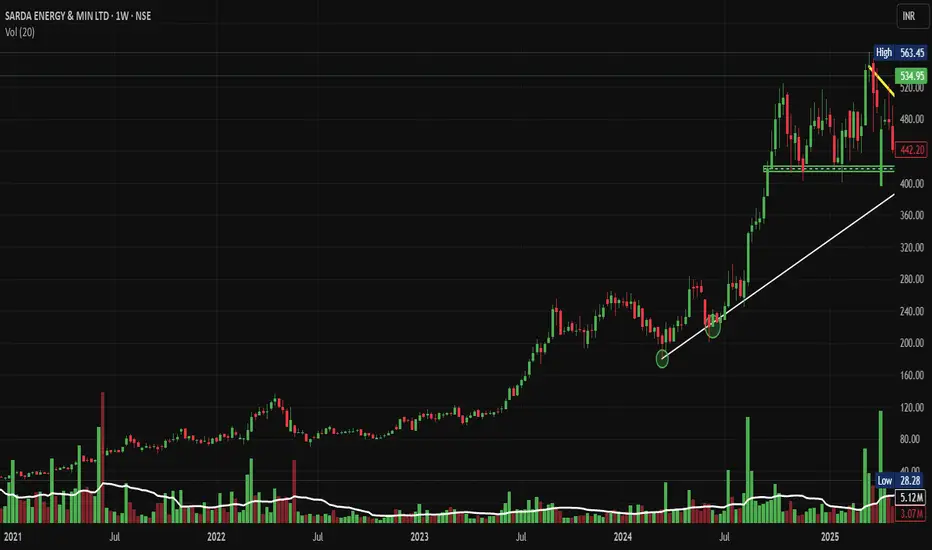
• Stock has exhibited a strong uptrend from 2022 lows around ₹120-140 to current levels of ₹534.95
• Major rally phase from mid-2023 onwards, gaining over 300% in approximately 18 months
• Current consolidation phase since late 2024, around ₹400-600 range, indicates institutional accumulation
• Recent price action shows formation of higher lows with resistance being tested multiple times
Volume Spread Analysis:
• Volume spikes during major breakout moves confirm institutional participation
• Recent consolidation accompanied by relatively lower volumes, typical of the accumulation phase
• Volume breakout above 7.11M suggests renewed interest at current levels
• Volume pattern supports the bullish bias with buying interest on dips
Key Technical Levels:
Base Formation:
• Primary base established between ₹400-₹430 levels during 2024 consolidation
• Secondary base forming at ₹480-₹500 range as recent support
• Base width of approximately 8-10 months indicates a strong foundation for the next leg up
Support Levels:
• Immediate Support: ₹480-₹500 (recent swing lows and 50-day moving average area)
• Strong Support: ₹420-₹440 (previous resistance turned support)
• Major Support: ₹380-₹400 (long-term trend line support and 200-day moving average)
Resistance Levels:
• Immediate Resistance: ₹560-₹580 (recent highs and psychological level)
• Major Resistance: ₹600-₹620 (all-time high zone and round number resistance)
• Extended Resistance: ₹680-₹720 (measured move projection from triangle pattern)
Technical Pattern Recognition
Symmetrical Triangle Pattern:
• Clear triangle formation visible from the chart with converging trend lines
• Triangle spans approximately 8-10 months, indicating a significant pattern
• Breakout direction typically follows the prevailing trend (bullish in this case)
Trend Line Analysis:
• Primary uptrend line intact from 2022 lows, providing dynamic support
• Resistance trend line from 2024 highs is being challenged multiple times
• Converging trend lines creating the triangle pattern setup
Fundamental and Sectoral Backdrop:
Company Fundamentals:
• Market Cap: ₹18,852 crore (up 88.40% in 1 year)
• Revenue: ₹5,350 crore with profit of ₹941 crore (TTM)
• Business Model: Manufacture of sponge iron, ferro alloys, billet, wire-rod, and iron ore pellet through Steel, Ferro, and Power segments
• Promoter Holding: 73.16% indicating strong management confidence
• Dividend Policy: Low payout at 7.69% of profits over the last 3 years, suggesting reinvestment focus
Sectoral Outlook:
• Steel Industry: India is the world's largest steel producer with strong domestic demand
• Ferro Alloys Market: Global market projected to grow from $156.37 billion in 2024 to $204.2 billion by 2032 at 5.60% CAGR
• Indian Ferrosilicon: Market valued at $347.7 million in 2022, estimated to grow at 5.0% CAGR through 2030
• Infrastructure Push: Union Budget 2025-26 increased capital investment outlay for infrastructure by 11.1% to ₹11.2 lakh crore
Growth Lever:
• Integrated business model across the steel value chain provides operational synergies
• Strong promoter holding indicates alignment with minority shareholders
• Beneficiary of India's infrastructure development and steel demand growth
• Consolidation phase completion, suggesting readiness for the next growth phase
Key Risk Factors:
• Commodity price volatility affecting margins
• Working capital days increased from 78.1 days to 119 days, indicating efficiency concerns
• Current valuation appears overvalued by 52% compared to intrinsic value
• Global steel demand fluctuations and trade policy changes
Market Catalysts:
• Government infrastructure spending and PLI schemes
• 2025 outlook suggests potential upturn in steel producer activity with lower input costs and shifting trade policies
• Iron ore production increased by 5.5% to 135 MMT in FY 2024-25, supporting raw material availability
• Ferro Alloys industry poised to reach $188.7 billion by 2025, driven by a robust economy
Full Coverage on my Newsletter this Week
Keep in the Watchlist and DOYR.
NO RECO. For Buy/Sell.
📌Thank you for exploring my idea! I hope you found it valuable.
🙏FOLLOW for more
👍BOOST if you found it useful.
✍️COMMENT below with your views.
Meanwhile, check out my other stock ideas on the right side until this trade is activated. I would love your feedback.
As per the Latest SEBI Mandate, this isn't a Trading/Investment RECOMMENDATION nor for Educational Purposes, it is just for Informational purposes only. The chart data used is 3 Months old, as Showing Live Chart Data is not allowed according to the New SEBI Mandate.
Disclaimer: "I am not a SEBI REGISTERED RESEARCH ANALYST AND INVESTMENT ADVISER."
This analysis is intended solely for informational purposes and should not be interpreted as financial advice. It is advisable to consult a qualified financial advisor or conduct thorough research before making investment decisions.
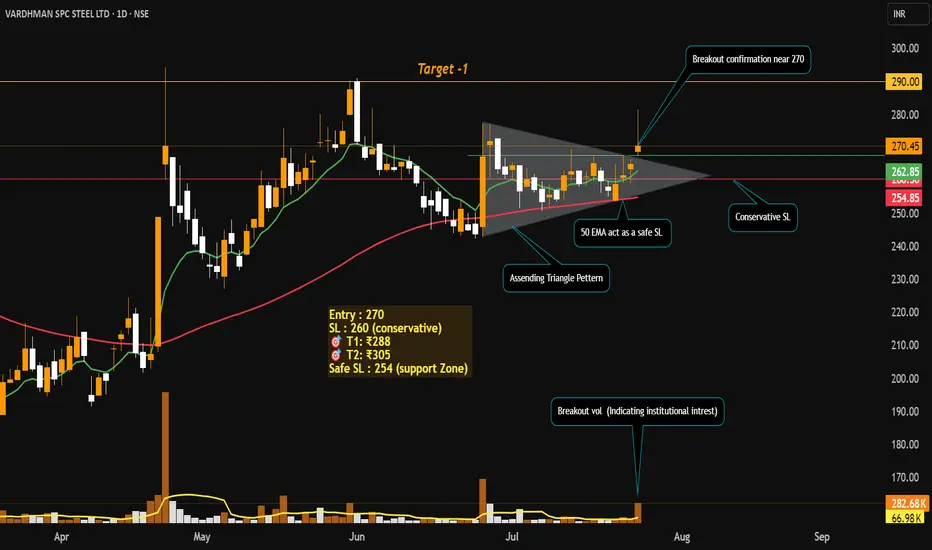
Swing Trade Idea: Vardhman Special Steels Ltd (NSE: VSSL)Technical Setup
Ascending Triangle Breakout on Daily Timeframe
Volume Spike 4x average volume on breakout day — strong institutional confirmation.
both the EMAs Bullish crossover (Price trading above both the EMAs).
RSI showing bullish momentum (60-65).
Price Action Strategy
Price broke out from resistance zone with strong bullish candle and closed near the high.
Previous resistance of ₹270 now acts as support.
Fundamentals
Promoter Holding: High, backed by Aichi Steel (Toyota Group).
Debt/Equity: Low (~0.12) → Strong solvency.
Strong financials: ROE / ROCE ~12.4% / ~17.8%
Revenue Growth: Consistent YoY
Valuation: Reasonable P/E (~18–20x)
My View: Entered at breakout with strong confirmation. Trail SL and book profits step-by-step. Holding for higher targets as long as price respects 9 EMA.
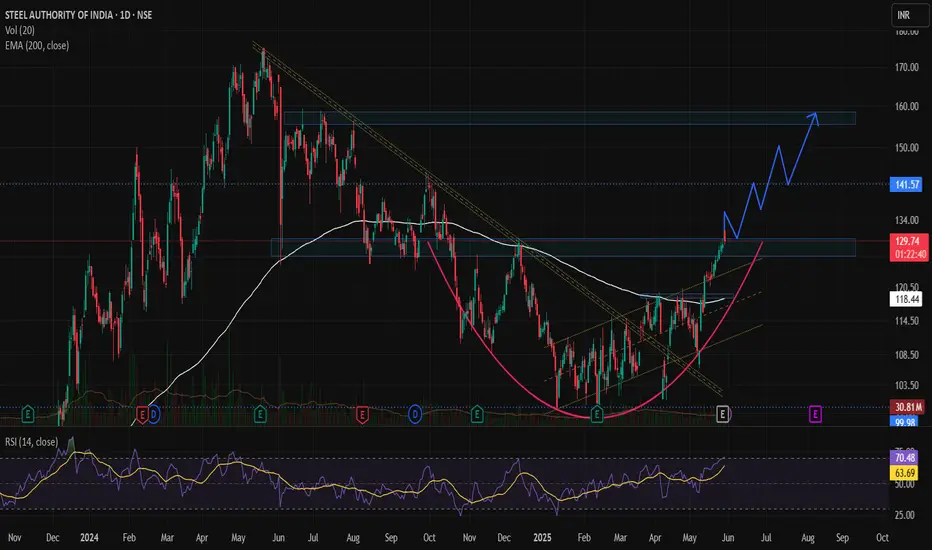
SAIL – Trend Reversal & Trade SetupA trend reversal appears to be taking shape in SAIL, indicating a potential shift from a downtrend to an uptrend. The stock has recently came out of a falling trendline and has closed above its 200-day EMA, placed at ₹117, signaling renewed strength and buyer interest.
🔄 Technical Outlook
- Breakout Zone: SAIL gave a technical breakout at ₹117, which aligns with its 200 EMA (Day), a widely tracked long-term moving average.
- Current Price Action: The stock is now trading at around ₹130, emerging from a rounding bottom pattern, which is a bullish continuation pattern indicating accumulation and base formation.
- Volume Analysis: Recent trading sessions have shown notable volume spikes, supporting the bullish breakout and trend reversal narrative.
- Fundamental Trigger: Q4 Results have been decent, providing a fundamental cushion to the technical setup. While not overly bullish, the results are good enough to support the ongoing trend reversal, especially if broader market sentiment remains stable.
📊 Support & Resistance Levels
- Crucial Support Zone: ₹127–₹130 — holding this zone is key for sustaining the bullish move.
- Key Breakout Zone: ₹127–₹130 — staying above this range will confirm the breakout and strengthen the upward move.
- Stop Loss: A protective stop-loss at ₹115, which lies just below the 200-day EMA, is advisable to manage downside risk.
🎯 Target Levels
First Target: ₹140
Second Target: ₹150
Final Target: ₹158
Time Frame: Expected to take 2–2.5 months to achieve the projected targets if momentum continues.

STEELCAST✦✦ BREAKOUT STOCK ✦ ✦
#STEELCAS
CMP 828.60
The stock was in a long, 52-week consolidation phase before breaking out.
9-Week Small Base Formation
2x Average Volume on Daily Chart
Rising EMAS Indicating Strength
Entry Point:
The ideal entry would be near the breakout level of 830-850,
confirming the breakout above resistance with strong volume.
Targets: 910, 1020, 1150
Stop-Loss:
Set a stop-loss around 735, below the consolidation range,
to manage risk in case of a false breakout.

Graphite India for 100%+ upsideDate: 21 Sep’24
Timeframe: Weekly chart
Graphite India currently seems to be in Wave III of 3 which is heading towards 1400 levels (130% growth from current price) as seen in the chart. Even if it attains its previous all time high of August 2018, that’s almost double its current price. If one can handle the fluctuations that operators inject from time to time and hold tight, this one is a no brainer.
This is not a trade recommendation. Please do your own analysis.

IMFA heading towards 1000?Date: 22 Sep’24
Stock: Indian Metals and Ferro Alloys (IMFA)
Timeframe: Daily
As mentioned in my idea posted on 10 Sep’24 (link is in Related Ideas section), IMFA seems to have completed Wave IV of 3 on 13 Sep’24 and begun Wave V impulse towards 950 as seen in the chart. It can very well go past 1000 as well, only further moves can confirm this.
This is not a trade recommendation. Please do your own analysis.

IMFA for 55% upmove Indian Metals and Ferro Alloys (IMFA) on daily chart seems to be in final stages of Wave IV of 3 which may culminate around 600 levels or has it made a bottom(?); only the next few sessions can confirm that. Wave V of 3 is likely to see price up move towards 930-940 levels (~55% jump from lows of wave IV) which is fantastic if it attains it (in next 6 months?).
This chart has been put up as an idea to share my views on the stock and in no way a trade recommendation. Please do your own due diligence and analysis.

NMDC is trading near prev support zone Stocks to Keep in Radar for Next Week
⏩ SBIN
⏩ NMDC
⏩ BHEL
⏩ DLF
NMDC If continues to holds the prev week support level,
recovery towards 270 could be possible.
However in case of Bearish pattern at higher level, it may come back to prev week's range
Important downside support is around 245 zone
whereas upside hurdle is aroud 270 level
*Election Results can create Volatility in the Maket
Keep Tracking Charts
*For Educational Purpose
Learn & Practice Price Action setups

Vedanta for 100% gainFor investing/trading in metal companies, one needs patience as hard. On weekly charts, the stock seems to be in Wave 3 which is heading towards 800+ that is also the 1.618 fibonacci level as seen in the chart. In the current run up, it may go up another 5-10% (around 440 levels) before hitting a Wave (II) correction towards 350-325 levels.
Please note there are a few assumptions with which these levels are arrived at. In case of deviation in the route to its target, those assumptions are altered. You can avoid all panic if you manage your positions well.

Kalyani Steels - Greedy theoryCup holder is a bullish pattern. Cup height is the usual target & it could even rise above that.
Since KSL was listed, it has formed 6Y base & it rose around 145% from breakout. Did Fib retracement for the recent handle from top to bottom. Now another 6Y has broken out & so far reached 80% which is fib level 261.8% of the handle top to bottom. If I project to 145% from breakout, price target would be around 1200 and also the 461.8% fib level. Pivot projects to around 1179.5....with an intermediate target at 990.
Look at the RSI(34) in weekly chart. Red rectangle is the resistance. Hitting for the 3rd time. Reversal could happen now or in weeks.
RSI should be on fire to achieve that by breaking that resistance I guess. Whenever support/resistance repeatedly tested, it either makes or breaks.

STRONG BREAKOUT IN ''SAIL'' (STEEL AUTHORITY OF INDIA)CMP : 128.10
STOPLOSS : 101.50
TARGET : 184.65
This is not a buy or sell call, analysis is shared for educational purpose.

APLAPOLLO (Hidden Bullish Divergence)APLAPOLLO is in retracement zone and expected to give breakout in the coming sessions. Keep an eye on this stock for some decent returns.
NOTE: I'm not a SEBI REG. Study before investing.

SAIL Multiyear breakout with retest : A possible multibagger Exciting Bullish Pattern Alert! 🐂
📊 Pattern: Broadening Pattern Breakout
📌 Symbol/Asset: SAIL
🔍 Description: SAIL has made Broadening pattern from 2011 to 2020 and given breakout of the pattern.
Its a multiyear breakout and retest is also done.
We can see huge upside and might see returns in 3 digit percentage numbers !!
One need to just hold it for few weeks or months to come.
👉 Disclosure: We are not SEBI registered analysts, this is not a buy or sell recommendation.

LSIL looks good for swing tradeIt has formed a very good uptrend pattern and now after a pullback it has given a breakout which indicates that this stock is going to give a very good bullsih movement. Buy at your own risk.
LLong

Unveiling MAHSEAMLES' Bullish Patterns: A Breakout OpportunityMAHSEAMLES is a leading manufacturer of pipes and tubes Involved in power, electricity, and other industries. Currently trading at all-time high levels. Let's dive into the technical analysis of MAHSEAMLES to identify potential breakout patterns.
📊 TECHNICAL ANALYSIS
MAHSEAMLES is forming a potential breakout pattern on both daily and 75-minute charts, indicating a bullish trend. The stock is currently trading at all-time highs and shows increasing volume. Additionally, technical indicators suggest a strong buy sentiment.
📈 FLAG AND POLE PATTERN
The daily chart exhibits a flag and pole pattern, which is a bullish reversal pattern that indicates a potential breakout. The pole represents the stock's upward momentum, while the flag represents a consolidation period.
📈 INVERTED HEAD AND SHOULDERS PATTERN
On the 75-minute chart, we can see an inverted head and shoulders pattern, which is a bullish reversal pattern that indicates a potential breakout. This pattern forms when the stock makes a low, then rallies, and then pulls back to retest the low.
📊 VOLUME ANALYSIS
Volume is increasing, indicating a strong buying interest in the stock. This is a positive sign for the bullish trend.
📈 PROFIT AND QUARTERLY RESULTS
MAHSEAMLES has been reporting excellent profit and quarterly results, indicating a strong financial health.
📊 Final conclusion
If the stock sustains above the previous resistance level of 498, it could be a sign of a breakout, and traders may consider taking long positions before the market closes. However, please note that this analysis is for educational purposes only and should not be considered as investment advice.
👉 Follow Me 👉
If you found this analysis helpful, please like and comment below. Your feedback keeps me motivated to write consistently. You can also follow me on TradingView for more articles and trade setups. Profile link: in.tradingview.com
💡 Did you know?
A breakout above the flag and pole pattern's resistance level could lead to a potential gain and The inverted head and shoulders pattern is a bullish reversal pattern that indicates a potential change in the stock's trend.
💡I am not a SEBI-registered analyst. It is always recommended to do your own research and consult with a financial advisor before making any investment decisions

Hindalco : Symmetrical Triangle Pattern BOSymmetrical Triangle BO formation:
Forming from lows of March 2020 and latest last lowest lows of June 2022.
Strong BO expected if price sustains above 450 levels for this week.
R1: 502
R2: 529
R3: 617-633
Stop Loss: 401

JSW STEEL : Break Out on Monthly ChartBreak out Seen on monthly time frame on JSW Steel . The stock is going to make a new trend and thus provide us an opportunity to be a part of it. With a SL of Rs. 780 , the stock may hike to a level of Rs. 937 and above as shown in the chart.
The above study is not a tip to buy or sell the stock . It is the trend analysis of the stock.
Good Luck !!!

JSW STEEL SHORTTime frame 15 min, took a short entry after the support was broken using my Moving average. Used FIB levels just to identify the key points of reversal + we need to wait for the line to cross below zero on fisher scale. Targets, SL, Entry is upon chart

Cup and Handle Breakout in NMDC Steel.Cup and Handle Pattern Breakout in NMDC Steel.
40 Price level was acted as strong Resistance, now that level is broken with good candle and significant Volume.
Retested that level and 41.55 was the high of the breakout candle.
If today's candle closed above that level, then there is a high chance stock can move till 49-50 Range in Coming days.
38 is the idea Stop-loss.
This is just a view not a Recommendation, Do your own analysis before making any investment in Stock MARKET.
NSE:NSLNISP

SAIL The metal sector is cyclical in nature , most of the stocks have undergone 50%+ correction , SAIL has fallen from 150+ levels and made lows around 65 forming a wide base double bottom and nearing breakout levels of 87+ , the volume profile also shows the maximum accumulation around the 75 levels , with a fall in the US inflation and the cooling down of the DXY index , can we expect a further rally in the metal sector is something to be looked at, if the levels of 90 are crossed with high volumes the levels of 100-105-115 could be seen easily.

TATA STEEL 28JULY EXPIRY TATA STEEL has potential both sides, so it is better to have an IRON CONDOR
-1x 28JUL2022 800PE - ₹ 1.2
+1x 28JUL2022 760PE - ₹ 0.55
-1x 28JUL2022 1060CE - ₹ 1.4
+1x 28JUL2022 1120CE - ₹ 0.6
With ROI of-1.67% with just 7 days of trading session left
It is a very good opportunity for safe traders
The only thing required is large capital
Margin required for 1 lot of IRON CONDOR is ₹36814
