Avanti Feeds Limited - Breakout Setup, Move is ON...#AVANTIFEED trading above Resistance of 1199
Next Resistance is at 2118
Support is at 880
Here is previous chart:
Chart is self explanatory. Levels of breakout, possible up-moves (where stock may find resistances) and support (close below which, setup will be invalidated) are clearly defined.
Disclaimer: This is for demonstration and educational purpose only. This is not buying or selling recommendations. I am not SEBI registered. Please consult your financial advisor before taking any trade.
Stockanalysis

Jindal Steel & Power Limited - Breakout Setup, Move is ON...#JINDALSTEL trading above Resistance of 1157
Next Resistance is at 1567
Support is at 892
Here are previous charts:
Chart is self explanatory. Levels of breakout, possible up-moves (where stock may find resistances) and support (close below which, setup will be invalidated) are clearly defined.
Disclaimer: This is for demonstration and educational purpose only. This is not buying or selling recommendations. I am not SEBI registered. Please consult your financial advisor before taking any trade.

Ashok Leyland Ltd - Breakout Setup, Move is ON...#ASHOKLEY trading above Resistance of 192
Next Resistance is at 289
Support is at 141
Here are previous charts:
Chart is self explanatory. Levels of breakout, possible up-moves (where stock may find resistances) and support (close below which, setup will be invalidated) are clearly defined.
Disclaimer: This is for demonstration and educational purpose only. This is not buying or selling recommendations. I am not SEBI registered. Please consult your financial advisor before taking any trade.

National Aluminium Company Limited - Breakout Setup, Move is ON.#NATIONALUM trading above Resistance of 331
Next Resistance is at 443
Support is at 228
Here are previous charts:
Chart is self explanatory. Levels of breakout, possible up-moves (where stock may find resistances) and support (close below which, setup will be invalidated) are clearly defined.
Disclaimer: This is for demonstration and educational purpose only. This is not buying or selling recommendations. I am not SEBI registered. Please consult your financial advisor before taking any trade.

National Aluminium Company Limited - Breakout Setup, Move is ON.#NATIONALUM trading above Resistance of 216
Next Resistance is at 331
Support is at 142
Here are previous charts:
Chart is self explanatory. Levels of breakout, possible up-moves (where stock may find resistances) and support (close below which, setup will be invalidated) are clearly defined.
Disclaimer: This is for demonstration and educational purpose only. This is not buying or selling recommendations. I am not SEBI registered. Please consult your financial advisor before taking any trade.

Breakout in CSB Bank Ltd...Chart is self explanatory. Levels of breakout, possible up-moves (where stock may find resistances) and support (close below which, setup will be invalidated) are clearly defined.
Disclaimer: This is for demonstration and educational purpose only. This is not buying or selling recommendations. I am not SEBI registered. Please consult your financial advisor before taking any trade.

Force Motors Ltd - Breakout Setup, Move is ON...#FORCEMOT trading above Resistance of 21123
Next Resistance is at 30646
Support is at 14435
Here are previous charts:
Chart is self explanatory. Levels of breakout, possible up-moves (where stock may find resistances) and support (close below which, setup will be invalidated) are clearly defined.
Disclaimer: This is for demonstration and educational purpose only. This is not buying or selling recommendations. I am not SEBI registered. Please consult your financial advisor before taking any trade.

Laurus Labs Limited - Breakout Setup, Move is ON...#LAURUSLABS trading above Resistance of 1091
Next Resistance is at 1512
Support is at 806
Here are previous charts:
Chart is self explanatory. Levels of breakout, possible up-moves (where stock may find resistances) and support (close below which, setup will be invalidated) are clearly defined.
Disclaimer: This is for demonstration and educational purpose only. This is not buying or selling recommendations. I am not SEBI registered. Please consult your financial advisor before taking any trade.

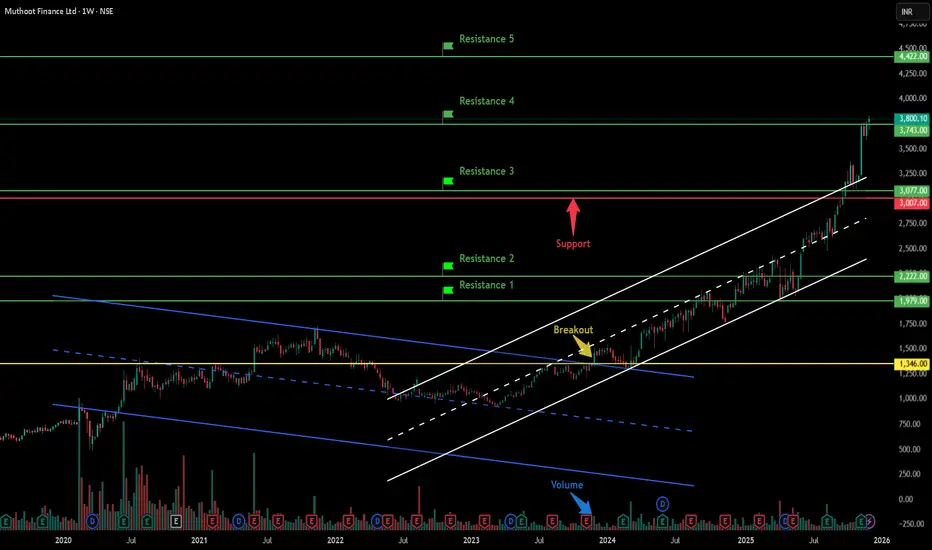
Muthoot Finance Limited - Breakout Setup, Move is ON...#MUTHOOTFIN trading above Resistance of 3743
Next Resistance is at 4422
Support is at 3007
Here are previous charts:
Chart is self explanatory. Levels of breakout, possible up-moves (where stock may find resistances) and support (close below which, setup will be invalidated) are clearly defined.
Disclaimer: This is for demonstration and educational purpose only. This is not buying or selling recommendations. I am not SEBI registered. Please consult your financial advisor before taking any trade.
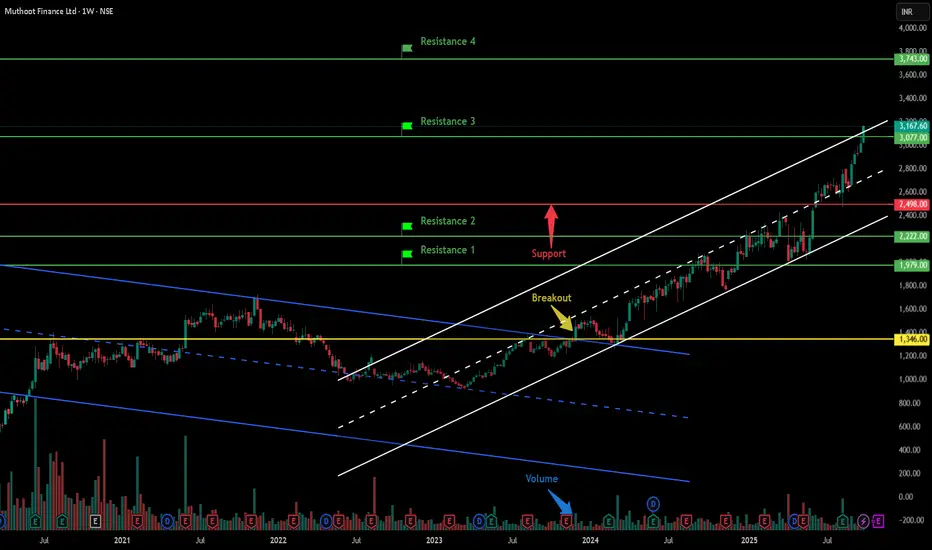
Muthoot Finance Limited - Breakout Setup, Move is ON...#MUTHOOTFIN trading above Resistance of 3077
Next Resistance is at 3743
Support is at 2498
Here are previous charts:
Chart is self explanatory. Levels of breakout, possible up-moves (where stock may find resistances) and support (close below which, setup will be invalidated) are clearly defined.
Disclaimer: This is for demonstration and educational purpose only. This is not buying or selling recommendations. I am not SEBI registered. Please consult your financial advisor before taking any trade.
Vimta Labs Limited - Breakout Setup, Move is ON...#VIMTALABS trading above Resistance of 607
Next Resistance is at 1113
Support is at 498
Here are previous charts:
Chart is self explanatory. Levels of breakout, possible up-moves (where stock may find resistances) and support (close below which, setup will be invalidated) are clearly defined.
Disclaimer: This is for demonstration and educational purpose only. This is not buying or selling recommendations. I am not SEBI registered. Please consult your financial advisor before taking any trade.

Vimta Labs Limited - Breakout Setup, Move is ON...#VIMTALABS trading above Resistance of 952
Next Resistance is at 1214
Support is at 691
Here are previous charts:
Chart is self explanatory. Levels of breakout, possible up-moves (where stock may find resistances) and support (close below which, setup will be invalidated) are clearly defined.
Disclaimer: This is for demonstration and educational purpose only. This is not buying or selling recommendations. I am not SEBI registered. Please consult your financial advisor before taking any trade.

Venus Remedies Limited - Breakout Setup, Move is ON...#VENUSREM trading above Resistance of 638
Next Resistance is at 1182
Support is at 424
Here is previous chart:
Chart is self explanatory. Levels of breakout, possible up-moves (where stock may find resistances) and support (close below which, setup will be invalidated) are clearly defined.
Disclaimer: This is for demonstration and educational purpose only. This is not buying or selling recommendations. I am not SEBI registered. Please consult your financial advisor before taking any trade.

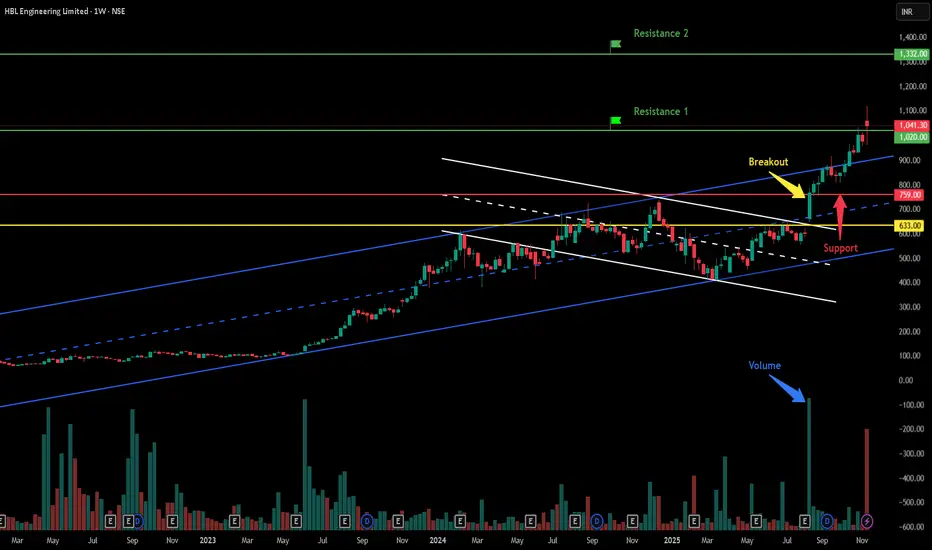
HBL Engineering Ltd - Breakout Setup, Move is ON...#HBLENGINE trading above Resistance of 1020
Next Resistance is at 1332
Support is at 759
Here is previous chart:
Chart is self explanatory. Levels of breakout, possible up-moves (where stock may find resistances) and support (close below which, setup will be invalidated) are clearly defined.
Disclaimer: This is for demonstration and educational purpose only. This is not buying or selling recommendations. I am not SEBI registered. Please consult your financial advisor before taking any trade.
Privi Speciality Chemicals Ltd - Breakout Setup, Move is ON...#PRIVISCL trading above Resistance of 3196
Next Resistance is at 4757
Support is at 2166
Here is previous chart:
Chart is self explanatory. Levels of breakout, possible up-moves (where stock may find resistances) and support (close below which, setup will be invalidated) are clearly defined.
Disclaimer: This is for demonstration and educational purpose only. This is not buying or selling recommendations. I am not SEBI registered. Please consult your financial advisor before taking any trade.

Lg Balakrishnan & Bros Limited - Breakout Setup, Move is ON...#LGBBROSLTD trading above Resistance of 1517
Next Resistance is at 2647
Support is at 1140
Here are previous charts:
Chart is self explanatory. Levels of breakout, possible up-moves (where stock may find resistances) and support (close below which, setup will be invalidated) are clearly defined.
Disclaimer: This is for demonstration and educational purpose only. This is not buying or selling recommendations. I am not SEBI registered. Please consult your financial advisor before taking any trade.

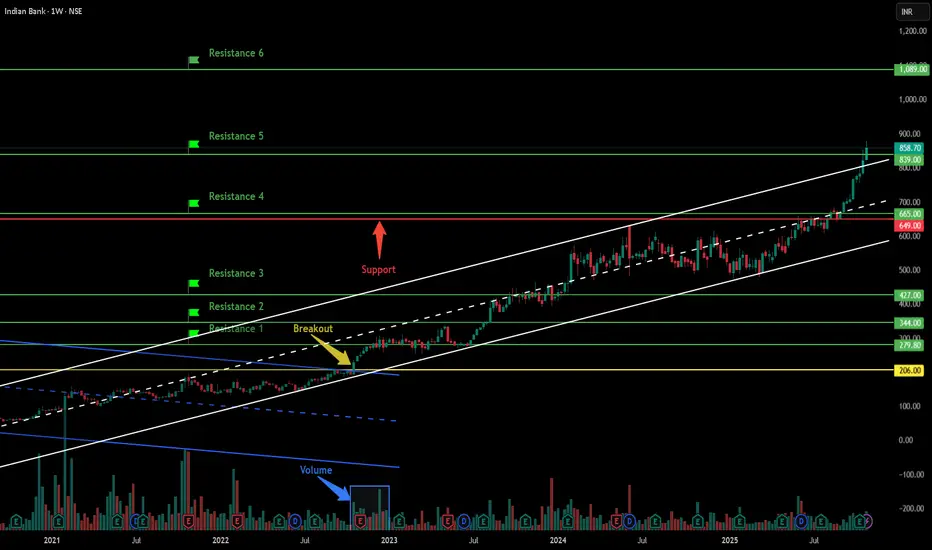
Indian Bank - Breakout Setup, Move is ON...#INDIANB trading above Resistance of 839
Next Resistance is at 1089
Support is at 649
Here are previous charts:
Chart is self explanatory. Levels of breakout, possible up-moves (where stock may find resistances) and support (close below which, setup will be invalidated) are clearly defined.
Disclaimer: This is for demonstration and educational purpose only. This is not buying or selling recommendations. I am not SEBI registered. Please consult your financial advisor before taking any trade.
Stallion India Fluorochemicals Ltd - Breakout Setup, Move is ON#STALLION trading above Resistance of 312
Next Resistance is at 524
Support is at 204
Here are previous charts:
Chart is self explanatory. Levels of breakout, possible up-moves (where stock may find resistances) and support (close below which, setup will be invalidated) are clearly defined.
Disclaimer: This is for demonstration and educational purpose only. This is not buying or selling recommendations. I am not SEBI registered. Please consult your financial advisor before taking any trade.

Stallion India Fluorochemicals Ltd - Breakout Setup, Move is ON#STALLION trading above Resistance of 171
Next Resistance is at 312
Support is at 133
Here is previous chart:
Chart is self explanatory. Levels of breakout, possible up-moves (where stock may find resistances) and support (close below which, setup will be invalidated) are clearly defined.
Disclaimer: This is for demonstration and educational purpose only. This is not buying or selling recommendations. I am not SEBI registered. Please consult your financial advisor before taking any trade.

Le Travenues Technology Ltd - Breakout Setup, Move is ON...#IXIGO trading above Resistance of 327
Next Resistance is at 460
Support is at 249
Here is previous chart:
Chart is self explanatory. Levels of breakout, possible up-moves (where stock may find resistances) and support (close below which, setup will be invalidated) are clearly defined.
Disclaimer: This is for demonstration and educational purpose only. This is not buying or selling recommendations. I am not SEBI registered. Please consult your financial advisor before taking any trade.

Inox Green Energy Services Ltd - Breakout Setup, Move is ON...#INOXGREEN trading above Resistance of 245
Next Resistance is at 363
Support is at 143
Here are previous charts:
Chart is self explanatory. Levels of breakout, possible up-moves (where stock may find resistances) and support (close below which, setup will be invalidated) are clearly defined.
Disclaimer: This is for demonstration and educational purpose only. This is not buying or selling recommendations. I am not SEBI registered. Please consult your financial advisor before taking any trade.

Inox Green Energy Services Ltd - Breakout Setup, Move is ON...#INOXGREEN trading above Resistance of 160
Next Resistance is at 245
Support is at 99
Here are previous charts:
Chart is self explanatory. Levels of breakout, possible up-moves (where stock may find resistances) and support (close below which, setup will be invalidated) are clearly defined.
Disclaimer: This is for demonstration and educational purpose only. This is not buying or selling recommendations. I am not SEBI registered. Please consult your financial advisor before taking any trade.

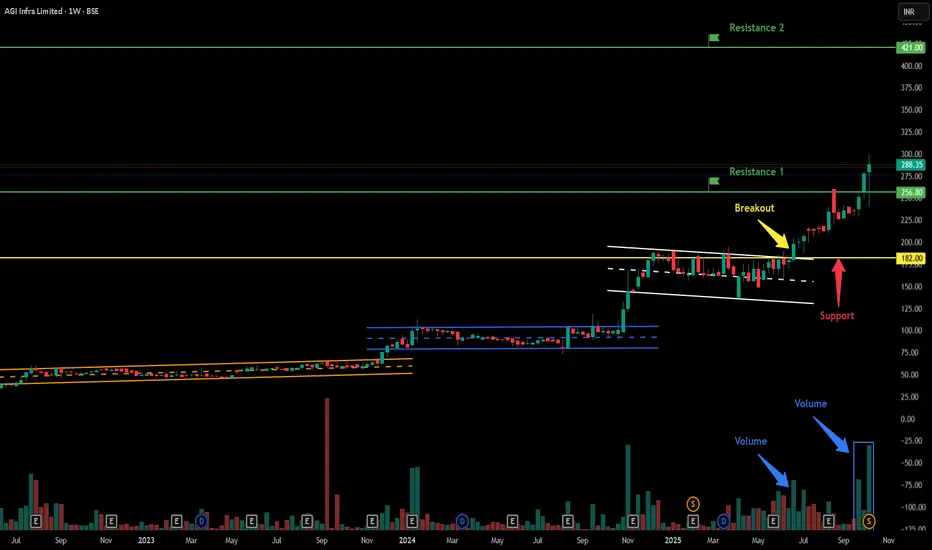
AGI Infra Ltd - Breakout Setup, Move is ON...#AGIIL trading above Resistance of 256.80
Next Resistance is at 421
Support is at 182
Here is previous chart:
Chart is self explanatory. Levels of breakout, possible up-moves (where stock may find resistances) and support (close below which, setup will be invalidated) are clearly defined.
Disclaimer: This is for demonstration and educational purpose only. This is not buying or selling recommendations. I am not SEBI registered. Please consult your financial advisor before taking any trade.