HEROMOTOCO – Wave 5 Setup Unfolding After Ideal Wave 4 📘 HERO MOTOCORP – Wave 5 Setup from Textbook Elliott Structure
Timeframe: Weekly
Structure: Impulsive (1–2–3–4 complete) → Preparing for Wave 5
Type: Positional Swing Setup | Elliott Wave Based
🔍 1. Elliott Wave Structure Breakdown:
Wave 1: ₹1,475 to ₹3,629
Wave 2: Retraced to ₹2,146.85 (between 50%–78.6% Fib of Wave 1)
Wave 3: Impulse to ₹6,246.25
Wave 4: Currently correcting between 38.2%–61.8% Fib of Wave 3 (₹4,680–₹3,712)
✅ Price found support near ₹3,344, which is just below 61.8% retracement – a common zone for Wave 4 completion.
🟫 2. Wave 4 Support Zone – ₹3,712 to ₹3,344:
This zone is acting as a potential reversal base with:
Fib retracement confluence: 38.2%–61.8% of Wave 3
Failed breakdown attempts followed by recovery candles
CHoCH observed in lower timeframes – suggests momentum shift
🟩 3. Breakout Confirmation Level – ₹4,680:
Breaking above ₹4,680–₹4,800 range would confirm Wave 5 activation
Indicates structure validation + bullish resumption
Close above this zone = strength & momentum breakout
📈 4. Wave 5 Target Projection – ₹6,595 to ₹7,019:
Calculated using:
113%–127% Fibonacci extension of Wave 3
Historical rally symmetry from Wave 1 and 3
Target zone offers positional upside potential of ~55%+
🛑 5. Stop Loss & Invalidation Level:
SL Zone: ₹3,344
Sustained breakdown below this invalidates Wave 4 base
Can lead to sharp drop toward ₹2,600–2,900 (next Fib cluster)
✅ 6. Trade Plan (Swing):
Accumulation Zone: ₹3,700 – ₹4,300 (if support structure holds)
Breakout Entry: Close above ₹4,680–4,800
Stop Loss: ₹3,344
Target: ₹6,595–7,019 (Wave 5 zone)
🧠 7. Why This Setup Matters:
Elliott Wave Confluence: Clean 1–2–3–4 formation
Textbook Fib Behavior: Wave 2 and Wave 4 within ideal retracement ranges
Defined R:R Structure: Tight invalidation + 1:2+ reward
Momentum Setup: Wave 5 can unfold rapidly once confirmed
📌 Conclusion:
HERO MOTOCORP is poised for a potential Wave 5 rally after a well-behaved corrective Wave 4.
A breakout above ₹4,680 could trigger bullish continuation toward ₹7,000+.
This is a classic trend continuation setup for wave-based swing traders.
Stocksignals

LTTS : Near Key Support | Trend Continuation WatchTimeframe: Daily
Trend Context: Corrective phase nearing completion
Current Price Zone: ~4,380
🔍 Market Structure & Technical Observations
Elliott Wave Perspective (Educational View):
The stock appears to be completing a corrective Wave-C near the 4,360–4,390 zone.
This zone aligns with prior demand and acts as a potential reversal pocket.
If Wave-C holds, the next impulsive leg (Wave-5) can begin.
Moving Average Insight:
Price has pulled back toward the short-term moving average, often seen near corrective endings.
Sustaining above this base improves odds of a trend resumption.
Support & Risk Zone:
Critical support: 4,360–4,390
Invalidation level: Daily close below 4,290
A close below this would indicate deeper correction, not accumulation.
Volume Behavior (Contextual):
No panic volume seen during decline, suggesting controlled profit booking, not distribution.
🎯 Trade Strategies
🟢 1. Swing Trading Strategy (Cash / Positional)
Buy Zone: 4,360–4,420 (on stabilization / reversal candle)
Stop Loss: Daily close below 4,290
Upside Targets:
Target 1: 4,770–4,830 (Major supply / F&O target zone)
Target 2: 5,120 (Swing projection)
📌 This setup offers a favorable Risk–Reward if price respects the Wave-C base.
🟡 2. F&O / Options Strategy (Educational)
Prefer bull call spreads or call buying only after confirmation.
Ideal confirmation:
Strong close above 4,480–4,500
OR bullish structure on lower timeframe from support
Avoid aggressive naked calls below 4,360, as volatility expansion works both ways.
🎓 Educational Notes (Why This Zone Matters)
Corrections often end where:
Prior breakout occurred
Fibonacci retracement clusters
Market sentiment turns pessimistic
The 4,360–4,390 zone ticks multiple boxes → making it a decision zone, not blind buy.
⚠️ Risk Management Guidelines
Do not average blindly below support.
Size positions assuming stop loss will be hit.
Options traders must factor in time decay — direction alone is not enough.
🧾 Summary & Conclusion
LTTS is currently at a make-or-break zone.
If the 4,360–4,390 support holds, the stock has the potential to resume its primary uptrend toward 4,830 and 5,120 in the coming weeks.
Failure to hold 4,290 on daily closing basis invalidates the bullish structure.
Disclaimer:
This analysis is for educational purposes only. I am not a SEBI registered analyst.
Markets are uncertain, and I may be wrong — please manage risk responsibly.

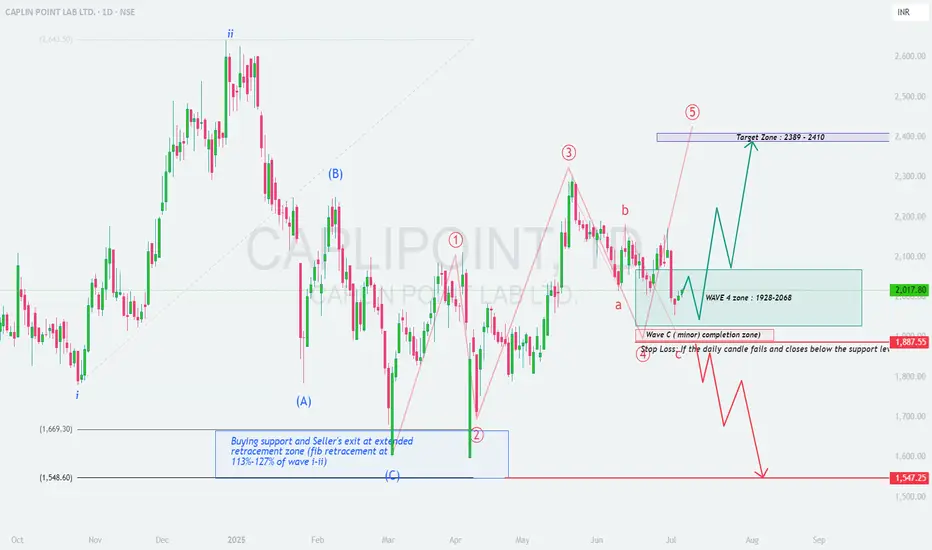
CAPLIPOINT : A Textbook Elliott Wave Correction Unfolding
\ Timeframe:\ Daily
\ Structure:\ Corrective to Impulsive
\ Type:\ Educational Swing Setup
---
🔍 \ 1. Context and Background:\
CAPLIPOINT has exhibited a classic 5-wave impulsive rally followed by a correction phase, aligning neatly with \ Elliott Wave Theory\ . Currently, the stock appears to be in \ Wave 4 correction\ – often a shallow, sideways or ABC-type pattern – preparing for a potential \ Wave 5 impulse\ .
---
📈 \ 2. Wave Structure Breakdown:\
* \ Wave 1 to Wave 3\ completed with good strength.
* \ Wave 3\ peaked near \ ₹2390\ , showing signs of extension.
* The ongoing \ Wave 4 correction\ seems to be forming a textbook \ ABC pattern\ :
* \ Wave A and Wave B\ completed.
* \ Wave C\ likely completed or very close to completion inside the support zone.
---
🟦 \ 3. Wave 4 Correction Zone – ₹1928 to ₹2068:\
This zone offers a \ high-probability reversal area\ supported by:
* \ 38.2%–50% Fibonacci retracement\ of Wave 3.
* Confluence with \ previous consolidation\ support.
* Price action showing \ long wicks and small candles\ , signaling accumulation or demand.
---
🟥 \ 4. Wave C and Critical Support – ₹1887:\
* ₹1887 is likely the \ end of Wave C\ and the complete ABC correction.
* Based on:
* \ 113%–127% Fibonacci extension\ of Wave A (classic C-wave completion area).
* Strong \ volume spike and price rejection\ near this zone.
---
🟪 \ 5. Wave 5 Target Projection – ₹2389 to ₹2410:\
Projected using:
* \ Fibonacci extension\ of Wave 1 from Wave 4 low.
* \ Measured move technique\ .
* Target aligns with previous resistance around \ Wave 3 top at ₹2390\ .
---
🛑 \ 6. Stop Loss & Invalidation Level:\
* \ Invalidation below ₹1887\ on a daily close.
* A close below this would signal a potential \ deeper correction\ toward ₹1547–1660 zone.
---
✅ \ 7. Strategic Swing Trade Plan:\
* \ Entry Zone:\ ₹1930 – ₹2065
* \ Stop Loss:\ ₹1887 (daily close basis)
* \ Target 1:\ ₹2250
* \ Target 2:\ ₹2389–2410 (projected Wave 5 zone)
---
### 🧠 \ 8. Why This Setup is Educational:\
* \ Textbook Elliott Wave Pattern:\ Classic 5-wave setup with ABC correction.
* \ Fibonacci Confluence:\ Retracement and extensions align perfectly.
* \ Price Action Validation:\ Support zone showing bullish characteristics.
* \ Defined Risk-Reward:\ Excellent R\:R with tight SL.
* \ Momentum Potential:\ Wave 5 often brings sharp, fast moves—ideal for swing setups.
---
📌 \ Conclusion:\
CAPLIPOINT is completing a clean \ Wave 4 correction\ and preparing for its \ final impulsive Wave 5\ . If \ ₹1887\ holds, the stock may target \ ₹2389–2410\ in the coming sessions. A technically rich and structurally strong swing opportunity for serious traders and wave enthusiasts.
Investment Stock Analysis - BHEL Strong BuyTechnical Aanalysis
After making HH in July 24. Stock came to Prev Breakout Levels to Retest
and currently in Accumulation before making fresh Higher High.
1) Inverted Head & SHoulder in formation. Pattern will be active when Strong closing above 261. Inactive if Closes below 179.
2) Currently within falling wedge resistance. Confirmative entry will be above candle closing above 264.
3) Multiple and Confirmed Patterns on Weekly and Monthly Charts
4) Hidden Divergence formed in a weekly Tf, confirm Trend Conformation towards prev high and Fresh Higher High.
4) Strong candidate to hold for Better returns on Short to Long term Investment.
Disclaimer: Views shared are for Educational purpose only. Initiate your own analysis before taking any trades.

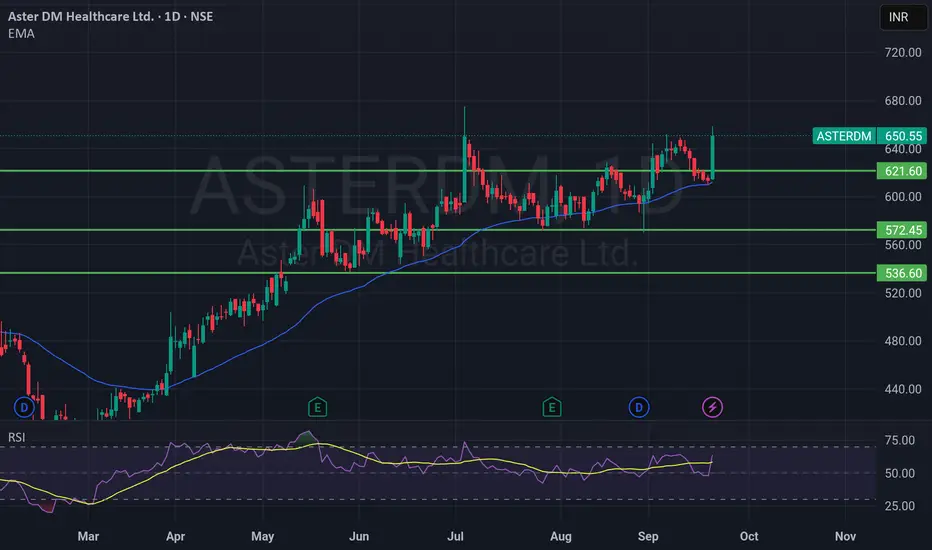
ASTERDM – Strong Breakout, Eyes on ₹670+Aster DM Healthcare is showing strong momentum with today’s ~6% surge. Price has broken above EMA 50 and is sustaining well.
🔹 Immediate support: ₹621
🔹 Next resistance: ₹670–680 zone
🔹 RSI: 63 → still has room before overbought levels
🔹 Trend: Bullish bias as long as price stays above ₹621
📈 If the stock sustains above ₹650, we may see a move towards ₹670–690 in the near term. On the downside, ₹621 remains a key support.
GMDC ltd Strong Buy - Short term#GMDCLTD - Clean Technical #Breakout Stock.
#18 years Breakout done earlier and retest also done.
#Strong #Buyondips stock.
Targets in Charts

Reliance Industries Ltd – Technical View📌 Reliance Industries Ltd – Technical View
• CMP: ₹1370.70
• Trend: Short-term downtrend with minor pullback
• Structure: Price attempting to consolidate after sharp fall; candles show small bodies with lower wicks — signs of buying interest near ₹1359
• Moving Averages:
– 20 EMA (Red): Acting as dynamic resistance
– 50 EMA (Blue) & 100 EMA (Cyan): Bearish crossover already occurred, confirming weakness
• Support Zone: ₹1355–1360
• Resistance Zone: ₹1386–1392
• Volume: Slightly elevated on recent red candles — suggests selling pressure still dominant
🎯 Action Plan
• Bullish Reversal Setup: Only if price closes above ₹1395
– Target 1: ₹1420
– Target 2: ₹1445
– Stop-Loss: ₹1360
• Bearish Breakdown: If closes below ₹1355
– Target 1: ₹1330
– Target 2: ₹1300
– Stop-Loss: ₹1386
⚠️ Disclaimer: This analysis is for educational purposes only and not a buy/sell recommendation. Always do your own research or consult a SEBI-registered advisor before making investment decisions.
#Reliance #TechnicalAnalysis #NSEStocks #PriceAction #SwingTrading #StockMarketIndia

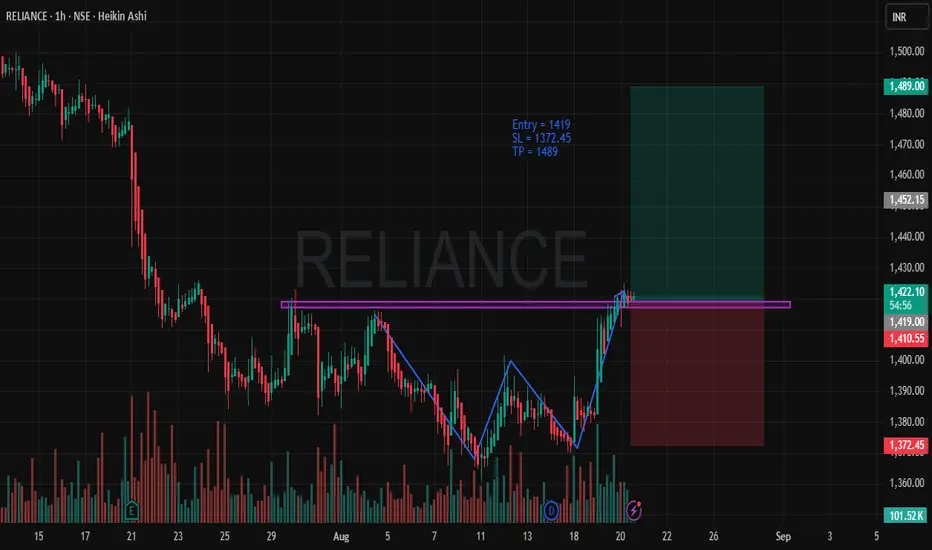
RELIANCE - Bullish SetupTimeframe: 1-Hour
Trade Type: Long Position
Entry Price: 1419
Stop Loss (SL): 1372.45
Take Profit (TP): 1489
Risk-to-Reward (RRR): 1:3.53
Trade Rationale
Bullish Trend Setup: The price action is showing a clear bullish momentum as RELIANCE has recently broken through a significant resistance level (indicated by the purple line). This breakout is a strong signal of potential upward movement.
Chart Pattern: The price forms a classic double bottom pattern (highlighted on the chart), which signifies a reversal from a downtrend to an uptrend. The pattern is confirmed with strong volume, showing the increased participation of buyers.
Entry Point: We are entering this position at 1419, right after the price breaks the resistance and starts moving upwards. This breakout marks the start of the potential rally.
Stop Loss: The SL is placed at 1372.45, just below the recent swing low, ensuring a safe exit if the market decides to reverse.
Take Profit: The TP is placed at 1489, a logical price target that accounts for a solid risk-to-reward ratio of 1:3.53. This is a reasonable expectation based on recent price action and volatility.
Volume Confirmation: Strong volume is observed, confirming the strength of the move. Typically, breakouts accompanied by high volume are more likely to continue in the breakout direction, supporting the bullish scenario.
Market Conditions: The broader market conditions appear favorable for long positions, with sentiment and technical indicators showing bullish signs across the broader market.
Risk Management
A tight Stop Loss ensures that we minimize risk in case of market retracement, while the Take Profit target allows us to ride the trend and maximize the potential return on this trade.
The Risk-to-Reward Ratio is set at 1:3.53, which aligns with sound risk management principles, allowing for substantial profits even with a lower win rate.
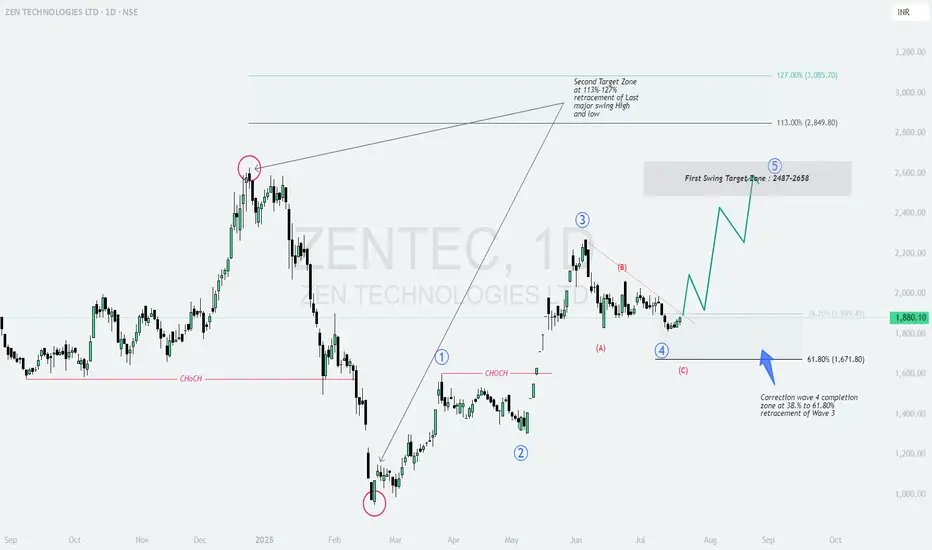
ZENTEC: Wave 4 Correction Complete – Ready for the Next wave?ZEN TECHNOLOGIES LTD (NSE: ZENTEC) – Daily Chart Analysis 🚀
Elliott Wave Structure | Fibonacci Retracement | Swing Targets
1. Why This Setup? 🤔
ZEN Technologies is showing a classic Elliott Wave structure, and the recent price action suggests a high-probability bullish reversal. Here’s why:
Wave 4 Correction Completed: The stock has retraced between the 38.2% (₹1,899) and 61.8% (₹1,671) Fibonacci levels of Wave 3, which is a textbook correction zone for Wave 4.
ABC Pattern: The correction unfolded as an ABC pattern, with the (C) leg finding support in the golden fib zone.
Change of Character (CHoCH): Multiple CHoCH points on the chart indicate a shift from bearish to bullish sentiment, suggesting that sellers are exhausted and buyers are stepping in. 🟢
2. Key Levels & Trade Plan 📊
Current Price: ₹1,880
Support Zone: ₹1,899–₹1,671 (38.2%–61.8% retracement of Wave 3) 🟢
First Swing Target Zone: ₹2,487–₹2,658 🟢
Second Target Zone: ₹2,849–₹3,085 (113%–127% extension of last major swing) 🟢
Why these targets?
The first target zone aligns with the projected completion of Wave 5, based on previous impulse waves.
The second target zone is calculated using the 113%–127% Fibonacci extension of the last major swing, a common area for extended moves in strong trends.
3. Risk Management 🛡️
Entry: Accumulate near current levels or on dips into the support zone. 🟢
Stop Loss: Daily close below ₹1,670 (61.8% retracement) to protect capital. 🔴
Targets:
1️⃣ First Target: ₹2,487–₹2,658 🟢
2️⃣ Second Target: ₹2,849–₹3,085 🟢
4. Technical Summary & Cautions 🟠
The completion of Wave 4 correction sets the stage for a potential Wave 5 rally .
Bullish momentum is likely to pick up above ₹1,900, with strong upside potential towards the target zones.
Caution: If price closes below ₹1,670 on a daily basis, the bullish setup is invalidated and further downside is possible. 🟠
Watch for confirmation candles and volume spikes for added conviction! 📈
Conclusion:
ZEN Technologies is offering a high-probability swing setup after a healthy correction. The risk/reward is attractive for positional traders, provided stops are respected. The technicals suggest a new uptrend could be starting, with clear targets and a logical stop loss. 🟢
Like & Follow for more setups! 👍✨
#ZENTEC #ElliottWave #SwingTrade #TechnicalAnalysis #TradingView #Stocks #NSE #Fibonacci #Breakout #StockMarket 🚀
Amara Raja Energy & Mobility Ltd. LongAmara Raja Energy & Mobility Ltd. is currently presenting a strong long trade opportunity, supported by a blend of bullish technical signals and long-term structural tailwinds in the EV and energy storage sectors.
Breakout Confirmation: The stock has recently broken out of a descending trendline that held since early 2024, on the back of above-average volume, signaling institutional interest.
Bullish Structure: A clean higher high, higher low formation is emerging on the Daily timeframe, indicating the early stages of a potential uptrend.
Support Zone: Price is retesting the key demand zone around ₹800–₹820, which acted as a major support-resistance flip level in the past.
Moving Averages:
21 EMA and 50 EMA have crossed bullishly with price holding above both, suggesting short- to medium-term strength.
200 EMA is flat-to-rising, showing long-term strength isn’t compromised.
MACD is turning upward with a fresh bullish crossover near the zero line — a sign of early momentum return.
RSI is comfortably above 55 but not overbought (~60–65), confirming room for upside without exhaustion.

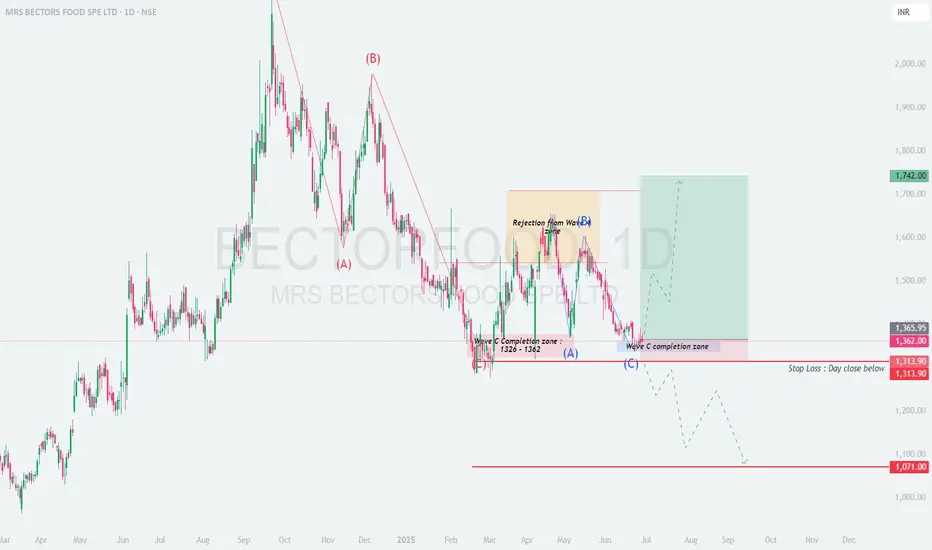
BECTORFOOD - Long Set Up at WAVE C completion zone\ 🛑 MRS BECTORS FOOD (NSE: BECTORFOOD) - Daily Chart Analysis\
\ 📍 Setup:\
Classic \ ABC corrective structure\ likely completed.
📉 Wave (A) → ⚡ Retracement (B) → 📉 Final leg (C) into a \ high-probability support zone\ .
---
\ 🟩 Wave C Completion Zone: ₹1326 – ₹1362\
• Price entered and respected this \ key demand zone\ .
• Previously acted as a strong support + rejection area.
• Now showing early signs of accumulation — possible bottom formation.
---
\ 📈 Long Trade Idea\
\ \ Entry Zone\ : ₹1326 – ₹1365
\ \ Stop Loss\ : Day close below \ ₹1313.90\
\ \ Target 1\ : ₹1500
\ \ Target 2\ : ₹1742
\ \ Risk-Reward\ : \~1:3+
---
\ ⚠️ Invalidation Scenario\
• \ Close below ₹1313.90\ will invalidate the bullish structure.
• Price may then drift toward \ ₹1071\ — opening bearish continuation possibility.
---
\ 🧠 Trade Notes\
• Wait for \ bullish candle or strong volume\ confirmation near the zone.
• Zone has proven history of \ strong rejections\ .
• Good setup for \ swing trades\ with risk-defined entry.
---
\ 📌 Summary:\
Wave C likely completed — positioned for a bounce.
\ Risk-defined long\ setup with significant upside potential.
---
🔔 Like this setup? \ Follow for more real-time Elliott Wave ideas!\
---
\ Disclaimer:\ Not SEBI Registered. For \ educational purposes only\ . Please do your own research before investing.
APOLLOTYRE – Reversal in Play After 5-Wave Decline
# 📊 \ APOLLOTYRE – Bullish Reversal on 60-Min Chart\
🔍 \ Completed 5-Wave Down → ABC Correction → Support Reaction\
---
## 🟦 \ Support Zone: ₹439.52 – ₹444.40\
📌 This critical demand zone includes:
• TS3 Low
• End of corrective wave
• Strong volume cluster (smart money reaction)
➡️ Price bounced after touching this zone, suggesting accumulation and bullish intent.
---
## 🟨 \ Immediate Resistance: ₹460–₹465 at minor wave C completion zone\
🚧 First supply zone where price may pause or face intraday rejection.
✅ A clean breakout above ₹465 can open doors for a sharper move higher.
---
## 🎯 \ Major Target Zone: ₹482–₹488\
• Swing target zone above ₹460
• If momentum builds above ₹460, expect buyers to drive price toward this zone
---
## 📝 \ Trade Setup: Building a Bullish Structure\
📈 \ Long Entry:\ Around ₹444–₹447 or on a dip near ₹440 with bullish confirmation
🎯 \ Targets:\
• T1: ₹455
• T2: ₹464–₹468
❌ \ Stop Loss:\ Close below ₹438 (beneath Decision Point & TS3 low) hourly closing basis
---
## 🧠 \ Trade Logic & Structure\
• 5-wave downtrend completed → corrective ABC finished
• Reversal triggered from a confluence support zone
• Ideal risk/reward with confirmation via bullish candle or volume spike
• Wait for confirmation on lower timeframes (15–30 min) for early entry
---
## ⚠️ \ Risk Management Tips:\
• Keep SL tight and well-defined
• Avoid chasing breakout if price consolidates below ₹444 without conviction
• Scale in position only if price holds above entry zone
---
📌 \ Conclusion:\
APOLLOTYRE is setting up for a potential swing reversal. If ₹450 is crossed with strength, ₹465–₹482-488 becomes a realistic upside target. Trade with SL discipline and wait for volume-led breakout.
-

HILTON : Reversal confirmed?
## 📘 \ HILTON METAL FORGING – Potential Reversal Setup Based on Elliott Wave Completion\
\ Timeframe:\ Daily
\ Structure:\ Completed 5-Wave Impulse (Bearish) → Recovery in Progress
\ Type:\ Swing Trade Setup | Wave Theory Based
---
### 🔍 \ 1. Context and Background:\
HILTON has completed a \ five-wave impulsive decline\ from highs of \~₹190 to a bottom near ₹50, signaling the end of a strong downtrend.
According to \ Elliott Wave Principles\ , after a completed 5-wave impulse, a corrective \ ABC structure\ (retracement) generally follows.
Current chart indicates that \ Wave 5 is complete\ and recovery is underway in the form of Wave A → B → C.
---
### 🔢 \ 2. Wave Count Overview:\
* \ Wave 1:\ Initial sharp decline
* \ Wave 2:\ Pullback to previous support
* \ Wave 3:\ Extended and steep fall
* \ Wave 4:\ Retracement to 50%-61.8% Fib zone (₹119.99–₹130.94)
* \ Wave 5:\ Final sell-off completing around ₹50–52 zone with capitulation
\ Note:\ Volume on Wave 5 bottom shows signs of exhaustion and early accumulation.
---
### 🧩 \ 3. Current Structure – Recovery Begins:\
* The chart marks the \ first rally without volume\ (Wave A)
* Followed by a correction forming \ Wave B (intermediate zone: ₹58–67)\
* Now tracking potential for Wave C upside, targeting key retracement zones
---
### 🎯 \ 4. Trade Levels and Projections:\
* \ Entry Zone:\ ₹58–67 (Wave B demand zone)
* \ First Target:\ ₹56–62 (gap-fill and prior resistance – conservative swing)
* \ Second Target:\ ₹132–142 (Extended retracement of Wave 4) – for positional traders
* \ Stop Loss:\ Below ₹56 (especially if the recovery wave fails or structure breaks)
---
### 🔍 \ 5. Technical Confluences:\
* \ Wave 4 retracement zone:\ ₹119.99–130.94 = 50–61.8% of Wave 3
* \ Extended retracement target:\ ₹132–142 (potential C-wave projection)
* \ Volume Analysis:\ Low volume rally followed by corrective dip shows early signs of base building
---
### ✅ \ 6. Strategic Notes:\
* \ This setup is ideal for swing or short-term positional traders\ aiming for 1:2+ RR
* Structure aligns with post-impulsive recovery behavior as per Elliott Wave
* \ Low-risk accumulation\ possible near ₹58–62 with defined SL
* Best trades come from structure + sentiment shift – both are visible here
---
### 📌 \ Conclusion:\
HILTON METAL appears to have \ completed its 5-wave downtrend\ and is entering a corrective phase.
The current \ Wave B zone (₹58–67)\ offers a good risk-managed opportunity to participate in the \ Wave C upside\ toward ₹132–142.
Traders must monitor price action and volume closely around the current level and protect downside with a stop below ₹56.

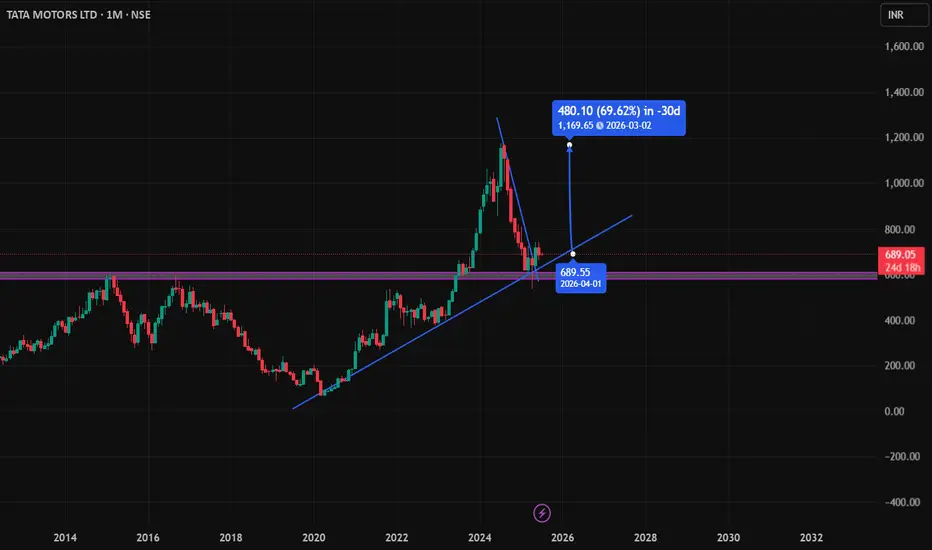
Tata Motors Long SetupTata Motors has confirmed a breakout from its recent downtrend, indicating a potential reversal. The breakout is supported by the formation of a strong bullish candle right at a key support zone, signaling renewed buying interest. This setup suggests favorable risk-reward for a long position, especially with increasing volume and momentum backing the move. Traders can consider entering above the breakout candle with a stop loss below the support.
Kriti Industries Long📢 Kriti Industries – Bullish Alert
Kriti Industries has delivered a decisive breakout from a well-defined consolidation range, backed by rising volume and strong price structure—indicating the start of a fresh uptrend.
🔍 Price Action & Volume Signals:
✅ Tight consolidation resolved with a strong bullish candle—clear sign of accumulation.
✅ Volume expansion on breakout day shows participation by smart money.
✅ Forming a higher high–higher low structure, indicating trend reversal.
✅ No supply pressure at breakout zone—suggests strength and buyer dominance.
✅ Clean breakout above previous swing high confirms shift in momentum.

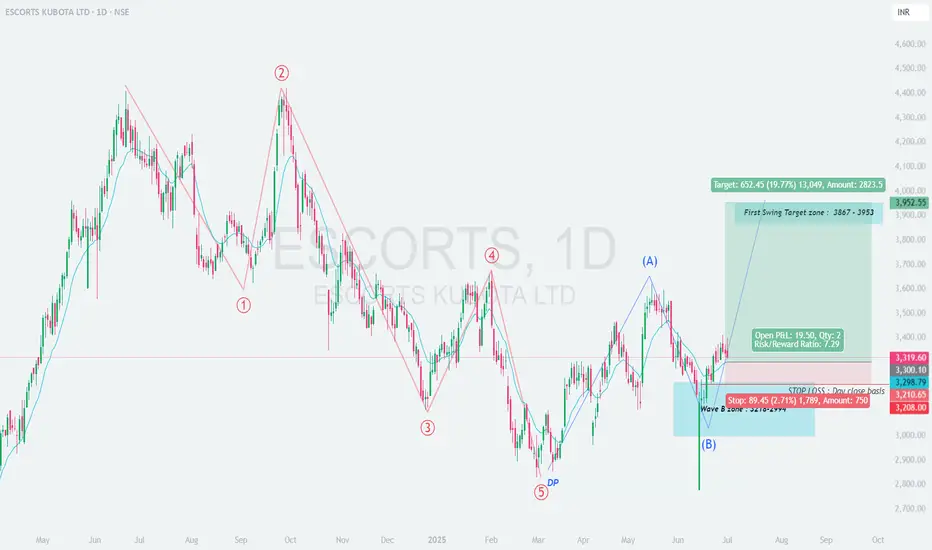
ESCORTS – Positional Swing Trade Setup (Daily Chart)
# 📊 \ ESCORTS – Positional Swing Trade Setup (Daily Chart)\
🧩 \ Elliott Wave Completion + ABC Corrective Breakout\
---
## 🌀 \ Wave Structure Insight:\
• Completed \ 5-wave impulsive decline\
• Followed by an \ ABC corrective pattern\
• Wave (B) appears to have bottomed in the \ ₹3120–3190\ Demand Zone
➡️ Reversal signs seen with strong price rejection and higher-low formation
---
## 🟦 \ Support Zone – ₹3120 to ₹3190\
🔹 Strong confluence support
🔹 Marked Demand Zone + ABC Wave (B) low
🔹 Bullish structure forming above this zone
---
## 🟩 \ Swing Target Zone: ₹3867 – ₹3953+\
🎯 Target 1: ₹3867
🎯 Target 2: ₹3953+ (full ABC projection)
⚡️ \~20% potential upside from breakout zone
---
## 📝 \ Trade Setup & Plan:\
📈 \ Entry:\ Around ₹3319–₹3330 (Post-breakout confirmation)
🎯 \ Targets:\
• T1: ₹3867
• T2: ₹3953+
❌ \ Stop Loss:\ Close below ₹3208 (below Wave B low)
📏 \ Risk-Reward Ratio:\ \~7.29 (ideal for positional traders)
---
## 🧠 \ Trade Logic:\
• Wave (B) has likely completed with a volume-backed reversal
• A sustained move above ₹3330 confirms bullish bias
• Pullback to ₹3240–₹3280 zone may offer a second entry
• Suitable for swing/positional setups with trend-following bias
---
📌 \ Conclusion:\
ESCORTS is setting up for a probable medium-term rally with a strong base in place. A move above ₹3330 with volume confirms the breakout. As long as ₹3208 holds, the trade offers high reward potential toward ₹3953.
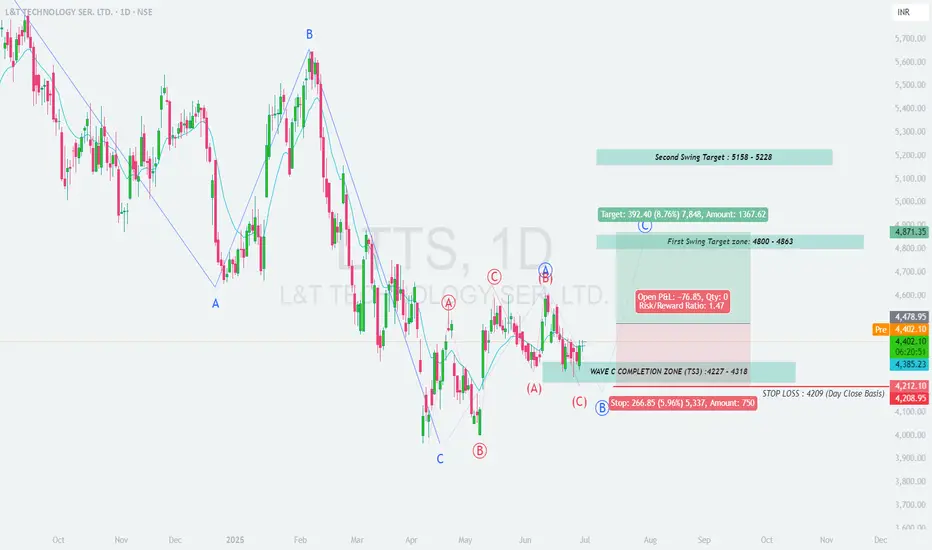
LTTS : Completing Wave B or Starting Corrective Wave 5?
## 📊 **LTTS Daily Chart Analysis**
### 🧩 **Price Structure Overview**
* The chart shows a completed **ABC correction** pattern.
* Price has recently bounced from a key \ support demand zone\ , marked by the blue and yellow boxes.
* A bullish wave structure is potentially forming, indicating trend reversal.
---
## 📉 **Support Zones**
* 📌 \ Primary Support Zone:\ ₹4280–₹4320 (yellow box)
* 📌 \ Structure Support (TS3 \ ):\ \~₹4225
Price recently reacted from these support areas with higher lows, hinting at buying interest and strength building.
---
## 📈 **Immediate Resistance / Supply Zones**
* 🟨 \ Minor Resistance Zone:\ ₹4620–₹4700 (yellow box)
* 🟦 \ Primary Resistance Zone / Target 1:\ ₹4800–₹4863
* 🟩 \ Extended Upside Target Zone:\ ₹5450–₹5650 (green box)
---
## 📝 **Trade Idea: Positional Long**
### ✅ \ Entry:\
* Around CMP (₹4405) or on dips towards ₹4300–₹4320 with bullish confirmation.
### 🎯 \ Targets:\
* \ T1:\ ₹4620
* \ T2:\ ₹4800–₹4863
* \ T3 (Extended):\ ₹5450–₹5650 (if trend sustains)
### ❌ \ Stop Loss:\
* Daily close below \ ₹4225\ (below TS3 low)
---
## 🧠 **Trade Logic & Strategy**
* Price has respected the support zones and formed a possible reversal structure.
* If the stock breaks above the ₹4620–₹4700 zone, it can accelerate toward the ₹4800+ levels.
* Conservative traders can enter after a daily close above ₹4620.
---
## 📌 **Conclusion**
LTTS is setting up for a potential **bullish swing move**.
A structure-based entry near support with defined SL offers a favorable **risk-to-reward** setup for positional traders.
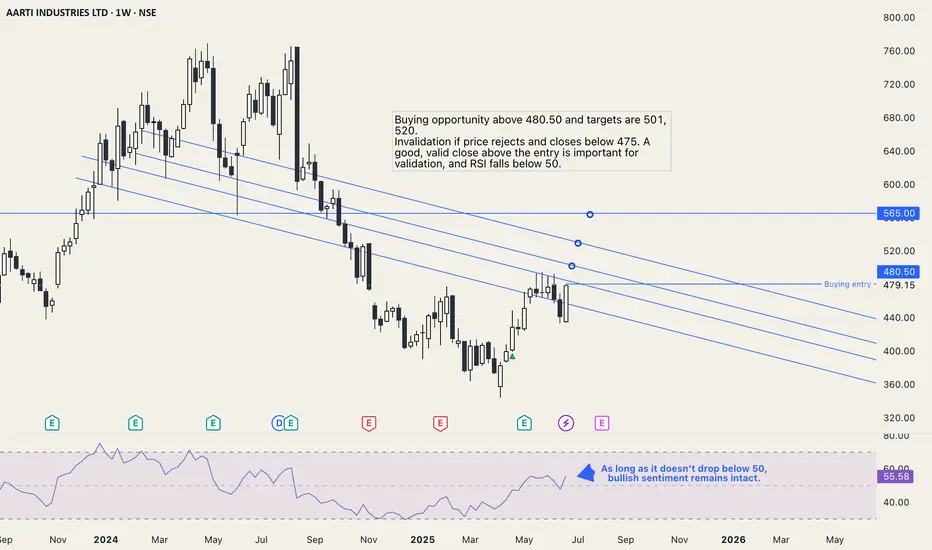
AARTIIND trading strategyBuying opportunity above 480.50 and targets are 501, 520.
Invalidation if price rejects and closes below 475. A good, valid close above the entry is important for validation, and RSI falls below 50.
360 ONE Swing Long Setup - 360 O is currently trading at 1017
- 360 O is compressing its price and trying to consolidate into a small range
- Liquidity grabs are done I dont see any major deviation lined up to take our current swing buyers
- Market structure looks good as well higher lows being made with equal highs and right now price is forming a base one close above 1080 can easily put this above 1100 soon
- Manage risk properly

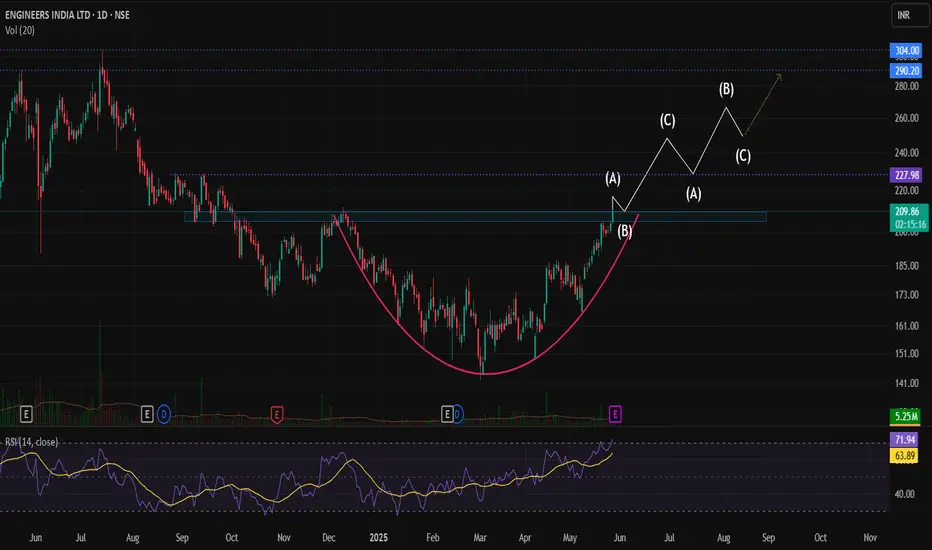
Engineers India – Technical Analysis & Trade SetupEngineers India Ltd has recently formed a rounding bottom pattern on the chart, a classic bullish reversal pattern that suggests a shift in momentum from bearish to bullish. The key resistance level lies at ₹210-212 price zone, and a breakout above this level with strong volume will confirm the pattern.
📈 Breakout Confirmation & Retest Zone :
A decisive close above ₹212 will mark a technical breakout, putting the stock at its 8-month high. Post-breakout, a retest of the ₹205–₹210 zone is likely. If the stock takes support and consolidates in this zone, it will indicate strength and readiness for the next upward leg.
📅 Fundamental Trigger – Q4 Results :
Investors and traders should closely monitor the Q4 results scheduled for 29 May. A strong earnings report could serve as a catalyst to support the technical breakout and sustain the uptrend. Conversely, a weak result may delay or invalidate the breakout momentum.
🎯 Targets & Price Action Outlook:
- Short-term buying range: Between ₹210 and ₹215.
- Immediate target: ₹250
- Next targets: ₹290 and eventually ₹300, which may take 3–4 months to achieve if the trend sustains.
- Stop loss can be placed at ₹185.
⚠️ Key Points to Watch:
- Volume confirmation on breakout above ₹212.
- Retest and support around ₹205–₹210.
- Q4 earnings impact on price action.
- Keep a disciplined stop-loss strategy based on risk appetite.
ACC can take Long entry?ACC stock has been crossed 50 & 200 EMA levels on the hourly charts. A very high probability that stock is able to breakout from the area . A good risk to reward trade setup has been shared for learning purpose. Happy trading.

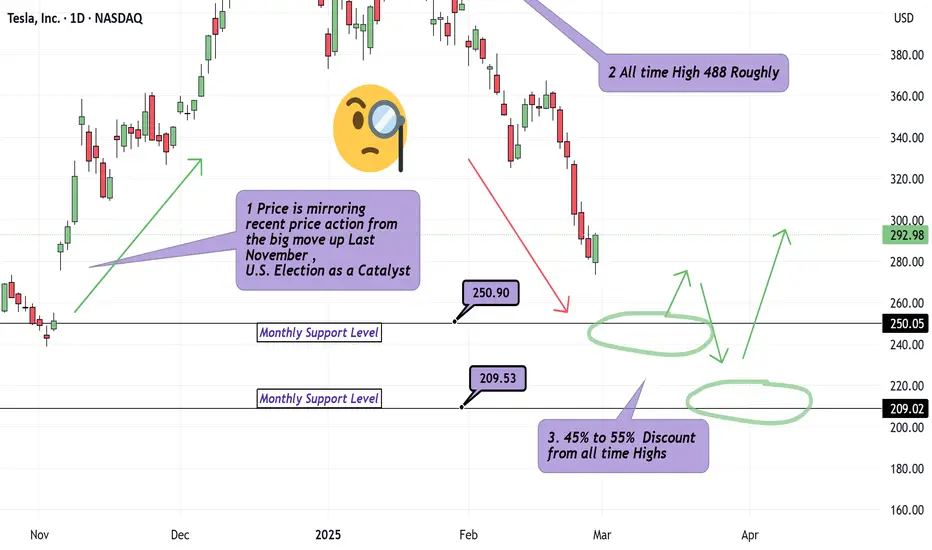
What is an Appropriate Tesla Discount? Multiple Timeframes!Hello Traders.. It's been too long.
We are back with our first analysis in over 4 months. We answer : What is an appropriate price to either jump on the train or scale into original positions on Tesla? Jumping in around 250, probably decent for at least a 4Hr to Daily Chart Swing. Safer Longs appear to be around 209 as I have outlined with green arrows, labeling the multiple pivots in the recent 5 Year range on Tesla. Tesla is coming down alongside the broader Indices which can be expected. Just because Friday Feb 28th showed us a Solid Hammer looking candle suggesting strong buying power, this does not mean much to me for 3 reasons.
1) This price action has developed in the middle of the move up we observed during Election week late last year.
2) The candle closed without a top wick and so the next daily candle , in theory, has no range to fill moving forward.
3) Momentum at the moment is also Bearish.
Discipline Traders! Leave a comment or Boosted rocket if you'd like to see similar analysis.
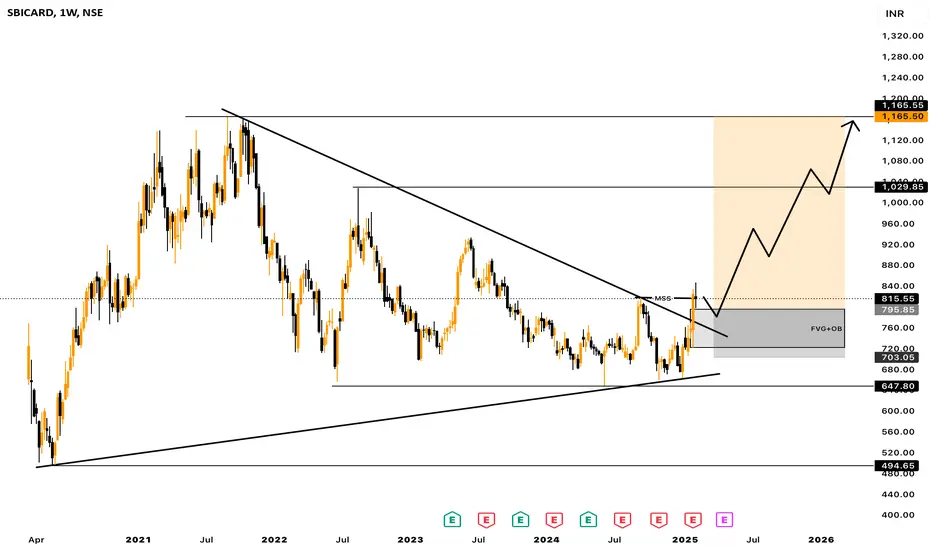
Technical Analysis: Symmetrical Triangle Breakout in SBICARD
• The weekly chart of SBI Cards (SBICARD) shows a symmetrical triangle pattern that has been forming since mid-2021.
• The stock recently broke out of this pattern, indicating a potential trend reversal or continuation move depending on broader market conditions.
• Resistance Breakout: The upper trendline, which acted as resistance, has been breached, and the stock is now retesting the breakout level (~800).
• Volume Confirmation Needed: To validate the breakout, an increase in volume would be ideal.
Fundamental Analysis: Mixed Earnings Performance
• Earnings Per Share (EPS) Trends:
• Q3 FY24 EPS came in at 4.25, missing estimates by 31.16%—a significant negative surprise.
• Q2 FY24 EPS also missed estimates by 4.51%, while Q1 FY24 had a 4.59% miss as well.
• The company has shown inconsistent earnings, which could cause volatility despite the technical breakout.
• Revenue Growth:
• Q3 FY24 revenue was ₹46.19B, exceeding estimates by 10.06%.
• Q2 FY24 revenue missed expectations by 3.01%, while Q1 FY24 was also slightly weak.
• This suggests that while top-line growth is strong, profitability (EPS) is under pressure due to either higher costs or operational inefficiencies.
Investment View: Cautious Buy with Risk Management
• Technical View: The breakout above the triangle is bullish, but the stock must sustain above 800-820 for confirmation. If it does, next resistance levels are 900 and 1000.
• Fundamental Concerns: Weak earnings growth is a risk factor. The next earnings (April 2025) will be crucial.
• Buying Strategy:
• Entry: If the stock holds above 800-820, it can be bought with a target of 900-1000.
• Stop Loss: 750-770 zone (below the breakout trendline).
• Risk Factor: If broader market sentiment weakens or earnings disappoint further, the breakout might fail.
Conclusion: A breakout trade is valid, but weak earnings make it a cautious buy with a tight stop loss. If fundamentals improve, the rally could sustain.