Buy on Dips - SCHNEIDER Analysis**SCHNEIDER - Buy on Dips | Strong Demand Zone + Triple Bottom**
📊 **Strong Price Action at Key Demand Zone**
Triple bottom formation at critical support - classic accumulation pattern:
**Why Buy on Dips:**
✅ Triple bottom shows institutional accumulation - **Demand Zone:** 561-600 (tested 3x since May 2025)
✅ Price defending demand zone with conviction
✅ Strong bounce from support - buyers stepping in
✅ All major MAs trending upward
**Targets:**
- **Tgt 1:** 862 (+12%) / - **Tgt 2:** 920 (+20%) / - **Tgt 3:** 1,000 (+30%)
**Strategy:**
Accumulate on any dip towards 730-750 zone. Strong hands at support making this a low-risk, high-reward setup.
**SL:** Below 730 (weekly close)
**Disclaimer:** This is for educational purposes only and not financial advice.
Always do your own research and consult with a financial advisor before making any investment decisions.
Trade at your own risk.
Stocksinfocus

Automotive Axles - ATH Breakout - Investment Ideas#Automotive Axles Limited - Technical Analysis
Current Price: 1,790.80
#Breakout & Retest = Opportunity
#Technical Setup
Strategy: Swing to Short Term Trade
✅ **ATH Breakout + Retest** - Successfully retested breakout zone
✅ **Higher High Formation** - Clear uptrend structure
✅ **EMAs Sorted** - Bullish alignment confirmed
✅ **Trendline Breakout** - Long-term resistance conquered
#Key Levels
Support: 1,520 (Tight SL) | 1,504 (Major support)
Swing Targets:
- T1: 2,078
- T2: 2,189
- T3: 2,284
Short-Term Targets:
- T1: 2,546
- T2: 2,800
- T3: 2,933
- Grand T4: 3,125
#tradesetup
Entry: Current levels (1,790 - 1,800)
Stop Loss: 1,520 (daily closing basis)
Risk-Reward: 1:3+ (excellent)
Timeframe: 2-6 months
Disclaimer: For educational purposes only. Not investment advice. Trading involves substantial risk. Consult a SEBI-registered financial advisor before making investment decisions. Past performance doesn't guarantee future results.
#AutomotiveAxles #SwingTrading #BreakoutTrading #TechnicalAnalysis #NSE #AutoStocks #ShortTermTrading #StockMarket #ATHBreakout #IndianStocks

SAIL - Buy - Technical Analysis# Steel Authority of India Limited (SAIL) - Technical Analysis Report
Current Price: 136.92
Timeframe: Weekly Chart Analysis
Technical Setup Overview
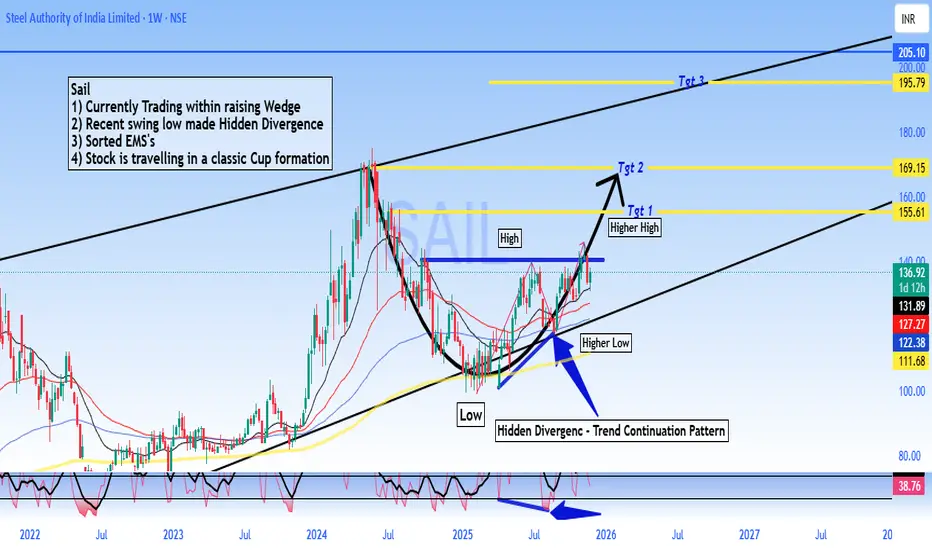
SAIL is presenting a compelling technical picture with multiple bullish indicators aligning for a potential significant upward move. The stock is currently trading within a well-defined rising wedge pattern and has recently formed a **Hidden Divergence** on the weekly chart - a classic trend continuation signal.
Key Technical Observations
Rising Wedge Pattern:
The stock is trading within a rising wedge formation, which typically indicates consolidation before a breakout. The current price action suggests the stock is in the later stages of this pattern.
Hidden Divergence - Bullish Continuation Signal:
A **Hidden Divergence** has formed on the weekly timeframe.
- This pattern typically signals trend continuation and suggests the uptrend is likely to resume with strength
Sorted EMA Structure:
The Exponential Moving Averages are properly aligned, indicating a healthy bullish trend structure with multiple moving averages providing dynamic support.
Cup Formation in Progress:
The stock appears to be carving out a **classic Cup pattern**, which is a well-known bullish continuation formation. This pattern suggests accumulation and potential for a significant breakout move.
Price Targets & Projections
Based on the technical structure, here are the potential price targets:
Target 1: 155.61 (Higher High breakout level)
Target 2: 169.15
Target 3: 195.79
These targets are derived from the pattern structure and represent key resistance zones where profit-taking may occur.
Trading Strategy Considerations
For Swing Traders:
- Current levels offer a potential entry opportunity for medium to long-term positions
- A move above ₹140 could confirm the continuation pattern
- Stop loss can be placed below the recent higher low at 122 for risk management
Risk Factors to Monitor
- Failure to hold above ₹122 would invalidate the bullish hidden divergence
- Breakdown below the rising wedge support would change the outlook
- Sector performance and broader market conditions should be monitored
- Steel industry fundamentals and commodity price trends
🔔 Conclusion
SAIL is exhibiting strong technical characteristics with the Hidden Divergence pattern, sorted EMA structure, and cup formation all pointing toward potential upside. The current price action within the rising wedge presents an interesting risk-reward setup for traders and investors with appropriate risk management.
DISCLAIMER
This analysis is for educational and informational purposes only and should NOT be considered as investment advice or a recommendation to buy, sell, or hold any securities. - I am not a SEBI registered analyst or investment advisor - This is purely a technical analysis based on chart patterns and indicators - Past performance and technical patterns do not guarantee future results - Trading and investing in stocks involves substantial risk of loss - Always conduct your own research and due diligence before making any investment decisions - Consult with a qualified financial advisor before taking any investment positions - The author holds no responsibility for any profits or losses incurred based on this analysis - Risk management and position sizing are crucial - never invest more than you can afford to lose
**Trade/Invest at your own risk. Do your own analysis.**
#SAIL #SteelAuthorityOfIndia #StockMarket #TechnicalAnalysis #NSE #IndianStocks #ChartAnalysis #TradingView #StockTrading #HiddenDivergence #CupPattern #PriceAction #SwingTrading #Investing #MarketAnalysis #SteelSector #Commodities #TradingStrategy #ChartPatterns #TechnicalIndicators
SHRIRAM - Buy - SwingTrading #Shriram Finance Limited - #Technical Analysis
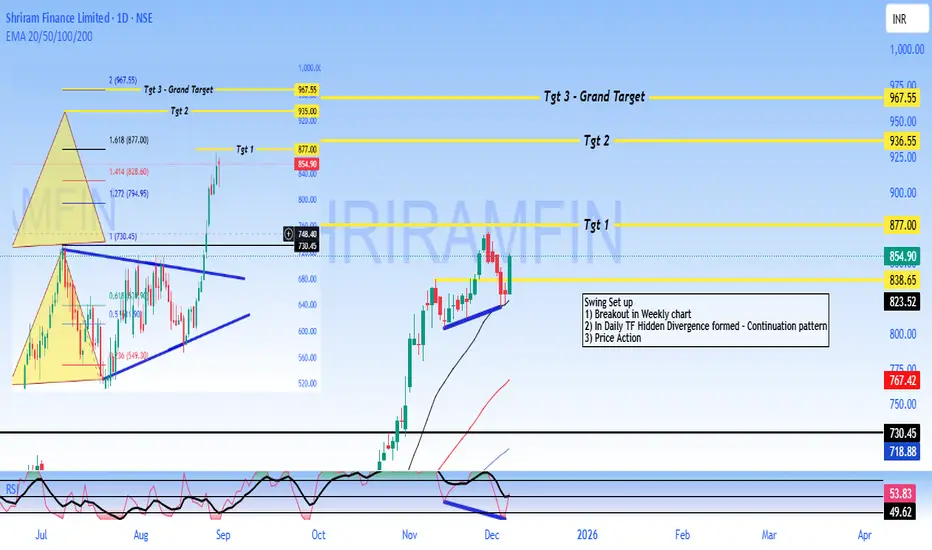
Price: 854.90
#Technical Setup
Pattern: Continuation pattern with bullish hidden divergence following weekly breakout
Key Levels:
- Target 1: 877.00
- Target 2: 936.55
- Target 3: 967.55
- Support: 838 - 825 (critical)
- Major Support: 730.45
#Outlook
The chart shows a swing trading setup with upside potential toward 877 - 967 if support at 838 holds. A break below 825 would invalidate the bullish structure.
DISCLAIMER
This is NOT investment advice. This analysis is for educational purposes only. Trading involves substantial risk of loss. Always conduct your own research and consult a SEBI-registered financial advisor before making investment decisions. Past performance and technical patterns do not guarantee future results. The author assumes no responsibility for any losses incurred.
Glenmark - Strong Buy - Technical Analysis# Glenmark Pharmaceuticals Technical Analysis Report
**Stock:** Glenmark Pharmaceuticals Limited (NSE)
**Current Price:** ₹2,038.20
**Date:** December 23, 2024
**Timeframe:** Weekly Chart
## Price Action Overview
Glenmark Pharmaceuticals is currently trading at ₹2,038.20, showing strong momentum with a 2.31% gain. The stock has demonstrated significant recovery from its mid-2024 lows and is currently testing critical resistance levels.
## Technical Structure
The chart reveals a well-defined technical pattern with the following characteristics:
**Support and Resistance Levels:**
- Strong horizontal support at ₹1,790.65 (marked in black) has held multiple times
- Target 1 (Tgt 1) at ₹2,132.50 represents immediate resistance
- Target 2 (Tgt 2) at ₹2,225.50 marks the next major resistance zone
**Trend Analysis:**
The stock exhibits a clear recovery pattern from the March-April 2025 lows around ₹1,400-1,500. After testing support near ₹1,790, the price has bounced strongly and is now approaching the first target level. The presence of multiple moving averages (likely including 20, 50, and 200-period) suggests the stock is in a recovery phase, with shorter-term averages crossing above longer-term ones.
**Pattern Recognition:**
The descending trendline (shown in black) from the September 2024 peak has been broken to the upside, which is a bullish technical signal. This breakout suggests potential continuation of the upward momentum.
## Key Observations
**Bullish Factors:**
- Recent breakout above the descending trendline
- Price holding above the ₹1,790 support zone
- Positive price action with higher lows being formed
- Current momentum showing +2.31% gain
**Resistance Zones:**
- Immediate resistance at ₹2,132.50 (Target 1)
- Major resistance at ₹2,225.50 (Target 2)
- Historical resistance zone around ₹2,300-2,400 from earlier in 2024
**Critical Levels to Watch:**
- Support: ₹1,790.65 (crucial support level)
- Current: ₹2,038.20
- Resistance: ₹2,132.50 and ₹2,225.50
## Outlook
The technical setup suggests a bullish bias as long as the stock maintains above the ₹1,790 support level. The breakout from the descending trendline and the current price position indicate potential for further upside toward the marked targets. However, traders should watch for potential resistance at the Target 1 level around ₹2,132.50.
A sustained move above ₹2,132.50 could open the path toward ₹2,225.50, while a failure to break through this level might lead to consolidation or a pullback toward the ₹1,900-2,000 zone.
---
*This analysis is based on technical chart patterns and should not be considered as financial advice. Please conduct your own research and consult with a financial advisor before making investment decisions.*

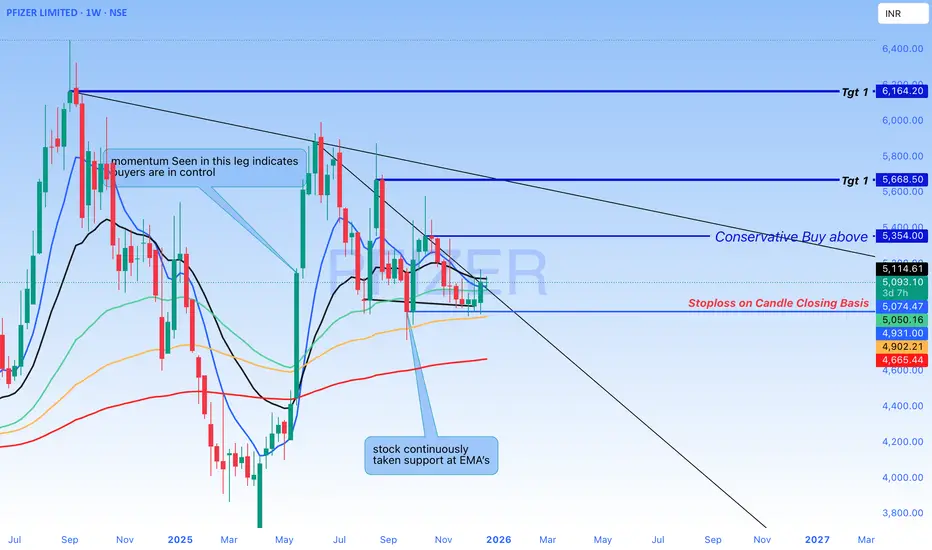
Buy Pfizer - Technical reasons- Short to Swing TradeExplained the strong technical reasons for the Bullish set up in the Charts
Sharda crop - Buy - Technical Analysis#Sharda Cropchem Ltd - Technical Analysis
Current Price: 908.30
#Key Observations
Bullish Structure:
- Price broke above the descending trendline (RSI HD pattern)
- Successfully formed Higher Low at ~ 855, confirming uptrend continuation
- Currently in "Price Action" zone after Higher High at 1,181
Critical Levels:
- Support: 855-895 (recent Higher Low zone)
- Resistance: 965 (0.9 Fib), 1,018 (0.618 Fib), 1,181 (recent high)
- Key Breakout: Above 1,018 could target 1,106-1,181 range
Technical Indicators:
- RSI in neutral zone showing momentum building
- Price action suggests consolidation before next move
- Previous resistance zone (blue box) now acting as support
The chart shows a bullish reversal pattern with higher lows forming. A sustained move above 965-1,018 zone could signal continuation toward the 1,181-1,300 levels. Watch for volume confirmation on breakouts.
DISCLAIMER: This is for educational purposes only and not investment advice. Trading in stocks involves substantial risk of loss. Always do your own research and consult with a certified financial advisor before making investment decisions. Past performance is not indicative of future results.

HCLT - Buy - Technical Analysis#HCL Technologies Limited - Technical Analysis
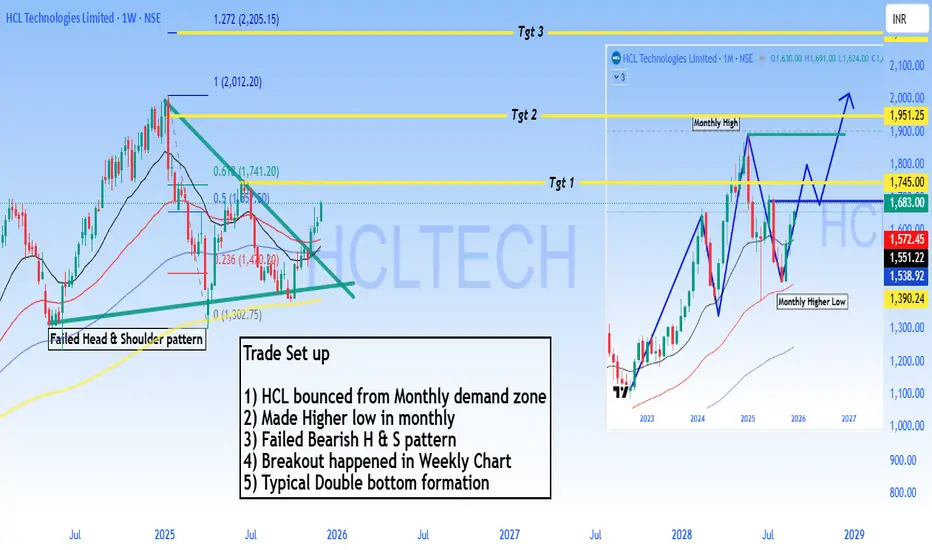
Price: 1,683.00 |
#Trade Setup - Bullish Reversal
#Outlook
Strong bullish setup with 4-35% upside potential. The failed bearish head & shoulder pattern combined with monthly demand zone bounce suggests institutional accumulation. Breakout above 1,745 opens path to 1,951 and beyond.
Pattern Analysis:
1. Bounced from monthly demand zone - Strong support established
2. Made higher low in monthly chart - Trend reversal signal
3. Failed Bearish Head & Shoulders pattern - Bears trapped, bullish continuation
4. Breakout confirmed on weekly chart - Momentum shift
5. Typical double bottom formation - Classic reversal pattern
Technical Structure:
- Monthly higher low at 1,390 confirms bullish structure
- Failed H&S pattern invalidation is highly bullish
- Price now targeting previous resistance zones
Target Levels:
- Target 1: 1,745.00
- Target 2: 1,951.25
- Target 3: 2,272.70
Support: 1,572 - 1,551 (critical zone)
⚠️ DISCLAIMER
**NOT investment advice.** Educational analysis only. Trading involves substantial risk of loss. Past patterns don't guarantee future results. Always do your own research and consult a SEBI-registered financial advisor. Author assumes no responsibility for losses.
#HCLTech #StockMarket #NSE #TechnicalAnalysis #ITStocks #IndianStockMarket #SwingTrading #Trading #FinTwit #TradingView #ChartAnalysis #StocksToWatch #Nifty50 #TechStocks
#Bajaj Finance Limited - BUY - Technical Analysis#Bajaj Finance Limited - #Technical Analysis
Price: 1,048.00
#Swing Trading Setup
Pattern: #Range #breakout with #consolidation above breakout zone. #Triangle/Box pattern breakout with target hit. Currently forming double bottom pattern.
Key Technical Points:
1. Range breakout & consolidating above breakout area
2. EMA's sorted & aligned - price trading above all EMAs
3. Triangle/Box pattern breakout - target achieved, now forming double bottom
4. Classic divergence in recent bounce area confirming retracement completion
Target Levels:
- Target 1: 1,103.80
- Swing Target 2: 1,155.00
- Grand Target: 1,225.00
Support: 1,026 - 1,018 (critical zone)
#Outlook
Strong bullish structure with potential upside of 10-17% toward targets. The double bottom formation suggests the retracement phase is complete. Price sustaining above ₹1,048 confirms continuation toward higher targets.
⚠️ DISCLAIMER
This is NOT investment advice. For educational purposes only. Stock trading involves substantial risk. Past performance doesn't guarantee future results. Always do your own research and consult a SEBI-registered financial advisor before investing. Author assumes no responsibility for losses.
#BajajFinance #StockMarket #NSE #TechnicalAnalysis #SwingTrading #IndianStockMarket #Trading #FinTwit #ChartAnalysis #StocksToWatch #TradingView #MarketAnalysis

SBI Buy - Range Breakout - Technical analysis#State Bank of India - #TechnicalAnalysis - #sbin
Price: 948.85 |
#Technical Setup
Pattern: #Swing trade setup with All-Time High (ATH) breakout confirmed on monthly chart. #Pullback/base formation in progress before next upward move.
Strategy: Conservative buy on breakout on candle-closing basis
Entry: Buy above 973.30
Stop Loss: 944.45
**Key Levels:**
- Target 1: 1,025.00
- Target 2: 1,055.80
- Grand Target: 1,144.00
- Support: 961.78 - 944.45
#Technical Observations
1. **Range & ATH Breakout** confirmed on monthly timeframe
2. Current pullback/base formation before next leg up
3. **EMA's aligned** confirming uptrend structure
4. **Hidden Divergence (HD)** formed in RSI - trend continuation pattern
5. Price action remains constructive on daily chart
⚠️ DISCLAIMER
**This is NOT investment advice.** This analysis is for educational purposes only. Stock trading involves substantial risk of loss. Past performance and technical patterns do not guarantee future results. Always conduct your own research and consult a SEBI-registered financial advisor before making any investment decisions. The author assumes no responsibility for trading losses incurred.

SRF LTD - Short term Investment#SRF Limited - Technical Analysis
Current Price: 2,927.30
Quick Overview
Strategy: Short to Long Term Investment
Pattern: Multi-year consolidation breakout (Jan'21-Feb'25) with successful retest
#Technical Setup
✅ Long Consolidation Breakout & Retest - 4-year base broken
✅ Buy on Dips - Current correction = opportunity
✅ Sorted EMAs - All moving averages bullish
✅ Higher Highs - Clean uptrend structure
#Key Levels
Support:
- 2,838 (Immediate)
- 2,720 (Strong)
- 2,400 (Major - Weekly SL)
Targets:
- T1: 3,163
- T2: 3,472
- T3: 4,049
Entry Zones:
- Primary: 2,850 - 2,950 (Current)
- Secondary: 2,720 - 2,800 (on dips)
Risk-Reward: 1:2.3 (to final target)
#Strategy - Build positions in tranches during dips. Hold for short term for optimal returns. Book partial at ₹3,163, hold core for higher targets.
Disclaimer: For educational purposes only. Not investment advice. Markets are subject to risks. Consult a SEBI-registered advisor before investing. Past performance doesn't guarantee future results.
#SRFLimited #LongTermInvesting #BreakoutTrading #TechnicalAnalysis #NSE #ChemicalStocks #PatiencePaysPremium #IndianStockMarket #PositionalTrading

Indian Metals & Ferro Alloys - Buy - Swing Trading#Indian Metals & Ferro Alloys Ltd - #Swing Trade Setup
Current Price: 1,348.10
Technical Setup
Swing Trade Configuration:
✅ **All-Time High Breakout** - Stock has broken out from its previous ATH
✅ **Sorted EMAs** - Moving averages aligned in bullish formation
✅ **Consolidation Above ATH** - Price sustaining above breakout zone
✅ **Range Breakout** - Successfully broken and retested key resistance
Key Observation
Accumulation After ATH Breakout & Range Breakout After Retest
The stock is showing classic post-breakout behavior with accumulation building above the all-time high. The successful retest of the breakout level (962- 1,049 zone) has provided an excellent entry opportunity for swing traders.
Price Targets
Target 1: 1,418
Target 2: 1,498
Target 3: 1,614
Target 4: 1,829
Stop Loss: Below 1,049
Disclaimer: This analysis is for educational purposes only and should not be considered as financial advice. Trading and investing in stocks involves risk. Please conduct your own research or consult with a SEBI-registered financial advisor before making any investment decisions. Past performance is not indicative of future results.
#SwingTrading #StockMarket #TechnicalAnalysis #IndianStocks #BreakoutTrading #NSE #RetestOpportunity #TrendIsYourFriend #IMFA #MetalStocks

BIL - Buy - ATH Breakout#Bhartiya International Limited - Technical Analysis Report
Current Price: 879.85
Market Overview
Bhartiya International is displaying strong bullish momentum after successfully retesting its 2017 high breakout level. The stock is currently sustaining above recent highs, indicating robust buyer interest and potential for further upside.
Technical Setup
Swing Trade Configuration:
- Entry Zone: Current levels around 880
- Stop Loss: 851.50 (below recent consolidation)
- Risk-Reward: Favorable with multiple upside targets
Price Targets:
- Near-term: 961 / 1018 / 1099 / 1253
- Long-term: 1330 / 1720
Key Technical Observations
1. **2017 High Breakout Retest:** The stock has successfully broken out and retested the 2017 high resistance, which has now converted into support. This is a classic bullish pattern indicating strength.
2. **50-period EMA Support:** Price is sustaining above the 50 EMA, confirming the uptrend remains intact.
3. **Hidden Divergence:** The chart shows hidden divergence on lower timeframes, typically indicating trend continuation - a bullish signal for swing traders.
4. **Higher Highs Formation:** The stock is consistently making higher highs, demonstrating strong momentum and buyer dominance.
Trading Strategy
The setup favors swing traders looking for medium-term gains. The retracement and previous all-time high methodology suggests a structured approach to profit booking at each target level while maintaining a trailing stop loss.
Targets based on Fibonacci retracement, previous retracement patterns, and historical ATH analysis.
**Disclaimer:** This analysis is for educational purposes only. Please conduct your own research and consult with a financial advisor before making investment decisions. Past performance does not guarantee future results.

Evening Star in SBIN Daily TFEvening star pattern in Daily timeframe.
Selling opportunity below 968, downside targets will be 961.55, 957.60 and 953
Stop above 970.

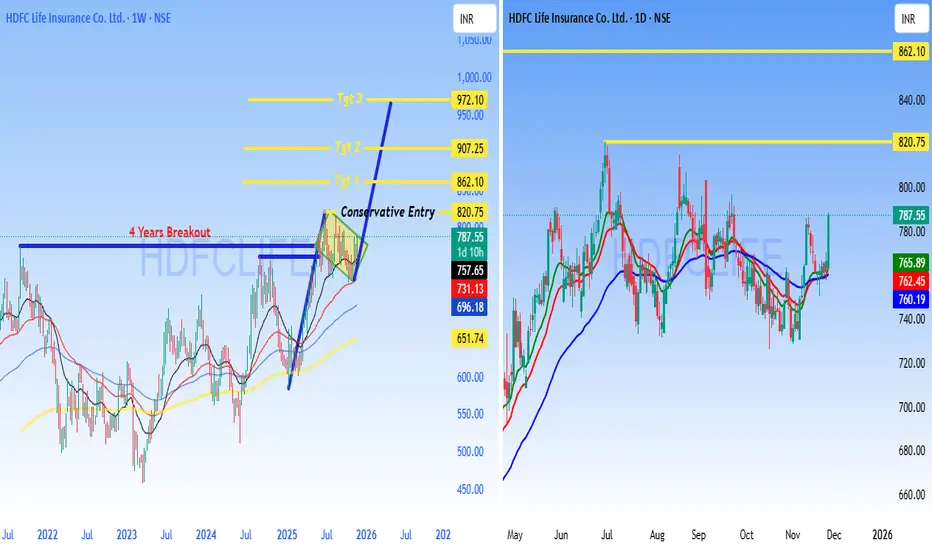
HDFCLIFE - BUY - Technical AnalysisHDFC Life Insurance - 4-Year Breakout Setup
HDFCLIFE (NSE) Current Price: 787.55
Date: November 27, 2025
Key Highlight: 4-YEAR BREAKOUT CONFIRMED
HDFC Life has broken out from a **4-year consolidation zone** around 787, signaling a major technical development with significant upside potential.
Technical Setup
4-Year Resistance Breakout - Stock cleared multi-year hurdle
Strong Volume Confirmation - Breakout supported by buying interest
Higher Highs Pattern - Bullish structure on daily chart
Moving Averages Aligned - Trending above key EMAs
Price Targets
Target 1: 862.10
Target 2: 907.25
Target 3: 972.10
Conservative Entry: 820.75 (post-retest confirmation)
Trading Plan
Entry Zone: 787-820
Stop Loss: Below 757 (breakout invalidation)
Risk:Reward: 1:3+ favorable setup
Strategy: Long-term breakout traders can accumulate; conservative traders wait for pullback to ₹820 zone.
- 4-year resistance breakouts often lead to sustained rallies
- Insurance sector showing strength
- Strong institutional interest in HDFC Life
- Technical + fundamental alignment
Risk Management
- Use stop loss below 757
- Position size: Risk only 1-2% capital
- Trail stop loss as targets are achieved
- Monitor broader market conditions
DISCLAIMER
**NOT investment advice. For educational purposes only.** I am NOT a SEBI registered analyst. This is technical analysis based on chart patterns. Trading involves substantial risk. Do your own research (DYOR). Consult a financial advisor before investing. Trade at your own risk.
**#HDFCLIFE #Breakout #StockMarket #NSE #TechnicalAnalysis #Insurance #Trading #IndianStocks #ChartAnalysis #SwingTrading #BreakoutTrading #TradingView #StockAlert #BullishSetup #PriceAction**
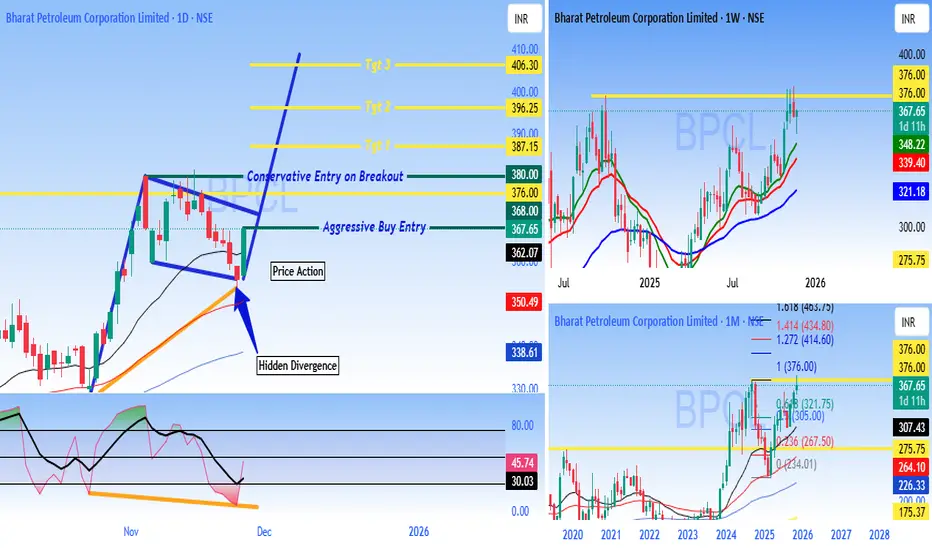
BPCL - Buy - ATH breakout - Technical Analysis#Bharat Petroleum Corporation Limited (BPCL) - #Technical Analysis Report
Current Price: 356.80 (Daily)
Multi-Timeframe Technical Analysis:
BPCL is displaying strong bullish momentum across multiple timeframes with a compelling technical setup featuring **Hidden Divergence** and a clear breakout structure on the daily chart.
Daily Chart Analysis - Key Technical Patterns:
1. Hidden Divergence Confirmed
- Classic Trend continuation signal indicating the uptrend is likely to resume with strength
2. Breakout Structure
- Stock has broken out from a consolidation zone around ₹362
- Currently trading above key resistance turned support
3. Trade Entry:
Aggressive Buy Entry:
As #Priceaction has formed already for traders who want immediate entry Buy will be active above 367.65
Conservative Entry on Breakout:
Initiate trades on candle close above 380
Price Targets
Target 1: 387.15
Target 2: 396.25
Target 3: 406.30
These targets are based on Fibonacci extensions and resistance zones from the pattern structure.
Weekly & Monthly Chart Context
Weekly Chart Shows:
- Strong uptrend since 2024 lows
- Stock trading near multi-year highs around 367-370 zone
- Higher highs and higher lows pattern intact
- Moving averages well-aligned in bullish configuration
Monthly Chart Indicates:
- Long-term recovery from 2020-2023 correction phase
- Breaking out from multi-year resistance zone
- Potential for extended rally toward ₹376-400 zone
Momentum Indicators
- Hidden divergence on daily timeframe = Bullish continuation
- Price action showing strength above key moving averages
- Volume expansion on breakout candles (positive sign)
- RSI/Momentum indicators supporting the upward move
The combination of bullish patterns and momentum indicators suggests potential for continuation toward higher targets. Traders should maintain strict risk management and adjust positions based on price action at key levels.
DISCLAIMER
This analysis is for educational and informational purposes only and should NOT be considered as investment advice or a recommendation to buy, sell, or hold any securities - I am NOT a SEBI registered analyst or investment advisor - This is purely a technical analysis based on chart patterns, indicators, and price action - Past performance and technical patterns do not guarantee future results - Trading and investing in stocks involves substantial risk of loss and may not be suitable for all investors - Always conduct your own research, due diligence, and analysis before making any investment decisions - Consult with a qualified financial advisor before taking any investment positions - The author/analyst holds no responsibility for any profits or losses incurred based on this analysis - Risk management is crucial - never invest more than you can afford to lose - Stop losses are mandatory for capital protection - Markets can remain irrational longer than you can remain solvent
Trade/Invest at your own risk. DYOR (Do Your Own Research).
#BPCL #TechnicalAnalysis #StockMarket #NSE #IndianStocks #Trading #HiddenDivergence #Breakout #OilAndGas #PSU #ChartAnalysis #TradingView #SwingTrading #DayTrading #PriceAction #StockTrading #MarketAnalysis #OMC #EnergyStocks #BullishSetup
Buy MCX#MCX (Multi Commodity Exchange) Technical Analysis Summary
Current Market Price : ₹8,051.50
Dow Theory Analysis
The chart perfectly demonstrates **Dow Theory principles** in action:
Bullish Structure
Higher Highs : Clear progression from previous peaks
Higher Lows : Each dip maintains above previous lows
Fresh Higher High : Recent peak establishing new uptrend confirmation
Key Technical Levels
Daily Resistance : 8,339.00
Weekly Resistance : 8,901.50
Previous ATH : 9,115.00
Multiple Pattern Confirmations
1. Flag & Pole Pattern : - Bullish continuation pattern Suggests upward momentum continuation
2. Harmonic Pattern :
- Trading near point B
- Activation Level : 8,148.50
- 1st Target : 9,115 (Previous ATH)
- 2nd Target : 9,964 (Current projection)
Do your own analysis before Initiating any Trades.

Strong PSU Bank - Indian Bank - Strong BuyIndian Bank - Swing to Short-Term Investment Report
Current Price: 653.10
TECHNICAL SETUP OVERVIEW
Analysis Type: Monthly Chart | Investment Horizon: Short to Medium Term (6-18 months)
Key Observation: After a historic breakout from multi-year resistance, Indian Bank has established itself as a solid structure for accumulation with exceptional return potential.
BREAKOUT TIMELINE & PATTERN
Historical Resistance Battle (2018): Successfully tested 5 consecutive months.
Major Breakout (January 2024) Clean breakout above 2018 resistance level, Significance 6-year base breakout - high probability setup - Follow-through Strong momentum confirmed.
Bull flag Pattern formation, Price Range: 632-736. Building energy for next leg up
Structural Advantages:
1. Clean Breakout Pattern
- No false breaks or whipsaws
- Volume confirms genuine buying
2. Multiple Timeframe Confluence
- Monthly, weekly, daily all aligned bullish
- No conflicting signals
- High probability continuation
3. Measured Move Projections
- Targets based on historical patterns
- Flag pole height projects to 1,050+
- Conservative targets: 813-973
4. Fundamental Support
- PSU bank re-rating theme intact
- Improving asset quality
- Growing dividends (35% YoY growth)
- Strong Q4 profit growth (+31.56%)
Disclaimer: For educational purposes only. Manage risk appropriately and do your own research.
🎯 Trade Smart. Trade Safe. Accumulate Quality.

IndiaMArt - Reversal based on RSI CDIndiaMART (NSE) - Technical Analysis & Trade Setup
Current Price: 2,376.70
Trade Setup Overview
This trade setup is based on RSI Classic Divergence combined with Price Action analysis. The stock has shown a bullish divergence pattern on the RSI indicator while forming a potential bottom around the 2,243-2,377 zone.
Entry Strategy
Entry Type: Aggressive Entry (Current levels)
Confirmation Entry: Only initiate trades after candle closing above **2,437** on a 1:2 risk-reward ratio basis.
Target Levels
- Target 1: 2,459.70 (Fibonacci 0.382 level)
- Target 2: 2,593.00 (Fibonacci 0.618 level)
- Target 3: 2,676.65 (Fibonacci 1.0 extension)
**Potential Upside:** 8.5% to 12.6% from current levels
Risk Management
Stop Loss: 2,252.50 (on candle closing basis)
Risk from Current Price: ~5.2%
Technical Indicators
RSI Analysis
- RSI showing classic bullish divergence
- Price made lower lows while RSI made higher lows
- Current RSI around 62.25, indicating bullish momentum
- RSI breaking above previous resistance zones
Fibonacci Retracement Levels
- 0 (2,243.15) - Recent Low
- 0.382 (2,377.00) - Current Support Zone
- 0.618 (2,518.60) - Key Resistance
- 1.0 (2,676.25) - Extension Target
Key Observations
1. Stock has recovered from the October low of 2,243 levels
2. RSI divergence suggests potential trend reversal
3. Price action forming higher lows, indicating accumulation
4. Multiple Fibonacci resistance levels ahead that may act as profit-booking zones
Important Notes
- This is an **aggressive entry** setup for risk-tolerant traders
- Conservative traders should wait for confirmation above 2,437
- **Strictly maintain stop loss** on closing basis below 2,252.50
- Book partial profits at each target level
- Trail stop loss as price moves in your favor
- Monitor RSI for any bearish divergence at higher levels
Disclaimer
This analysis is for educational purposes only. Please do your own research or consult with a financial advisor before making any investment decisions. Past performance does not guarantee future results.
**Follow for more technical analysis and trade setups!**
#IndiaMART #TechnicalAnalysis #StockMarket #Trading #RSIDivergence #FibonacciTrading #NSE

Kirloskar Oil Engines - Swing TradeKirloskar Oil Engines Limited - Technical Analysis Report
Current Market Price: 1,005.70
MARKET BIAS: BULLISH RECOVERY IN PROGRESS
Kirloskar Oil Engines is currently trading at 1,005.70, showing signs of bottoming out after a significant correction from its all-time highs of ₹1,450+. The stock is now forming a potential reversal pattern.
KEY TECHNICAL OBSERVATIONS:
1. Major Support Zone - HOLDING STRONG ✅
The stock has found solid support in the 900-950 zone, which coincides with:
- Multiple moving average convergence (EMA 20/50/100/200)
- Previous resistance-turned-support from mid-2025
- Psychological round number support at 900
The price has bounced decisively from this zone, suggesting accumulation by institutional investors.
2. Consolidation Rectangle Pattern (Daily/Weekly)
A clear *rectangular consolidation box* :
- Upper Range: 1,016 - 1,050
- Lower Range: 900 - 950
This sideways movement indicates Distribution completion and potential energy buildup for the next directional move.
All major EMAs are converging in the 890-910 zone, creating a strong support cluster.
TARGET ANALYSIS:
Immediate Resistance Targets:
Target 1: 1,180 - 1,200 (First Major Resistance)
- Previous consolidation high from December 2025
- 61.8% Fibonacci retracement of the recent decline
Target 2: 1,334 (Secondary Target)
- Major swing high marked on weekly chart
- Psychological resistance zone
Target 3: 1,450 (Extended Target)
- Previous all-time high zone
- Final resistance before new highs
Critical Support Levels:
- 1,000: Immediate psychological support
- 900-920: MAJOR SUPPORT (EMA cluster + pattern base)
BULLISH BREAKOUT (Higher Probability - 65%)**
CONCLUSION:
Kirloskar Oil Engines is at a Critical juncture with strong technical setup favoring a Bullish breakout. The stock has:
- ✅ Successfully held major support zones
- ✅ Maintained position above all key moving averages
- ✅ Formed higher lows indicating accumulation
- ✅ Built a strong base for the next upward move
Disclaimer: This analysis is for educational purposes only. Please consult with your financial advisor before making investment decisions. Past performance does not guarantee future results.

Long Jsw HoldingsTechnical Overview – JSW Holdings Ltd (Weekly Chart)
The weekly chart of JSW Holdings Ltd indicates that the price is currently stabilizing around the 50-week EMA, suggesting the formation of a potential accumulation base. A classic bullish RSI divergence is observed, signalling weakening downside momentum and the possibility of a medium-term trend reversal.
A confirmation trigger is identified at a weekly close above 18,876, which would indicate renewed buying strength and validate a breakout from the consolidation range. The risk–reward structure is clearly defined, with an estimated downside risk of approximately 18% and an upside potential of about 37% from the trigger level. Momentum indicators, including multiple RSI readings, are turning upward from lower zones, reinforcing the improving sentiment.
Overall, the chart setup reflects an early-stage recovery structure, with a breakout above the defined trigger level required to activate a long trade bias.

Sunpharma Buy - Trade confirmationSunpharma - Bullish Breakout
1) Strong Trendline Breakout
2) From recent low made Higher High
3) Solid Range Breakout
4) EMA crossover and Sorted.
Disclaimer - Charts shared are for educational purposes only. It’s not a trade recommendation. Market are subject to financial risk, Do your own analysis before initiating any Trade.

BharatForge - Swing Trade SetupBullish Setup
Buy already activated. Buy on Dips
1) On weekly TF made Breakout & made strong HH
2) Earlier on prev swing made Hidden Divergence
- Trend Cont Pattern
3) Stock riding on Parallel channel - Channel Top Tgt - 1481
4) EMA’s are sorted confirming Uptrend
Chart shared are for Educational purpose only, chart shared is not a Trade suggestion or recommendation, Do your own analysis, before initiating any Trade.
