Understanding Stock Market TradingBasics of Stock Trading
At its core, stock trading involves purchasing a company’s equity, known as a share, with the expectation that its value will increase over time, providing capital gains or dividend income. Shares represent ownership in a company, giving shareholders certain rights, such as voting at annual general meetings and receiving dividends. The stock market operates under the principles of supply and demand. When demand for a stock increases, its price rises; when supply exceeds demand, the price falls.
There are two main types of stock market participants: retail investors (individuals) and institutional investors (mutual funds, banks, hedge funds, etc.). Retail investors often trade in smaller volumes and rely on personal research or brokerage platforms, whereas institutional investors handle large volumes of trades and have significant market influence.
Stock Exchanges and Trading Platforms
Trading occurs on stock exchanges—centralized platforms where buyers and sellers meet. Globally, major exchanges include the New York Stock Exchange (NYSE), NASDAQ, London Stock Exchange (LSE), and India’s National Stock Exchange (NSE) and Bombay Stock Exchange (BSE). These exchanges enforce strict regulations to ensure transparency, fair pricing, and investor protection.
In addition to traditional exchanges, trading has evolved through online brokerage platforms and mobile apps, which provide real-time market data, charts, and research tools. These platforms allow investors to place different types of orders, such as market orders, limit orders, and stop-loss orders, enabling greater control over trading strategies.
Types of Stock Market Trading
Stock trading is broadly categorized based on the time horizon and strategy:
Day Trading:
Day traders buy and sell stocks within the same trading day, aiming to profit from short-term price fluctuations. They rely heavily on technical analysis, charts, and real-time data. This type of trading is high-risk and requires quick decision-making and strict risk management.
Swing Trading:
Swing traders hold stocks for a few days to weeks, attempting to capture price movements during trends. This approach balances the intensity of day trading with a longer-term perspective and often uses a combination of technical and fundamental analysis.
Position Trading:
Position traders adopt a long-term approach, holding stocks for months or years. Their focus is on the underlying fundamentals of companies, economic trends, and growth potential rather than short-term market fluctuations.
Scalping:
Scalping is a high-frequency trading strategy where traders make numerous trades within minutes or seconds to capture small price differentials. It demands high precision, speed, and low transaction costs.
Fundamental and Technical Analysis
Successful stock trading relies on analysis, which can be divided into fundamental and technical approaches:
Fundamental Analysis:
This involves evaluating a company’s financial health, management, industry position, and growth prospects. Key metrics include earnings per share (EPS), price-to-earnings (P/E) ratio, revenue growth, profit margins, and debt levels. Macroeconomic factors like interest rates, inflation, and GDP growth also influence fundamental analysis. Investors using this method aim to identify undervalued stocks that are likely to grow over time.
Technical Analysis:
Technical analysis studies historical price movements and trading volumes to forecast future trends. Traders use charts, patterns, and indicators such as moving averages, Relative Strength Index (RSI), and Bollinger Bands. This method is widely used in short-term trading strategies like day trading and swing trading.
Many traders combine both methods to maximize insights. For instance, a swing trader may use fundamental analysis to select stocks and technical analysis to determine entry and exit points.
Derivatives and Advanced Trading
Beyond buying and selling stocks, traders can use derivatives such as options, futures, and contracts for difference (CFDs) to hedge risks or speculate.
Options give the right, but not the obligation, to buy or sell a stock at a predetermined price.
Futures are contracts to buy or sell an asset at a future date at a fixed price.
CFDs allow traders to speculate on price movements without owning the underlying asset.
These instruments amplify both potential profits and risks, requiring thorough understanding and careful risk management.
Risk Management and Psychology
Trading involves risk, as prices can fluctuate due to market volatility, economic events, or unexpected company performance. Effective risk management strategies include:
Setting stop-loss orders to limit potential losses
Diversifying across sectors and asset classes
Using position sizing to prevent excessive exposure
Equally important is trading psychology. Emotional control is critical, as fear and greed can drive impulsive decisions. Successful traders cultivate discipline, patience, and the ability to stick to their trading plans even under market stress.
Regulation and Compliance
Stock markets are heavily regulated to protect investors and maintain fair trading. Regulatory bodies, such as the Securities and Exchange Commission (SEC) in the U.S. and the Securities and Exchange Board of India (SEBI), enforce rules on transparency, insider trading, market manipulation, and reporting. Compliance ensures investor confidence and smooth functioning of markets.
Trends and Technology in Trading
Modern stock trading has been transformed by technology. Algorithmic trading and high-frequency trading leverage computers to execute trades at extremely high speeds based on predefined rules. Artificial intelligence and machine learning are increasingly used to analyze market data, detect patterns, and optimize trading strategies. Moreover, mobile trading apps and robo-advisors have democratized access, allowing even small investors to participate actively in markets.
Sustainability and ESG (Environmental, Social, and Governance) investing are also emerging trends, where traders consider non-financial factors while making investment decisions.
Conclusion
Stock market trading is both an art and a science. It provides opportunities for wealth creation, liquidity, and portfolio diversification, but it is not without risks. Success depends on a combination of knowledge, strategy, discipline, and emotional resilience. Whether you are a long-term investor focusing on fundamentals or a short-term trader analyzing technical charts, understanding market dynamics, regulatory frameworks, and risk management principles is essential.
The stock market reflects the broader economy and human behavior, making it a fascinating yet challenging domain. With the right approach, education, and patience, trading can be a rewarding avenue for financial growth and personal development.
Stocktowatch

SOLARINDS - STWP Equity Snapshot📊 STWP Equity Snapshot – SOLARINDS
(Educational | Chart-Based Interpretation)
Solar Industries India Ltd
________________________________________
📌 Intraday Reference Levels (Structure-based | Observational)
Reference Price Zone: 13,739
Risk Reference (Structure Invalidation): 13,089
Observed Upside Zones (Supply Ahead):
14,518 → 15,039
________________________________________
📌 Swing Reference Levels (Hybrid Model | 2–5 Days | Observational)
Reference Price Zone: 13,739
Risk Reference (Structural Breakdown): 12,764
Higher Range Projection (If structure sustains):
15,689 → 17,151
________________________________________
🔑 Key Levels – Daily Timeframe
Support Zones:
13,290 | 13,129 | 12,904
Resistance Zones:
13,766 | 13,901 | 14,062
________________________________________
🔍 STWP Market Read
SOLARINDS is displaying a strong recovery structure from a well-defined demand zone, following an extended corrective phase. Price has reclaimed intermediate resistance with impulsive candles and expanding volume, suggesting renewed buyer dominance rather than a weak pullback bounce.
Momentum indicators remain supportive, with RSI near 64.7, indicating strength without immediate exhaustion. Volume participation is decisively above average (Vol X ~2.11), highlighting institutional involvement during the recovery leg. Overall structure reflects trend continuation potential, while risk remains elevated due to prior overhead supply zones.
________________________________________
📊 Chart Structure & Indicator Summary
Structure: Demand-led recovery with breakout attempt
Trend: Upward bias developing
Momentum: Strong and expanding
RSI: Bullish zone, not overextended
Volume: High, confirming participation
Volatility: Expanding (normal in trend resumption phase)
________________________________________
📈 Final Outlook (Condition-Based)
Momentum: Strong
Trend: Up
Risk: High (wide range & supply overhead)
Volume: High
________________________________________
💡 STWP Learning Note
Strong moves are sustained by structure and participation, not predictions. The edge lies in risk calibration, patience, and clean post-trade reviews—not forecasting outcomes.
________________________________________
⚠️ Disclaimer
This content is an educational market interpretation based on chart structure and publicly available data. It does not constitute investment advice, a recommendation, or solicitation. Markets involve risk. Please consult a SEBI-registered financial advisor before making any trading or investment decision.
📘 STWP Approach
Observe momentum. Respect risk. Let structure guide decisions.
🚀 Stay Calm. Stay Clean. Trade With Patience.
💬 Did this add value?
🔼 Boost to support structured learning
✍️ Share your views or questions in the comments
🔁 Forward to traders who value disciplined analysis
👉 Follow for clean, probability-driven STWP insights
🚀 Stay Calm. Stay Clean. Trade With Patience.
Trade Smart | Learn Zones | Be Self-Reliant 📊

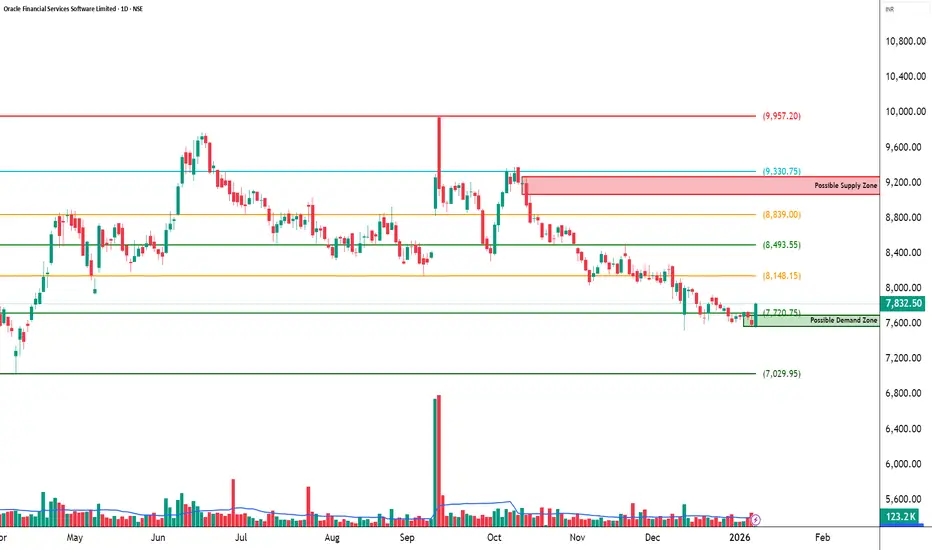
OFSS - STWP Equity SnapshotSTWP Equity Snapshot – OFSS (Educational | Chart-Based Interpretation)
📌 Intraday Reference Levels (Structure-based)
Reference Price Zone: 7,841
Risk Reference (Structure Invalidation): 7,432.87
Observed Upside Zones: 8,330.75 → 8,657.26
📌 Swing Reference Levels (Hybrid Model | 2–5 days | Observational)
Reference Price Zone: 7,841
Risk Reference (Structural Breakdown): 7,324.35
Higher Range Projection (If structure sustains): 8,874.29 → 9,649.27
Key Levels – Daily TF
Support: 7,643 | 7,455 | 7,356
Resistance: 7,931 | 8,030 | 8,219
🔍 STWP Market Read
Oracle Financial Services Software Ltd is attempting a base-building recovery after a prolonged corrective phase. Price has recently reacted positively from a defined demand zone, while overhead supply remains visible across clustered resistance bands. The latest rebound reflects improving participation, though confirmation is still evolving.
Momentum indicators are balanced rather than aggressive, with RSI near 48.48, suggesting stabilization without overextension. Volume remains around average (Vol X ~1.46), indicating participation but not yet a decisive expansion. Overall, the structure points to early stabilization with conditional upside, while risk remains elevated until price sustains beyond nearby supply.
📊 Chart Structure & Indicator Summary
Structure: Corrective base with early rebound
Trend: Improving, not yet dominant
Momentum: Strong recovery attempt, still developing
RSI: Healthy zone — neither stretched nor weak
MACD & ADX: Gradual improvement, trend strength building
Volume: Moderate, awaiting confirmation
📈 Final Outlook (Condition-Based)
Momentum: Strong (developing)
Trend: Improving / Early up-bias
Risk: High (overhead supply & confirmation pending)
Volume: Moderate
💡 STWP Learning Note
Recoveries are processes, not events. Strong outcomes emerge when price structure, momentum, and volume align over time — patience and risk discipline remain essential.
⚠️ Disclaimer:
This is an educational market interpretation based on chart structure and publicly available data. It is not a recommendation, advice, or solicitation. Equity markets involve risk. Please consult a SEBI-registered financial advisor before taking any investment or trading decision.
📘 STWP Approach:
Observe momentum. Respect risk. Let structure guide decisions.
💬 Did this add value?
🔼 Boost to support structured learning
✍️ Share your views or questions in the comments
🔁 Forward to traders who value disciplined analysis
👉 Follow for clean, probability-driven STWP insights
🚀 Stay Calm. Stay Clean. Trade With Patience.
Trade Smart | Learn Zones | Be Self-Reliant 📊
TORNTPHARM - STWP Equity SnapshotSTWP Equity Snapshot – TORNTPHARM (Educational | Chart-Based Interpretation)
📌 Intraday Reference Levels (Structure-based)
Reference Price Zone: 4,104.8
Risk Reference (Structure Invalidation): 3,828.54
Observed Upside Zones: 4,436.31 → 4,657.31
📌 Swing Reference Levels (Hybrid Model | 2–5 days | Observational)
Reference Price Zone: 4,104.8
Risk Reference (Structural Breakdown): 3,607.54
Higher Range Projection (If trend sustains): 5,099.32 → 5,845.21
Key Levels Daily TF
Support: 3983 | 3875 | 3815
Resistance: 4152 | 4213 | 4321
🔍 STWP Market Read
Torrent Pharmaceuticals Ltd is displaying strong momentum continuation within an established uptrend, supported by a clean ascending structure and recent price expansion. The breakout candle reflects decisive participation, with volume expanding sharply above recent averages — indicating institutional involvement rather than speculative noise.
Momentum indicators are stretched, with RSI near 80.95, highlighting short-term euphoria and overextension risk. Trend strength remains intact as price continues to hold above prior consolidation zones, but at elevated levels, risk management and patience become more important than anticipation.
📊 Chart Structure & Indicator Summary
Structure: Ascending channel with higher highs and higher lows
Trend: Developing upward bias
Momentum: Strong, impulsive phase
RSI: Overbought — momentum-driven, not mean-reversion yet
MACD & ADX: Trend strength confirmation
Volume: High conviction participation, breakout-backed
📈 Final Outlook (Condition-Based)
Momentum: Strong
Trend: Up
Risk: High (overbought / euphoric zone)
Volume: High, conviction-led
💡 STWP Learning Note
Strong trends do not require prediction — they demand structure awareness, controlled risk, and disciplined review. Momentum rewards patience, not urgency.
⚠️ Disclaimer:
This is an educational market interpretation based on chart structure and publicly available data. It is not a recommendation, advice, or solicitation. Equity markets involve risk. Please consult a SEBI-registered financial advisor before taking any investment or trading decision.
📘 STWP Approach:
Observe momentum. Respect risk. Let structure guide decisions.
💬 Did this add value?
🔼 Boost to support structured learning
✍️ Share your views or questions in the comments
🔁 Forward to traders who value disciplined analysis
👉 Follow for clean, probability-driven STWP insights
🚀 Stay Calm. Stay Clean. Trade With Patience.
Trade Smart | Learn Zones | Be Self-Reliant 📊

Tata Technologies | EMA50 Breakout + RSI Momentum________________________________________
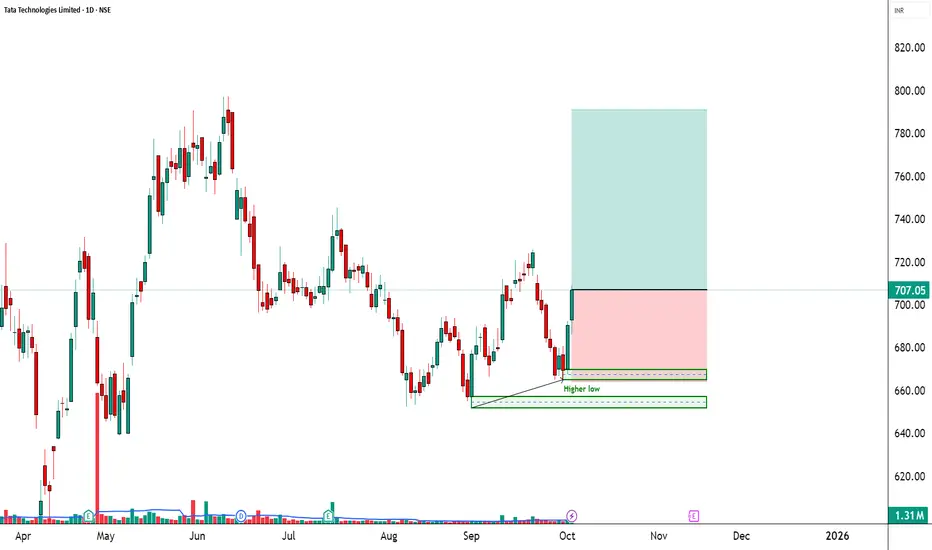
🚀 Tata Technologies | EMA50 Breakout + RSI Momentum
🔹 Entry Zone: ₹707.05
🔹 Stop Loss: ₹664.20 – ₹664.25 (Risk ~42 pts)
🔹 Supports: 692.47 / 677.88 / 669.62
🔹 Resistances: 715.32 / 723.58 / 738.17
________________________________________
🔑 Key Highlights
✅ Volume Breakout → 1.31M vs avg 1.08M (Smart buying visible)
✅ EMA50 Breakout → trend shift signal
✅ RSI Breakout → momentum favoring bulls
✅ Bollinger Squeeze-Off → volatility expansion expected
________________________________________
🎯 STWP Trade View
📊 Structure shows bullish momentum building. If ₹715.32 is crossed, upside can stretch towards ₹723–738.
⚠️ Supports at ₹692 & ₹678 are crucial for maintaining this momentum.
________________________________________
💡 Learning Note
This setup is a classic example where EMA + RSI + Volume breakout alignment confirms the probability of a short-term bullish rally.
________________________________________
⚠️ Disclosure & Disclaimer – Please Read Carefully
The information shared here is meant purely for learning and awareness. It is not a buy or sell recommendation and should not be taken as investment advice. I am not a SEBI-registered investment adviser, and all views expressed are based on personal study, chart patterns, and publicly available market data.
Trading—whether in stocks or options—carries risk. Markets can move unexpectedly, and losses can sometimes exceed the money you have invested. Past performance or past setups do not guarantee future results.
If you are a beginner, treat this as a guide to understand how the market works and practice on paper trades before risking real money. If you are experienced, always assess your own risk, position sizing, and strategy suitability before entering trades.
Consult a SEBI-registered financial adviser before making any real trading decision. By engaging with this content, you acknowledge full responsibility for your trades and investments.
💬 Found this useful?
🔼 Give this post a Boost to help more traders discover clean, structured learning.
✍️ Drop your thoughts, questions, or setups in the comments — let’s grow together!
🔁 Share with fellow traders and beginners to spread awareness.
👉 “If you liked this breakdown, follow for more clean, structured setups with discipline at the core.”
🚀 Stay Calm. Stay Clean. Trade With Patience.
Trade Smart | Learn Zones | Be Self-Reliant 📊
HEROMOTOCO – Wave 5 Setup Unfolding After Ideal Wave 4 📘 HERO MOTOCORP – Wave 5 Setup from Textbook Elliott Structure
Timeframe: Weekly
Structure: Impulsive (1–2–3–4 complete) → Preparing for Wave 5
Type: Positional Swing Setup | Elliott Wave Based
🔍 1. Elliott Wave Structure Breakdown:
Wave 1: ₹1,475 to ₹3,629
Wave 2: Retraced to ₹2,146.85 (between 50%–78.6% Fib of Wave 1)
Wave 3: Impulse to ₹6,246.25
Wave 4: Currently correcting between 38.2%–61.8% Fib of Wave 3 (₹4,680–₹3,712)
✅ Price found support near ₹3,344, which is just below 61.8% retracement – a common zone for Wave 4 completion.
🟫 2. Wave 4 Support Zone – ₹3,712 to ₹3,344:
This zone is acting as a potential reversal base with:
Fib retracement confluence: 38.2%–61.8% of Wave 3
Failed breakdown attempts followed by recovery candles
CHoCH observed in lower timeframes – suggests momentum shift
🟩 3. Breakout Confirmation Level – ₹4,680:
Breaking above ₹4,680–₹4,800 range would confirm Wave 5 activation
Indicates structure validation + bullish resumption
Close above this zone = strength & momentum breakout
📈 4. Wave 5 Target Projection – ₹6,595 to ₹7,019:
Calculated using:
113%–127% Fibonacci extension of Wave 3
Historical rally symmetry from Wave 1 and 3
Target zone offers positional upside potential of ~55%+
🛑 5. Stop Loss & Invalidation Level:
SL Zone: ₹3,344
Sustained breakdown below this invalidates Wave 4 base
Can lead to sharp drop toward ₹2,600–2,900 (next Fib cluster)
✅ 6. Trade Plan (Swing):
Accumulation Zone: ₹3,700 – ₹4,300 (if support structure holds)
Breakout Entry: Close above ₹4,680–4,800
Stop Loss: ₹3,344
Target: ₹6,595–7,019 (Wave 5 zone)
🧠 7. Why This Setup Matters:
Elliott Wave Confluence: Clean 1–2–3–4 formation
Textbook Fib Behavior: Wave 2 and Wave 4 within ideal retracement ranges
Defined R:R Structure: Tight invalidation + 1:2+ reward
Momentum Setup: Wave 5 can unfold rapidly once confirmed
📌 Conclusion:
HERO MOTOCORP is poised for a potential Wave 5 rally after a well-behaved corrective Wave 4.
A breakout above ₹4,680 could trigger bullish continuation toward ₹7,000+.
This is a classic trend continuation setup for wave-based swing traders.

PEL : Golden Retracement • Demand Reaction • Risk-Defined Trade📊 PRIMAL ENTERPRISES | 2H STRUCTURE-BASED SWING SETUP
Golden Retracement | Demand Reaction | Risk-Defined Trade
📌 Chart Context & Market Structure
Price has completed a strong impulsive decline from the prior swing high and is now reacting from the Golden Retracement Zone (Fib 50%–78%), which historically acts as a decision area between trend continuation and deeper correction.
This zone also overlaps with a higher timeframe demand pocket, increasing its technical significance.
Key observations from the chart:
Strong bearish impulse followed by slowing downside momentum
Price testing Fib 50%–78% retracement → value re-assessment zone
Clear invalidation level marked via hourly close below demand
🔍 Why This Zone Matters (Educational Insight)
📌 The golden retracement zone represents an area where:
Smart money evaluates whether the prior trend is still valid
Late sellers get absorbed by institutional demand
Failed demand here often leads to accelerated downside due to liquidity vacuum
If buyers defend this zone, price usually transitions into a corrective → impulsive recovery.
If demand fails, price seeks the next high-liquidity support below.
📈 Bullish Projection (Primary Scenario)
If price:
Holds above the golden retracement zone
Forms higher lows on lower timeframes
Shows acceptance above the immediate resistance
➡️ Expect a structural recovery phase.
Upside Path (Projection):
Near-term resistance breakout → momentum pickup
Sustained move above 1,237 confirms strength
Swing expansion toward 1,274 – 1,289 zone
This aligns with a mean-reversion + trend resumption structure.
📉 Bearish Risk Scenario (If Demand Fails)
If price:
Fails to attract buying interest within Fib 50%–78%
Breaks demand with an hourly close below 1,082
📌 It signals demand exhaustion and breakdown of value perception, increasing the probability of a deeper corrective leg toward the next higher-timeframe demand zone below.
This is why risk is clearly defined, not assumed.
🎯 Trade Strategy (Educational, Not Advisory)
Bullish Swing Strategy:
Entry: Demand hold + bullish structure confirmation
Stop Loss: Hourly close below 1,082
Targets: Partial near resistance → Swing target 1,274 – 1,289
Risk Management Logic:
Trade is invalid if demand fails — no hope-based holding
Position sizing based on SL distance
Patience required; no chasing breakouts
🧠 Key Learning Takeaway
📌 When price reacts at the golden retracement:
Acceptance = trend continuation
Rejection = deeper correction
The goal is not prediction — it is preparing for both outcomes with clarity and discipline.
🧾 Conclusion
This setup offers:
Clear structure
Defined risk
Favorable risk-reward if demand holds
Let price confirm. Let structure guide. Let risk stay controlled.
⚠️ Disclaimer
I am not a SEBI-registered analyst. This analysis is for educational purposes only. Please conduct your own analysis or consult a qualified financial advisor before taking any trades.

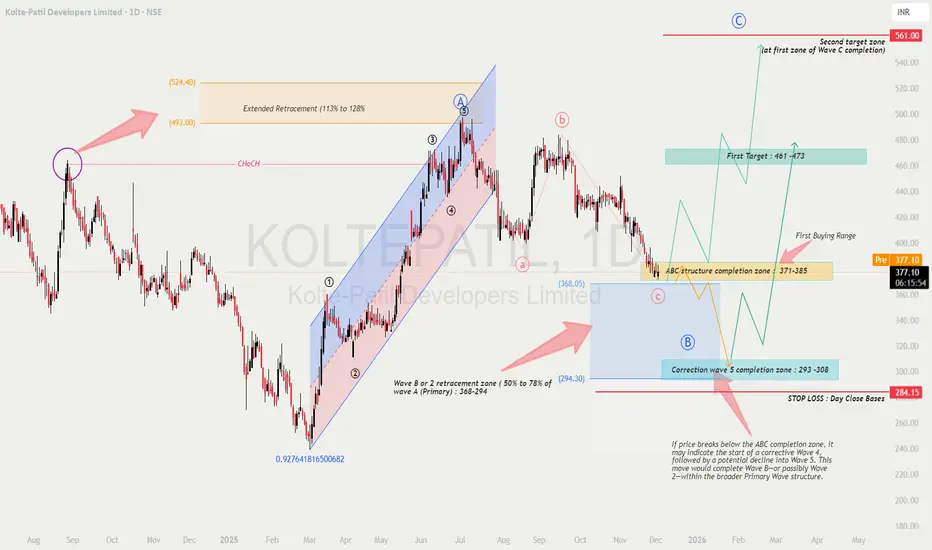
KOLTEPATIL - Wave Analysis
Educational breakdown based solely on chart structure
🔍 1. Chart Findings & Market Structure
The chart shows a clear Elliott Wave progression, where the previous impulse (Primary Wave A) topped near ₹493–524, followed by a corrective ABC decline.
✔ Key Observations
Primary Wave A formed an impulsive rally inside a rising channel.
The price later broke structure (CHoCH) indicating loss of momentum.
Current price (₹377) is trading inside the ABC structure completion zone of ₹371–385, a critical decision area.
A deeper correction toward ₹293–308 remains possible if Wave C extends.
🎓 2. Educational Points (Why These Levels Matter)
📘 A. Extended Retracement Zone: 113–128%
The chart marks ₹493–524 as the extended retracement area, which often acts as:
A wave A termination area
Strong reversal zone
Liquidity grab region
This supports the idea that the major impulse from March–July is complete.
📘 B. Wave B / Wave 2 Retracement
A natural correction for Wave B or Wave 2 typically pulls back 50–78% of the previous impulse.
This gives the ₹368–294 broad range as the acceptable retracement.
📘 C. Completing Wave C (Corrective ABC)
Wave C generally equals Wave A or 1.272–1.618 extension of Wave A.
The chart’s projection supports a potential completion:
First zone: ₹371–385 (current test)
Final zone: ₹293–308 (if extended C-wave unfolds)
📉 3. Current Price Action Insight
Price is currently hovering near the ABC structure completion zone (₹371–385).
No strong bullish reversal candle is visible yet—indicating buyers are waiting for confirmation.
Price remains in a downward corrective structure, but nearing exhaustion.
This phase is ideal for planning, not rushing.
🔮 4. Future Prediction Based on Wave Theory
Two scenarios emerge:
🟦 Scenario 1: ABC Correction Completes at Current Levels (₹371–385)
If the current demand zone holds:
Price forms a wave B bottom and begins Primary Wave C upward.
Expected targets:
🎯 First Target: ₹461–473
🎯 Final Target: ₹561 (Primary Wave C completion zone)
🟥 Scenario 2: ABC Correction Extends to ₹293–308
If ₹371–385 fails:
Market enters the correction wave 5 completion zone (₹293–308).
From this demand block, a stronger bullish reversal is expected.
Long-term bullish structure remains intact if it stays above ₹284 (stop level).
🛒 5. Buying Strategy (Educated Approach)
🟩 FIRST BUYING RANGE: ₹371–385 (Conservative Entry)
Enter only if:
Strong bullish candle (engulfing / pin bar / OB reclaim)
RSI bullish divergence
Price closes above structure high (minor CHoCH)
🟦 SECOND BUYING RANGE: ₹293–308 (High-Value Entry)
A deeper correction provides:
Lower risk
Maximum R:R
Stronger probability of reversal
Use this zone if the first one fails.
⚖ 6. Risk–Reward Analysis
If entering at ₹371–385
Stop-Loss: Below ₹284 (daily close basis)
Upside Potential: Up to ₹561
Reward : Risk Ratio: Approx 3.5–4.2 R
If entering at ₹293–308
Stop-Loss: Below ₹284
Upside Potential: Up to ₹473–561
Reward : Risk Ratio: Approx 5–7 R (excellent)
🔐 7. Confirmation Strategies for Better Entries
Use any two or more of the following:
✔ 1. Market Structure Shift
Wait for a CHoCH above the last swing high inside the zone.
✔ 2. Volume Expansion
Rising green volume during rebound increases reliability.
✔ 3. Bullish Divergence (RSI or MACD)
Signals weakening sellers.
✔ 4. Break & Retest Method
Let price break a minor resistance
Enter on retest to confirm strength
✔ 5. Demand Zone Reaction
Look for:
Long tail candles
Absorption wicks
Order block reclaim
These indicate smart money interest.
🧠 8. Summary & View
The stock is in the final leg of a correction and is approaching highly reactive Fibonacci zones.
Structure favors a bullish wave (Primary Wave C) in the coming months if key support holds.
📌 First confirmation: Bounce from ₹371–385
📌 Strongest bullish case: Reversal from ₹293–308
📌 Invalidation: Close below ₹284
The long setup has strong wave logic, clean levels, and attractive R:R.
⚠️ Disclaimer
This analysis is for educational purposes only and reflects wave-structure interpretation based solely on the provided chart.
I am not a SEBI-registered analyst.
Please conduct your own research or consult your financial advisor before trading or investing.
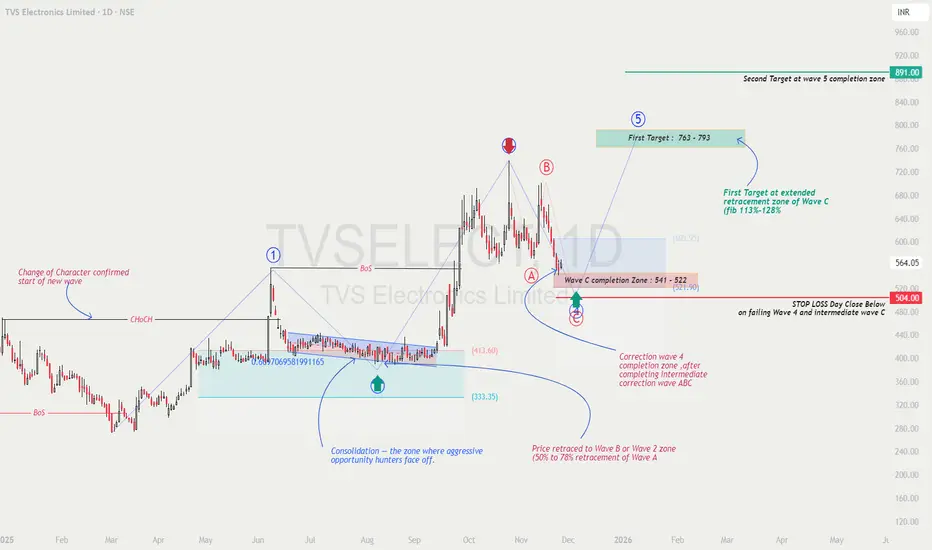
High-Probability Elliott Wave Setup on TVSELECTTVS ELECTRONICS – Wave C Completion Zone Hit | Wave 5 Rally Setup Loading?
🧠 Market Structure & Wave Breakdown
TVS Electronics is forming a textbook Elliott Wave structure.
After a powerful impulsive Wave 1, the price has completed a clean A–B–C corrective phase, and is now sitting inside the crucial Wave C completion zone (₹541–₹522) 🔥.
This zone aligns with:
50–78% retracement of Wave A (typical Wave B/2 retracement)
Demand + structure support from previous consolidation
Market psychology reset after an overextended Wave B
This is where the early reversal of Wave 5 typically begins 📈.
📚 Educational Insights
🔄 ChoCH – Change of Character:
The earlier breakout confirmed a structural shift, marking the start of the new Elliott Wave cycle.
When ChoCH appears again near lows, it often signals the end of corrections.
📉 A–B–C Corrections Explained:
Price forms Wave A (sharp drop) → Wave B (retracement) → Wave C (final flush).
Wave C often completes at deeper zones like the 113–128% extension, which aligns with this chart.
🌀 Wave C Completion Zone (541–522):
This zone marks exhaustion of sellers and transition to accumulation, especially when aligned with fibs AND structural support.
🚀 Wave 5 Expectations:
Wave 5 is usually driven by renewed momentum, volume expansion, and trend continuation.
Targets come from fib extensions of Wave 4.
🎯 Prediction & Targets
If the price reverses from the ₹541–₹522 support and breaks structure upward:
🎯 First Target (Wave 5 Mid-Zone): ₹763 – ₹793
🎯 Second Target (Wave 5 Completion): ₹891
A break above ₹605.95 (previous micro-structure high) will confirm the bullish wave activation.
🛑 Stop Loss (Closing Basis): Below ₹504
This level invalidates the Wave 4 / Wave C completion structure.
💡 Trading Strategy (Educational Purpose Only)
🟢 Entry Zone: ₹541–₹522
Look for bullish reversal patterns → Hammer, Engulfing, Double Bottom, or ChoCH.
📈 Confirmation Entry:
Break above ₹605.95 + retest → safer Wave 5 trend-following entry.
🎯 Profit Booking:
• Partial at ₹763–₹793
• Final around ₹891
⚖️ Risk Management:
• Use SL below ₹504 (daily close).
• Risk max 1–2% of capital.
• Don’t chase candles — wait for clean structure break.
🧩 Summary & Outlook
TVS Electronics has now entered the Wave C completion zone, a high-probability demand and reversal area.
If buyers step in here and structure flips bullish, a Wave 5 rally toward ₹763 → ₹891 could unfold.
This setup aligns perfectly with Elliott Wave principles, Fibonacci confluence, and structural demand. ⚡
⚠️ Disclaimer
I am not a SEBI-registered analyst.
This analysis is for educational purposes only — not financial advice.
BharatForge - Swing Trade SetupBullish Setup
Buy already activated. Buy on Dips
1) On weekly TF made Breakout & made strong HH
2) Earlier on prev swing made Hidden Divergence
- Trend Cont Pattern
3) Stock riding on Parallel channel - Channel Top Tgt - 1481
4) EMA’s are sorted confirming Uptrend
Chart shared are for Educational purpose only, chart shared is not a Trade suggestion or recommendation, Do your own analysis, before initiating any Trade.

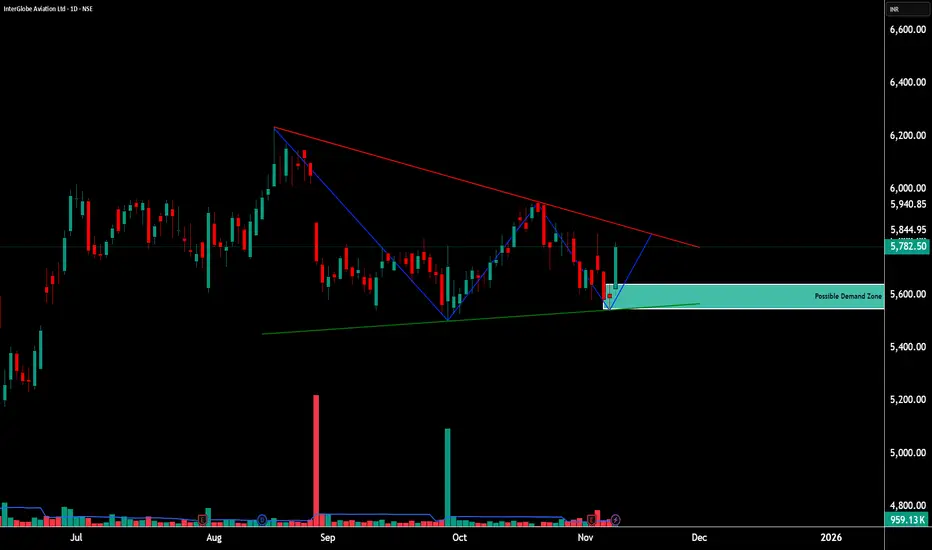
INDIGO – Calm Under Pressure | Demand Zone Commands Respect💹 InterGlobe Aviation Ltd (NSE: INDIGO)
Sector: Aviation & Transport Services | CMP: ₹5,782.50 | View: Descending Structure + Demand Zone Reaction
________________________________________
📊 Price Action
InterGlobe Aviation continues to move within a descending structure, maintaining a controlled series of lower highs under the falling red trendline.
Each time the stock has dipped, it has found support around the ₹5,450–₹5,650 demand zone, a region that has consistently attracted buying interest.
The latest daily candle shows renewed strength emerging from this zone, supported by a clear rise in volume — indicating that the market continues to respect this level.
On the daily chart, IndiGo has formed a descending triangle, and at the far end of this structure lies a well-defined demand zone, suggesting that the stock may be preparing for a possible directional move in the near future.
________________________________________
🧭 Support & Resistance
Support 1: ₹5,663 | Support 2: ₹5,523 | Support 3: ₹5,450
Resistance 1: ₹5,855 | Resistance 2: ₹5,928 | Resistance 3: ₹6,058
Price continues to oscillate between a firm demand base and a declining resistance line, reflecting ongoing compression before expansion.
________________________________________
🧠 STWP Technical Note
The internal readings indicate a balanced phase — neither overly bullish nor weak.
Volume behaviour remains steady near the base, with improving momentum signatures.
Several key internal parameters have begun aligning positively, but the setup still awaits broader confirmation. ________________________________________
🎯 Final Outlook
IndiGo currently stands at a critical juncture — price is testing the limits of its descending structure while buyers continue to defend the lower band.
Momentum is beginning to build, and volume expansion near the base reinforces confidence in the demand zone.
As long as price respects ₹5,600 and holds above the demand base, the chart maintains a neutral-to-positive bias, with scope for a gradual shift toward the upper range of the pattern.
________________________________________
⚠️ Disclosure & Disclaimer – Please Read Carefully
This post is created purely for educational and informational purposes and does not constitute investment advice or a buy/sell recommendation.
I am not a SEBI-registered investment adviser. All observations are based on technical studies and publicly available information.
Trading and investing involve risk; please manage position size and stop-loss discipline as per your risk profile.
Always consult a SEBI-registered financial advisor before making trading decisions.
________________________________________
Position Status: No active position in (INDIGO) at the time of analysis.
Data Source: TradingView & NSE India
💬 Found this useful?
🔼 Boost this post if you value clean, structured analysis.
💭 Drop your views — can Torrent Pharma sustain this breakout above ₹3,835?
🔁 Share this with traders who track institutional breakouts.
👉 Follow for more price-action based institutional setups.
🚀 Stay Calm. Stay Clean. Trade With Patience.
Trade Smart | Learn Zones | Be Self-Reliant 📊
________________________________________
Rising Wedge Formation | Bullish Engulfing💹 BSE Ltd (NSE: BSE)
Sector: Financial Services | CMP: ₹2,678.30 | View: Rising Wedge + Bullish Exhaustion Setup
📊 Price Action:
BSE Ltd witnessed a powerful uptrend from ₹2,020 to ₹2,718, supported by heavy institutional participation and strong price momentum.
The stock recently posted a 20-day volume breakout, followed by a bullish engulfing candle, signaling strong buying strength at lower levels.
However, post this rally, the price structure has developed into a Rising Wedge pattern, indicating momentum exhaustion and potential short-term consolidation.
The recent rejection near ₹3,030 swing high suggests supply pressure building at upper resistance zones, aligning with the wedge’s narrowing structure.
💼 HNI Trade Levels (STWP Setup):
Aggressive Entry: ₹2,678–₹2,718 | Stop Loss: ₹2,425
Low-Risk Entry: ₹2,595 | Stop Loss: ₹2,415
The near-term trend remains upward but stretched.
HNI and swing traders should monitor the ₹2,595–₹2,650 zone closely — this area represents both the 61.8% Fibonacci retracement and the wedge support base.
Sustaining above it will keep the setup active; a breakdown below ₹2,595 could shift the structure into a corrective phase.
📉 Chart Pattern Analysis – Rising Wedge (Bearish Reversal Bias):
The current structure represents a Rising Wedge formation, identified by two upward-sloping, converging trendlines.
This pattern often develops after strong rallies, marking the final leg of an existing uptrend before a corrective phase begins.
In BSE’s case, the wedge indicates that buying momentum is weakening as the range tightens, while volumes remain high — a sign of profit booking within strength.
The confirmation trigger for reversal would be a breakdown below ₹2,595. Until then, the structure remains short-term bullish but with an elevated risk of pullback.
A breakdown could potentially extend retracement toward ₹2,525–₹2,450.
📈 STWP Trading Analysis:
Entry: ₹2,678–₹2,718 | Stop Loss: ₹2,425.50
The breakout candle displayed exceptional strength with a 20.3M volume surge against a 5.65M average, confirming institutional footprints and momentum expansion.
The price is currently sustaining above its short- and mid-term EMAs, with trend alignment visible across the daily and weekly timeframes.
Holding above ₹2,644–₹2,595 (critical Fibonacci and structural zone) will maintain the bullish bias, keeping the setup active toward ₹2,783–₹2,888 in the near term.
A sustained close above ₹2,888 could further extend the move toward ₹3,030, whereas a breakdown below ₹2,595 may trigger pattern invalidation and shift bias toward ₹2,525–₹2,450 support zones.
📈 Candlestick Pattern – Bullish Engulfing at Apex:
A Bullish Engulfing Candle formed on 4 Nov 2025, initiating the final upward leg from ₹2,443 to ₹2,718.
While it reflected strong buying enthusiasm, the placement of this candle near the apex of the wedge signals possible buyer exhaustion.
Such engulfing candles late in a trend often act as final thrust candles, marking distribution zones rather than breakout initiation.
This makes it essential for traders to track whether follow-up candles sustain strength or fade under resistance.
📏 Fibonacci Analysis:
From swing low ₹2,021.50 to swing high ₹3,030.0:
61.8% retracement @ ₹2,644 → Key structural support.
50% retracement @ ₹2,525 → Ideal pullback level.
38.2% retracement @ ₹2,406 → Deeper retracement aligned with wedge base.
The stock currently trades near the 61.8% golden zone, making ₹2,595–₹2,644 a crucial area for short-term trend control.
A close below this range may invite a deeper retracement, while sustained strength above ₹2,678 could revive momentum toward ₹2,888–₹3,030.
🧭 STWP Support & Resistance:
Resistances: ₹2,783 | ₹2,888 | ₹3,059
Supports: ₹2,595 | ₹2,525 | ₹2,406
The ₹2,980–₹3,020 range acts as a weak resistance zone, where mild profit booking or supply pressure may emerge if momentum continues upward.
On the downside, the ₹2,020–₹2,070 belt continues to serve as a strong structural support zone, backed by historical accumulation and institutional demand footprints.
📊 STWP Volume & Technical Setup:
Today’s volume stood at 20.3M shares vs 5.65M average, signaling heavy institutional activity and potential position rotation post-breakout.
RSI remains elevated near 69, while Stochastic (90) suggests short-term overbought conditions — hinting at a likely consolidation phase ahead.
MACD continues to stay in the bullish zone but shows flattening momentum, consistent with the wedge’s tightening structure.
Trend Direction: UPTREND (Weakening) | Volume Confirmation: High with Distribution Bias
🧩 STWP Summary View:
Final Outlook:
Momentum: Strong | Trend: Bullish | Risk: High | Volume: High
BSE Ltd remains structurally bullish but technically stretched after a steep rally and volume breakout. The Rising Wedge formation, combined with the Bullish Engulfing near the top, reflects a maturing uptrend with signs of short-term exhaustion. Holding above ₹2,595 keeps the pattern valid, but traders should remain cautious of volatility and potential profit booking as the structure nears completion.
⚠️ Disclosure & Disclaimer – Please Read Carefully
This post is created solely for educational and informational purposes and should not be interpreted as investment advice or a buy/sell recommendation.
I am not a SEBI-registered investment adviser. All views are based on technical analysis and publicly available market data.
Trading involves significant risk. Always apply risk management, follow position sizing discipline, and consult a SEBI-registered financial advisor before acting on any trade.
Position Status: No active position in (BSE) at the time of this analysis.
Data Source: TradingView & NSE India
💬 Found this useful?
🔼 Give this post a Boost to help more traders discover structured, professional analysis.
💭 Drop your insights — will BSE’s wedge resolve in continuation or correction?
🔁 Share this with your trading circle to promote disciplined chart-based analysis.
👉 Follow for more institutional-style breakdowns blending price action, structure, and volume logic.
🚀 Stay Calm. Stay Clean. Trade With Patience.
Trade Smart | Learn Zones | Be Self-Reliant 📊

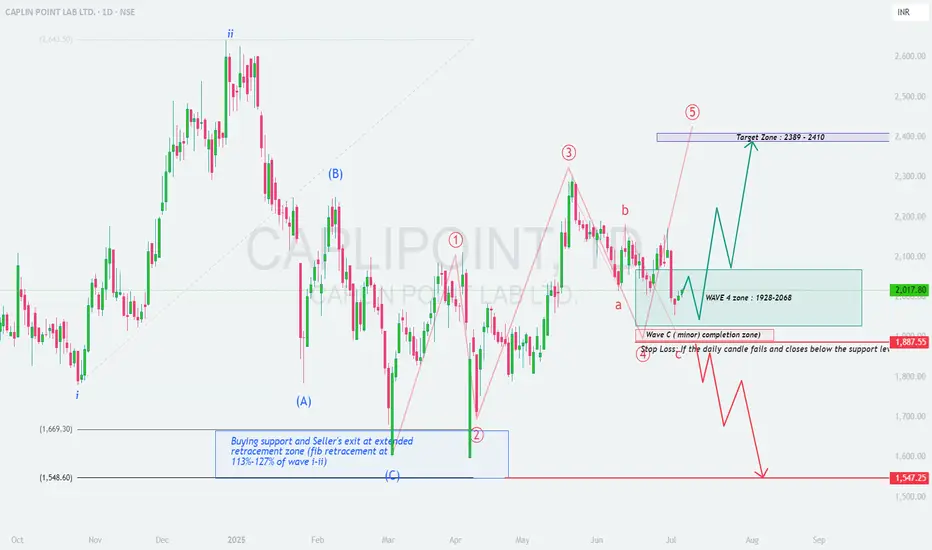
CAPLIPOINT : A Textbook Elliott Wave Correction Unfolding
\ Timeframe:\ Daily
\ Structure:\ Corrective to Impulsive
\ Type:\ Educational Swing Setup
---
🔍 \ 1. Context and Background:\
CAPLIPOINT has exhibited a classic 5-wave impulsive rally followed by a correction phase, aligning neatly with \ Elliott Wave Theory\ . Currently, the stock appears to be in \ Wave 4 correction\ – often a shallow, sideways or ABC-type pattern – preparing for a potential \ Wave 5 impulse\ .
---
📈 \ 2. Wave Structure Breakdown:\
* \ Wave 1 to Wave 3\ completed with good strength.
* \ Wave 3\ peaked near \ ₹2390\ , showing signs of extension.
* The ongoing \ Wave 4 correction\ seems to be forming a textbook \ ABC pattern\ :
* \ Wave A and Wave B\ completed.
* \ Wave C\ likely completed or very close to completion inside the support zone.
---
🟦 \ 3. Wave 4 Correction Zone – ₹1928 to ₹2068:\
This zone offers a \ high-probability reversal area\ supported by:
* \ 38.2%–50% Fibonacci retracement\ of Wave 3.
* Confluence with \ previous consolidation\ support.
* Price action showing \ long wicks and small candles\ , signaling accumulation or demand.
---
🟥 \ 4. Wave C and Critical Support – ₹1887:\
* ₹1887 is likely the \ end of Wave C\ and the complete ABC correction.
* Based on:
* \ 113%–127% Fibonacci extension\ of Wave A (classic C-wave completion area).
* Strong \ volume spike and price rejection\ near this zone.
---
🟪 \ 5. Wave 5 Target Projection – ₹2389 to ₹2410:\
Projected using:
* \ Fibonacci extension\ of Wave 1 from Wave 4 low.
* \ Measured move technique\ .
* Target aligns with previous resistance around \ Wave 3 top at ₹2390\ .
---
🛑 \ 6. Stop Loss & Invalidation Level:\
* \ Invalidation below ₹1887\ on a daily close.
* A close below this would signal a potential \ deeper correction\ toward ₹1547–1660 zone.
---
✅ \ 7. Strategic Swing Trade Plan:\
* \ Entry Zone:\ ₹1930 – ₹2065
* \ Stop Loss:\ ₹1887 (daily close basis)
* \ Target 1:\ ₹2250
* \ Target 2:\ ₹2389–2410 (projected Wave 5 zone)
---
### 🧠 \ 8. Why This Setup is Educational:\
* \ Textbook Elliott Wave Pattern:\ Classic 5-wave setup with ABC correction.
* \ Fibonacci Confluence:\ Retracement and extensions align perfectly.
* \ Price Action Validation:\ Support zone showing bullish characteristics.
* \ Defined Risk-Reward:\ Excellent R\:R with tight SL.
* \ Momentum Potential:\ Wave 5 often brings sharp, fast moves—ideal for swing setups.
---
📌 \ Conclusion:\
CAPLIPOINT is completing a clean \ Wave 4 correction\ and preparing for its \ final impulsive Wave 5\ . If \ ₹1887\ holds, the stock may target \ ₹2389–2410\ in the coming sessions. A technically rich and structurally strong swing opportunity for serious traders and wave enthusiasts.
Bullish Momentum Revival Near Key Support | STWP💹 Aurobindo Pharma Ltd (NSE: AUROPHARMA)
Sector: Pharmaceuticals | CMP: ₹1,138.90 | View: Bullish Momentum Setup
📊 Price Action:
Aurobindo Pharma shows strong bullish momentum after reclaiming key support zones near ₹1,100.
The stock has printed a bullish engulfing candle with institutional-grade volume, signaling a potential continuation of the uptrend.
Price action confirms demand absorption at lower levels with buyers defending the ₹1,080–1,100 zone effectively.
💼 HNI Trade Levels (STWP Setup):
Aggressive Entry: ₹1,138.90–₹1,155.80 | Stop Loss: ₹1,087.35
Low-Risk Entry: ₹1,137.12 | Stop Loss: ₹1,080.02
The STWP HNI Setup reflects a well-defined bullish structure supported by EMA 200 crossover and strong candle confirmation.
Smart money activity is visible through expanding volume footprints and VCP contraction signs fading toward breakout.
📉 VCP Analysis:
Aurobindo Pharma has undergone 112 VCP contractions, forming a tight base before breakout attempts.
Although the current candle is yet to confirm a clean VCP breakout, the setup suggests a pre-breakout stage, aligning with institutional interest.
The ongoing contraction phase combined with a bullish RSI breakout supports accumulation by strong hands.
📈 STWP Trading Analysis:
Entry: ₹1,155.80 | Stop Loss: ₹1,098.70 | Risk: ₹57.10
The bullish structure is reinforced by a 5x volume expansion and a strong buyer-dominated candle.
EMA 200 crossover, MACD bullish alignment, and RSI strength above 52 confirm upside bias.
Holding above ₹1,120 keeps the short-term structure firmly bullish toward ₹1,177–₹1,208 levels.
📏 Fibonacci Analysis:
From the swing low of ₹1,016.10 to the recent swing high of ₹1,208.20 — price currently hovers around the 61.8% retracement zone at ₹1,134.82, a critical Fibonacci pivot.
Sustaining above this level indicates strength and supports the ongoing uptrend.
Fibonacci extensions project targets near ₹1,208–₹1,218 on breakout confirmation.
🧭 STWP Support & Resistance:
Resistances: ₹1,163.13 | ₹1,187.37 | ₹1,218.93
Supports: ₹1,107.33 | ₹1,075.77 | ₹1,051.53
The ₹1,075–₹1,107 zone serves as a strong institutional support, aligning with prior demand clusters.
Weak resistance pockets lie between ₹1,163–₹1,208, opening space for a clean momentum push if price sustains above ₹1,155.
📊 STWP Volume & Technical Setup:
Today’s volume surged to 3.56M vs 1.3M average, confirming high institutional participation.
The chart highlights multiple technical confirmations — a strong EMA crossover, momentum breakout, and volatility expansion supported by a bullish candle formation.
Key momentum oscillators are turning upward, reflecting renewed strength and sustained bullish bias across timeframes.
🧩 STWP Summary View:
Final Outlook:
Momentum: Strong | Trend: Uptrend | Risk: High| Volume: High
Aurobindo Pharma is exhibiting robust institutional footprints with trend confirmation across all major indicators.
As long as the price holds above ₹1,107–₹1,120, the structure remains intact with scope for a short-term move toward ₹1,177–₹1,208.
The bias remains bullish with uptrend continuation potential into the next few sessions.
⚠️ Disclosure & Disclaimer – Please Read Carefully
This post is shared only for educational and informational purposes. It is not a buy/sell recommendation or financial advice.
I am not a SEBI-registered investment adviser; all views are based on technical observation and public market data.
Trading involves risk. Market movements can be unpredictable and may result in losses.
Always perform your own research or consult a SEBI-registered financial advisor before trading.
Position Status: No active position in (AUROPHARMA) at the time of this analysis.
Data Source: TradingView & NSE India
💬 Found this useful?
🔼 Give this post a Boost if you value structured, professional breakdowns.
✍️ Share your thoughts or charts below — let’s learn together!
🔁 Spread this post to help more traders adopt data-driven analysis.
👉 Follow for more clean, institutional-style setups with clarity and discipline.
🚀 Stay Calm. Stay Clean. Trade With Patience.
Trade Smart | Learn Zones | Be Self-Reliant 📊

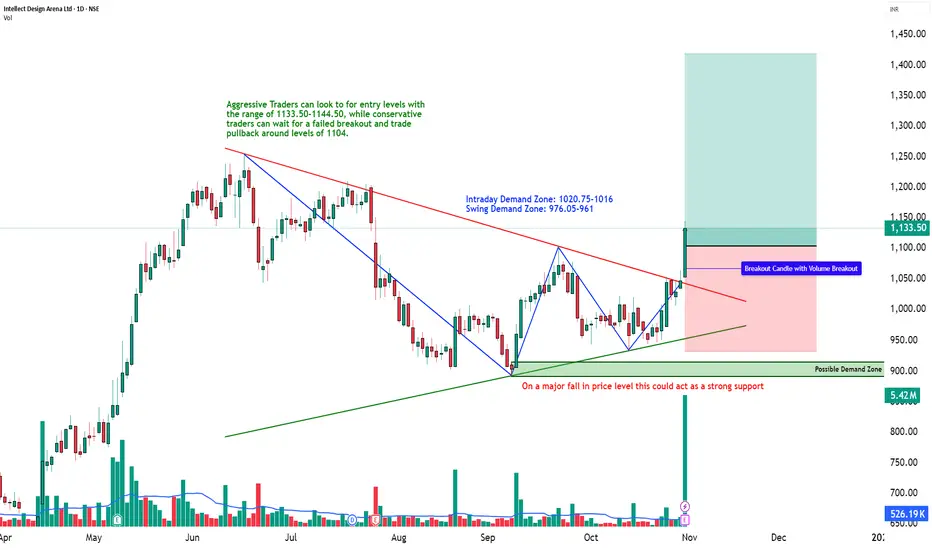
Descending Triangle Breakout with Institutional Volume | STWP💹 Intellect Design Arena Ltd (NSE: INTELLECT)
Sector: IT – FinTech Solutions | CMP: ₹1,133.50 | View: Bullish Momentum Breakout Setup
📊 Price Action:
Intellect Design Arena has delivered a strong bullish breakout from its multi-month descending trendline, marking a structural shift from a consolidation base to a clear uptrend.
The stock reversed sharply from the ₹890 swing low and confirmed momentum above the ₹1,100–₹1,120 zone with an explosive 10x volume expansion.
The wide-range bullish candle and sustained higher close suggest institutional breakout participation and trend continuation toward upper resistance zones.
💼 HNI Trade Levels (STWP Setup):
Aggressive Entry: ₹1,114.50 | Stop Loss: ₹1,044.35
Low-Risk Entry: ₹1,076.5 | Stop Loss: ₹1,019.5
HNI and institutional activity is visible through heavy delivery-based volume and strong follow-up momentum.
The bullish structure remains intact as long as price sustains above ₹1,075–₹1,080, where short-term demand has been confirmed.
📉 VCP Analysis:
Intellect displays a multi-stage Volatility Contraction Pattern (VCP) — 8 visible contractions as per the VCP dashboard.
Each contraction narrowed with decreasing volume before the final 20-day breakout candle confirmed a volatility expansion phase.
This marks the beginning of a trend acceleration stage, aligning perfectly with RSI, MACD, and Supertrend confirmations.
📈 STWP Trading Analysis:
Entry: ₹1,114.50 | Stop Loss: ₹1,044.35
The breakout candle exhibits strong momentum with 5.42M volume vs an average of 0.52M, indicating institutional footprints.
The price is now sustaining above short- and medium-term EMAs, with all major timeframes (Daily–Weekly–Monthly) confirming an uptrend alignment.
Holding above ₹1,095–₹1,075 will maintain the bullish bias, keeping momentum setups active toward ₹1,175–₹1,255 zones.
📏 Fibonacci Analysis:
From swing low ₹890.25 to swing high ₹1,255.0:
61.8% @ ₹1,115.7 → Confirmed breakout level.
78.6% @ ₹1,176.9 → Next momentum target.
100% @ ₹1,255.0 → Swing resistance.
A daily close above ₹1,116 validates the Fibonacci continuation path toward ₹1,255–₹1,285, with an extended potential to ₹1,354 (Fibo 127.2% projection).
🧭 STWP Support & Resistance:
Resistances: ₹1,167.5 | ₹1,201.5 | ₹1,255.0
Supports: ₹1,076.5 | ₹1,019.5 | ₹985.5
The ₹1,076–₹1,020 zone acts as a key accumulation pocket, while the ₹1,255 area marks a significant swing barrier.
Structure indicates strong base support with progressive higher demand, suggesting buyers remain dominant on dips.
📊 STWP Volume & Technical Setup:
Today’s session recorded 5.42M shares vs 0.52M average, a 10x volume surge, confirming institutional breakout participation.
Indicators show bullish MACD crossover, RSI momentum above 70, and Stochastic strength across all timeframes.
The breakout is also validated by Bollinger Band expansion, signaling volatility release.
Trend Direction: UPTREND | Volume Confirmation: Strong Institutional Activity
🧩 STWP Summary View:
Final Outlook:
Momentum: Strong | Trend: Bullish | Risk: High | Volume: High
Intellect Design Arena has transitioned into a confirmed bullish continuation phase with institutional footprints and multi-indicator confirmation.
Holding above ₹1,075 keeps the pattern valid for a potential rally toward ₹1,175–₹1,255 levels.
The setup remains technically clean, high-volume backed, and trend-aligned — favoring bullish bias continuation in the near term.
⚠️ Disclosure & Disclaimer – Please Read Carefully
The information shared here is meant purely for learning and awareness. It is not a buy or sell recommendation and should not be construed as investment advice.
I am not a SEBI-registered investment adviser, and this analysis is based on chart observations, technical patterns, and public data.
Trading involves risk; market movements can be sudden, and losses may exceed invested capital.
Past performance or setups do not guarantee future results.
Please evaluate your risk management and suitability before taking any trading decision.
Consult a SEBI-registered financial adviser before acting on any trade idea.
Position Status: No active position in (INTELLECT) at the time of analysis.
Data Source: TradingView & NSE India (Past Chart Reference).
💬 Found this useful?
🔼 Give this post a Boost to help more traders discover structured learning.
✍️ Drop your thoughts, queries, or setups in the comments — let’s grow together!
🔁 Share this with fellow traders and learners to promote structured analysis.
👉 “If you liked this breakdown, follow for more clean, disciplined setups with patience at the core.”
🚀 Stay Calm. Stay Clean. Trade With Patience.
Trade Smart | Learn Zones | Be Self-Reliant 📊
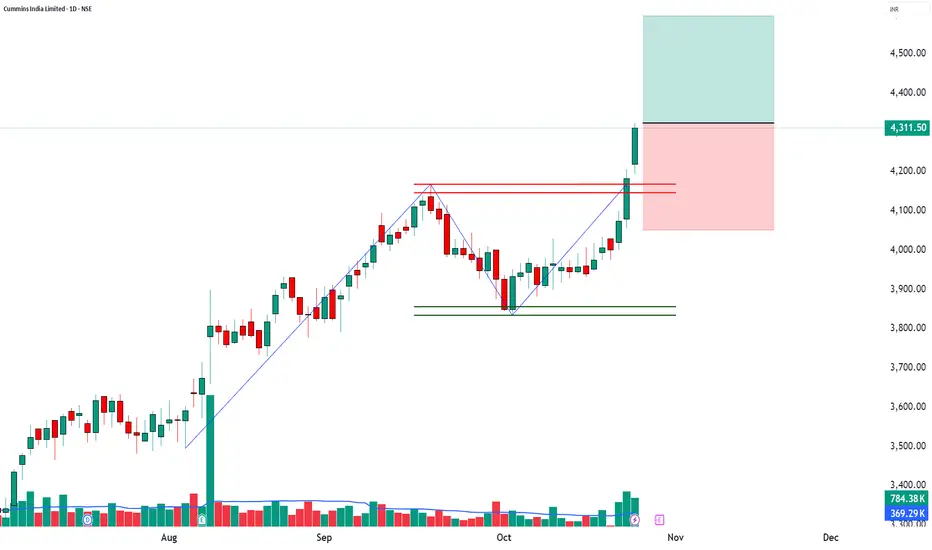
CUMMINSIND | 52-Week Breakout + Volume Expansion📈 CUMMINSIND | 52-Week Breakout + Volume Expansion + Institutional Momentum 🚀
🔹 Entry Zone: ₹4,311.50 – ₹4,324.00
🔹 Stop Loss: ₹4,051.05 (Risk ~273 pts)
🔹 Supports: 4,230 / 4,148.5 / 4,101.5
🔹 Resistances: 4,358.5 / 4,405.5 / 4,487
🔹 Swing Demand Zone: ₹4,096.70 – ₹4,060.10
🔹 Intraday Demand Zone: ₹4,086.20 – ₹4,065.00
🔑 Key Highlights
✅ 52-Week Breakout – strong bullish sentiment and trend expansion
✅ Exceptional Volume (2.12x avg) – clear institutional participation
✅ Bollinger Band Expansion – rising volatility supporting fresh rally
✅ Buy Today, Sell Tomorrow Setup – high momentum carryover expected
✅ VWAP Alignment – buyers maintaining upper hand
🎯 STWP Trade View
📊 Stock has shown powerful bullish momentum with record volume; however, post-breakout consolidation may occur near ₹4,358–₹4,405.
⚠️ The ₹4,086–₹4,065 intraday zone and ₹4,096–₹4,060 swing zone act as crucial support for momentum traders to plan re-entries.
💡 Learning Note
A 52-week breakout supported by heavy volume and VWAP strength signals potential institutional accumulation. Traders should trail profits gradually and watch for sustained volume to confirm continuation.
Final Outlook: Momentum: Moderate | Trend: Neutral | Risk: Low | Volume: High
________________________________________
________________________________________
⚠️ Disclosure & Disclaimer – Please Read Carefully
The information shared here is meant purely for learning and awareness. It is not a buy or sell recommendation and should not be taken as investment advice. I am not a SEBI-registered investment adviser, and all views expressed are based on personal study, chart patterns, and publicly available market data.
Trading—whether in stocks or options—carries risk. Markets can move unexpectedly, and losses can sometimes exceed the money you have invested. Past performance or past setups do not guarantee future results.
If you are a beginner, treat this as a guide to understand how the market works and practice on paper trades before risking real money. If you are experienced, always assess your own risk, position sizing, and strategy suitability before entering trades.
Consult a SEBI-registered financial adviser before making any real trading decision. By engaging with this content, you acknowledge full responsibility for your trades and investments.
Position Status: No active position in CUMMINSIND at the time of analysis.
Data Source: TradingView & NSE India (Past Chart Reference) (Historical levels)
💬 Found this useful?
🔼 Give this post a Boost to help more traders discover clean, structured learning.
✍️ Drop your thoughts, questions, or setups in the comments — let’s grow together!
🔁 Share with fellow traders and beginners to spread awareness.
👉 “If you liked this breakdown, follow for more clean, structured setups with discipline at the core.”
🚀 Stay Calm. Stay Clean. Trade With Patience.
Trade Smart | Learn Zones | Be Self-Reliant 📊
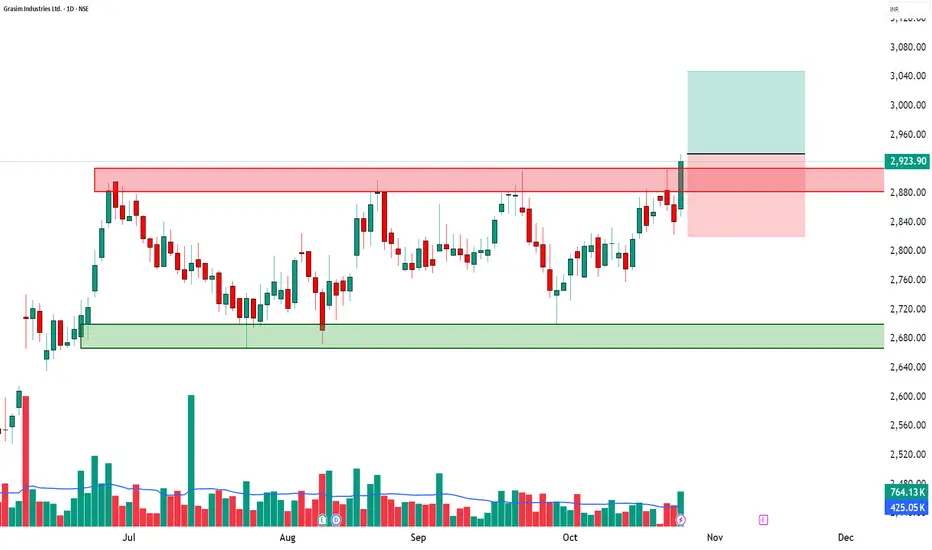
GRASIM | 52-Week Breakout + RSI Surge + High Volume📈 GRASIM | 52-Week Breakout + RSI Surge + High Volume Confirmation 🚀
🔹 Entry Zone: ₹2,923.90 – ₹2,934.00
🔹 Stop Loss: ₹2,820.45 (Risk ~113 pts)
🔹 Supports: 2,869.67 / 2,815.43 / 2,783.27
🔹 Resistances: 2,956.07 / 2,988.23 / 3,042.47
🔹 Swing Demand Zone: ₹2,787 – ₹2,764.50
🔑 Key Highlights
✅ 52-Week Breakout – strong confirmation of bullish momentum continuation
✅ RSI Breakout – trend acceleration backed by strength
✅ Bollinger Band Expansion – volatility breakout indicates fresh momentum
✅ VWAP Alignment – buyers maintaining control across sessions
✅ Volume Spike (1.8x avg) – institutional buying and strong follow-up interest
🎯 STWP Trade View
📊 Momentum favors continued bullish strength. Sustaining above ₹2,956 could extend the move toward ₹2,988–₹3,042 levels.
⚠️ The ₹2,787–₹2,764 zone acts as a key swing base where accumulation is likely to continue if prices retest.
💡 Learning Note
This setup demonstrates how a 52-week breakout with RSI and VWAP confirmation can mark a major trend continuation point. Volume expansion adds conviction, making such setups ideal for momentum-based swing trades.
Final Outlook: Momentum: Strong | Trend: Bullish | Risk: Low | Volume: High
________________________________________
________________________________________
⚠️ Disclosure & Disclaimer – Please Read Carefully
The information shared here is meant purely for learning and awareness. It is not a buy or sell recommendation and should not be taken as investment advice. I am not a SEBI-registered investment adviser, and all views expressed are based on personal study, chart patterns, and publicly available market data.
Trading—whether in stocks or options—carries risk. Markets can move unexpectedly, and losses can sometimes exceed the money you have invested. Past performance or past setups do not guarantee future results.
If you are a beginner, treat this as a guide to understand how the market works and practice on paper trades before risking real money. If you are experienced, always assess your own risk, position sizing, and strategy suitability before entering trades.
Consult a SEBI-registered financial adviser before making any real trading decision. By engaging with this content, you acknowledge full responsibility for your trades and investments.
Position Status: No active position in GRASIM at the time of analysis.
Data Source: TradingView & NSE India (Past Chart Reference) (Historical levels)
💬 Found this useful?
🔼 Give this post a Boost to help more traders discover clean, structured learning.
✍️ Drop your thoughts, questions, or setups in the comments — let’s grow together!
🔁 Share with fellow traders and beginners to spread awareness.
👉 “If you liked this breakdown, follow for more clean, structured setups with discipline at the core.”
🚀 Stay Calm. Stay Clean. Trade With Patience.
Trade Smart | Learn Zones | Be Self-Reliant 📊
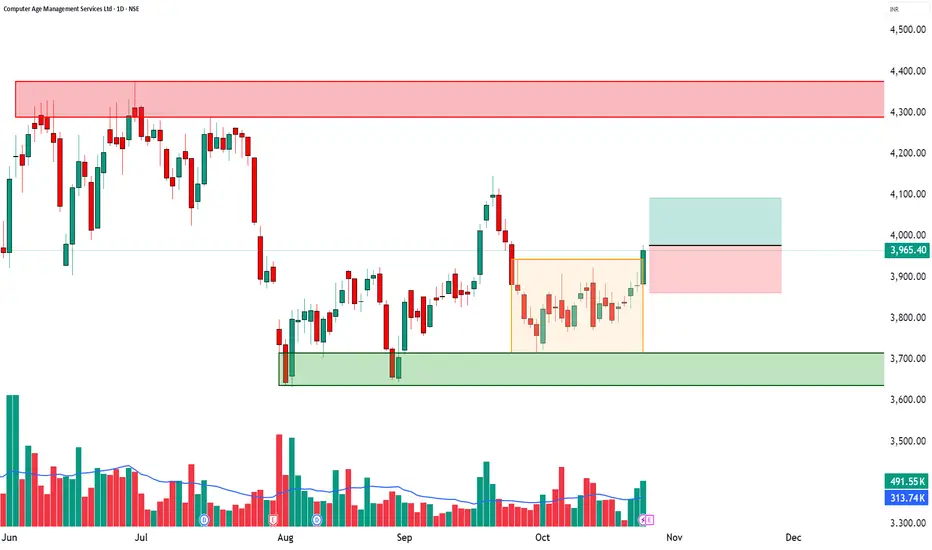
CAMS | Bullish Breakout + RSI Surge + High Volume📈 CAMS | Bullish Breakout + RSI Surge + High Volume Confirmation 🚀
🔹 Entry Zone: ₹3,965.40 – ₹3,977.80
🔹 Stop Loss: ₹3,862.45 (Risk ~115 pts)
🔹 Supports: 3,905.67 / 3,845.93 / 3,809.87
🔹 Resistances: 4,001.47 / 4,037.53 / 4,097.27
🔹 Swing Demand Zone: ₹3,815.50 – ₹3,789.90
🔹 Intraday Demand Zone: ₹3,885.70 – ₹3,877.00 | ₹3,875.90 – ₹3,868.10
🔑 Key Highlights
✅ Strong Bullish Candle – powerful continuation signal backed by strong volume
✅ RSI Breakout – confirms renewed buying momentum
✅ Bollinger Band Expansion – volatility breakout underway
✅ VWAP Alignment – sustained buyer dominance across sessions
✅ Volume Surge (1.57x avg) – active institutional participation
🎯 STWP Trade View
📊 Momentum favors a short-term bullish continuation. A close above ₹4,001 could extend the rally toward ₹4,037–₹4,097 zones.
⚠️ The ₹3,885–₹3,868 range offers intraday demand, while ₹3,815–₹3,789 serves as the swing demand base for positional traders.
💡 Learning Note
This setup combines RSI breakout + VWAP alignment + high volume — a potent trio for identifying momentum-backed bullish reversals. Traders can use intraday zones for tactical entries with clear stop placement.
Final Outlook: Momentum: Strong | Trend: Bullish | Risk: Low | Volume: High
________________________________________
________________________________________
⚠️ Disclosure & Disclaimer – Please Read Carefully
The information shared here is meant purely for learning and awareness. It is not a buy or sell recommendation and should not be taken as investment advice. I am not a SEBI-registered investment adviser, and all views expressed are based on personal study, chart patterns, and publicly available market data.
Trading—whether in stocks or options—carries risk. Markets can move unexpectedly, and losses can sometimes exceed the money you have invested. Past performance or past setups do not guarantee future results.
If you are a beginner, treat this as a guide to understand how the market works and practice on paper trades before risking real money. If you are experienced, always assess your own risk, position sizing, and strategy suitability before entering trades.
Consult a SEBI-registered financial adviser before making any real trading decision. By engaging with this content, you acknowledge full responsibility for your trades and investments.
Position Status: No active position in CAMS at the time of analysis.
Data Source: TradingView & NSE India (Past Chart Reference) (Historical levels)
💬 Found this useful?
🔼 Give this post a Boost to help more traders discover clean, structured learning.
✍️ Drop your thoughts, questions, or setups in the comments — let’s grow together!
🔁 Share with fellow traders and beginners to spread awareness.
👉 “If you liked this breakdown, follow for more clean, structured setups with discipline at the core.”
🚀 Stay Calm. Stay Clean. Trade With Patience.
Trade Smart | Learn Zones | Be Self-Reliant 📊
NUVAMA | Bullish Engulfing + VWAP Alignment📈 NUVAMA | Bullish Engulfing + VWAP Alignment + Strong Momentum Reversal 🚀
🔹 Entry Zone: ₹7,420.50 – ₹7,436.00
🔹 Stop Loss: ₹7,151.90 (Risk ~284 pts)
🔹 Supports: 7,244.33 / 7,068.17 / 6,972.33
🔹 Resistances: 7,516.33 / 7,612.17 / 7,788.33
🔹 Swing Demand Zone: ₹7,086 – ₹6,998.50
🔹 Intraday Demand Zone: ₹7,253.50 – ₹7,223
🔑 Key Highlights
✅ Bullish Engulfing Candle – powerful reversal confirmation
✅ VWAP Alignment – institutional bias turning bullish
✅ Momentum Strength – bullish follow-up after base formation
✅ Bollinger Squeeze-Off – volatility expansion expected
✅ Volume near average – healthy buyer participation, stable accumulation
🎯 STWP Trade View
📊 Strong bullish momentum supports a near-term rally toward ₹7,516–₹7,612. Sustaining above ₹7,612 could open upside potential to ₹7,788.
⚠️ The ₹7,253–₹7,223 zone provides intraday support, while ₹7,190–₹7,165 acts as a swing base for positional buyers to watch.
💡 Learning Note
This setup demonstrates how a Bullish Engulfing pattern with VWAP confirmation offers a reliable multi-signal entry. When aligned with tight demand zones, it allows traders to manage risk effectively while capitalizing on short-term breakouts.
Final Outlook: Momentum: Strong, Trend: Bullish, Risk: Low, Volume: High
________________________________________
________________________________________
⚠️ Disclosure & Disclaimer – Please Read Carefully
The information shared here is meant purely for learning and awareness. It is not a buy or sell recommendation and should not be taken as investment advice. I am not a SEBI-registered investment adviser, and all views expressed are based on personal study, chart patterns, and publicly available market data.
Trading—whether in stocks or options—carries risk. Markets can move unexpectedly, and losses can sometimes exceed the money you have invested. Past performance or past setups do not guarantee future results.
If you are a beginner, treat this as a guide to understand how the market works and practice on paper trades before risking real money. If you are experienced, always assess your own risk, position sizing, and strategy suitability before entering trades.
Consult a SEBI-registered financial adviser before making any real trading decision. By engaging with this content, you acknowledge full responsibility for your trades and investments.
Position Status: No active position in NUVAMA at the time of analysis.
Data Source: TradingView & NSE India (Past Chart Reference) (Historical levels)
💬 Found this useful?
🔼 Give this post a Boost to help more traders discover clean, structured learning.
✍️ Drop your thoughts, questions, or setups in the comments — let’s grow together!
🔁 Share with fellow traders and beginners to spread awareness.
👉 “If you liked this breakdown, follow for more clean, structured setups with discipline at the core.”
🚀 Stay Calm. Stay Clean. Trade With Patience.
Trade Smart | Learn Zones | Be Self-Reliant 📊

MCX | Strong Bullish Candle + VWAP Alignment + Swing Reversal Se📈 MCX | Strong Bullish Candle + VWAP Alignment + Swing Reversal Setup 🚀
🔹 Entry Zone: ₹9,305.50 – ₹9,335.00
🔹 Stop Loss: ₹8,962.50 (Risk ~343 pts)
🔹 Supports: 9,081 / 8,856.50 / 8,729.50
🔹 Resistances: 9,432.50 / 9,559.50 / 9,784.00
🔹 Swing Demand Zone: ₹7,880 – ₹7,725.50
🔹 Intraday Demand Zone: ₹9,052 – ₹8,975.50
🔑 Key Highlights
✅ Strong Bullish Candle signaling buyer dominance and swing reversal
✅ Bullish VWAP Alignment confirming upward control by buyers
✅ RSI improving from oversold region, supporting reversal momentum
✅ Bollinger Squeeze-Off indicating volatility expansion likely
✅ Volume near average levels – potential for fresh accumulation on breakout
🎯 STWP Trade View
📊 Momentum supports a bullish continuation if price sustains above ₹9,432. A breakout beyond ₹9,560 can extend the rally toward ₹9,784.
⚠️ The ₹9,052–₹8,975 zone offers intraday support, while ₹7,880–₹7,725 remains the long-term swing accumulation area for positional traders.
💡 Learning Note
This setup highlights how VWAP alignment with a strong bullish candle near demand zones acts as a multi-layer confirmation of trend reversal. Watching for volume pickup near resistances helps validate institutional buying strength.
Final Outlook: Momentum: Strong, Trend: Bullish, Risk: Low, Volume: High
________________________________________
________________________________________
⚠️ Disclosure & Disclaimer – Please Read Carefully
The information shared here is meant purely for learning and awareness. It is not a buy or sell recommendation and should not be taken as investment advice. I am not a SEBI-registered investment adviser, and all views expressed are based on personal study, chart patterns, and publicly available market data.
Trading—whether in stocks or options—carries risk. Markets can move unexpectedly, and losses can sometimes exceed the money you have invested. Past performance or past setups do not guarantee future results.
If you are a beginner, treat this as a guide to understand how the market works and practice on paper trades before risking real money. If you are experienced, always assess your own risk, position sizing, and strategy suitability before entering trades.
Consult a SEBI-registered financial adviser before making any real trading decision. By engaging with this content, you acknowledge full responsibility for your trades and investments.
Position Status: No active position in MCX at the time of analysis.
Data Source: TradingView & NSE India (Past Chart Reference) (Historical levels)
💬 Found this useful?
🔼 Give this post a Boost to help more traders discover clean, structured learning.
✍️ Drop your thoughts, questions, or setups in the comments — let’s grow together!
🔁 Share with fellow traders and beginners to spread awareness.
👉 “If you liked this breakdown, follow for more clean, structured setups with discipline at the core.”
🚀 Stay Calm. Stay Clean. Trade With Patience.
Trade Smart | Learn Zones | Be Self-Reliant 📊

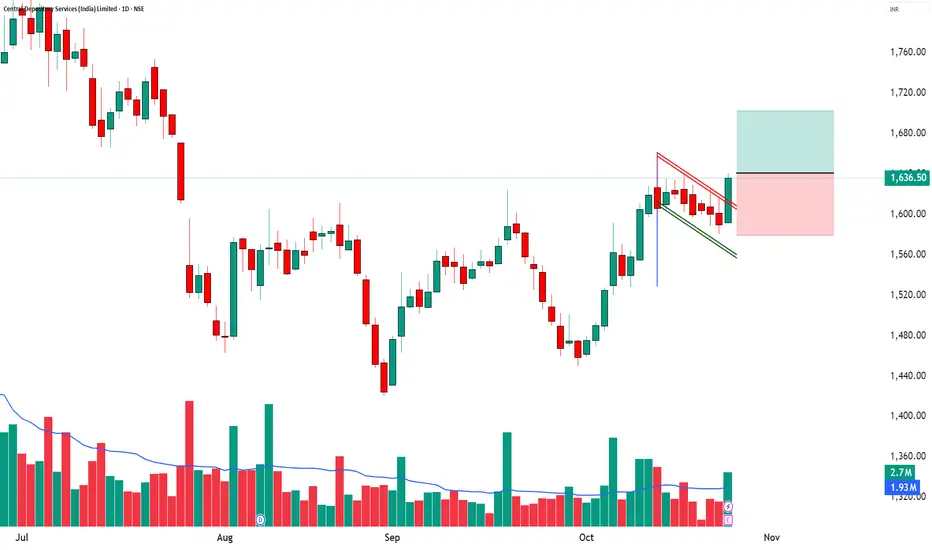
CDSL | Bullish Marubozu + RSI Breakout + Volume Expansion📈 CDSL | Bullish Marubozu + RSI Breakout + Volume Expansion 🚀
🔹 Entry Zone: ₹1,636.50 – ₹1,641.00
🔹 Stop Loss: ₹1,579.25 (Risk ~61 pts)
🔹 Supports: 1,605.33 / 1,574.17 / 1,556.33
🔹 Resistances: 1,654.33 / 1,672.17 / 1,703.33
🔹 Swing Demand Zone: ₹1,593.40 – ₹1,581.00
🔹 Intraday Demand Zone: ₹1,593.40 – ₹1,588.00
🔑 Key Highlights
✅ Bullish Marubozu Candle – clear sign of buyer dominance
✅ RSI Breakout – momentum strength confirmation
✅ Volume Surge (1.4x avg) – strong institutional participation
✅ Bollinger Squeeze-Off – breakout + volatility expansion expected
✅ VWAP Alignment – price sustaining above average buyer level
🎯 STWP Trade View
📊 Momentum supports a short-term bullish continuation. A decisive close above ₹1,654 may open the path toward ₹1,672–₹1,703.
⚠️ The ₹1,605–₹1,574 zone offers positional strength, while ₹1,593–₹1,588 acts as an intraday demand pocket for re-entry or dip-buying opportunities.
💡 Learning Note
This setup shows how combining price action (Marubozu) with RSI breakout and volume confirmation enhances conviction. Identifying multi-timeframe demand zones allows traders to plan entries with better precision and controlled risk.
Final Outlook: Momentum: Strong, Trend: Bullish, Risk: Low, Volume: High
________________________________________
________________________________________
⚠️ Disclosure & Disclaimer – Please Read Carefully
The information shared here is meant purely for learning and awareness. It is not a buy or sell recommendation and should not be taken as investment advice. I am not a SEBI-registered investment adviser, and all views expressed are based on personal study, chart patterns, and publicly available market data.
Trading—whether in stocks or options—carries risk. Markets can move unexpectedly, and losses can sometimes exceed the money you have invested. Past performance or past setups do not guarantee future results.
If you are a beginner, treat this as a guide to understand how the market works and practice on paper trades before risking real money. If you are experienced, always assess your own risk, position sizing, and strategy suitability before entering trades.
Consult a SEBI-registered financial adviser before making any real trading decision. By engaging with this content, you acknowledge full responsibility for your trades and investments.
Position Status: No active position in CDSL at the time of analysis.
Data Source: TradingView & NSE India (Past Chart Reference) (Historical levels)
💬 Found this useful?
🔼 Give this post a Boost to help more traders discover clean, structured learning.
✍️ Drop your thoughts, questions, or setups in the comments — let’s grow together!
🔁 Share with fellow traders and beginners to spread awareness.
👉 “If you liked this breakdown, follow for more clean, structured setups with discipline at the core.”
🚀 Stay Calm. Stay Clean. Trade With Patience.
Trade Smart | Learn Zones | Be Self-Reliant 📊
TITAN - Bullish Reversal & Long-Term Growth StoryTITAN | Bullish Reversal & Long-Term Growth Story
Stock: Titan Company Ltd (NSE: TITAN)
Timeframe: Daily Chart
Pattern: Bullish Reversal from Key Support(Bullish Engulfing)
🏷️ Stock Intro
Titan is India’s leading lifestyle & jewellery retailer with brands like Tanishq, CaratLane and Fastrack. Strong brand equity and robust consumer demand keep Titan a long-term structural growth story.
🔎 Price Action
Current Price: ₹3,401.20
After a sharp fall from the 3,740 zone, Titan bounced off the bottom range near ₹3,303 with a strong bullish candle & above-average volume (see chart).
Key Fibonacci levels: 23.6% at 3,406, 38.2% at 3,470, and 61.8% at 3,573.
🧮 Technical Analysis
Trend: Medium-term uptrend remains intact despite recent correction.
Volume: Spike to 1.45M signals aggressive buying near support.
Momentum: Bullish engulfing candle with open = low indicates strong intraday demand.
🎯 Key Levels
Support: 3,346 / 3,297 / 3,255
Resistance: 3,437 / 3,473 / 3,528
Top Range: 3,740 (major breakout level)
📊 Volume & Indicators
Bullish VWAP confirmation with BBSqueeze OFF → potential breakout if liquidity holds.
🆕 Latest Update & Growth Outlook
FY28 EPS projected ~₹75–76 (21% CAGR).
High ROE (~35%) and sustained jewellery demand keep Titan a premium growth play.
💹 STWP Educational Trade Illustration
This illustration is only for learning purposes and not a recommendation to trade or invest.
Chart Observation: Price action shows a recent bullish reversal near the ₹3,300 support zone with strong volume.
Illustrative Setup: A trader studying this pattern might observe a potential entry area around ₹3,418 with a protective stop near ₹3,300 to manage risk.
Potential Price Zones: Key resistance zones lie near ₹3,740 and ₹3,850, which could act as future reference levels if the bullish momentum continues.
Valuation Outlook: Based on projected FY28 EPS of about ₹75–76 and an illustrative P/E multiple of 70×, some analysts estimate a theoretical long-term fair value band of around ₹5,300–₹5,500, provided growth assumptions hold.
⚠️ Risk Reminder
Gold price volatility and discretionary slowdown can impact margins.
Premium valuation (~80× trailing P/E) requires consistent earnings growth.
🏁 Final Outlook
Titan shows a strong reversal setup backed by robust fundamentals and premium brand positioning. Ideal for positional swing traders and long-term investors seeking compounding stories.
💡 Learning Note:
This setup demonstrates how price action + Fibonacci levels + surge in volume can signal a high-conviction reversal trade when aligned with long-term growth fundamentals.
⚠️ Disclosure & Disclaimer – Please Read Carefully
The information shared here is meant purely for learning and awareness. It is not a buy or sell recommendation and should not be taken as investment advice. I am not a SEBI-registered investment adviser, and all views expressed are based on personal study, chart patterns, and publicly available market data.
Trading—whether in stocks or options—carries risk. Markets can move unexpectedly, and losses can sometimes exceed the money you have invested. Past performance or past setups do not guarantee future results.
If you are a beginner, treat this as a guide to understand how the market works and practice on paper trades before risking real money. If you are experienced, always assess your own risk, position sizing, and strategy suitability before entering trades.
Consult a SEBI-registered financial adviser before making any real trading decision. By engaging with this content, you acknowledge full responsibility for your trades and investments.
💬 Found this useful?
🔼 Give this post a Boost to help more traders discover clean, structured learning.
✍️ Drop your thoughts, questions, or setups in the comments — let’s grow together!
🔁 Share with fellow traders and beginners to spread awareness.
👉 “If you liked this breakdown, follow for more clean, structured setups with discipline at the core.”
🚀 Stay Calm. Stay Clean. Trade With Patience.
Trade Smart | Learn Zones | Be Self-Reliant 📊

AUBANK - Bullish Engulfing + EMA50 Breakout = Power Rally Setup________________________________________
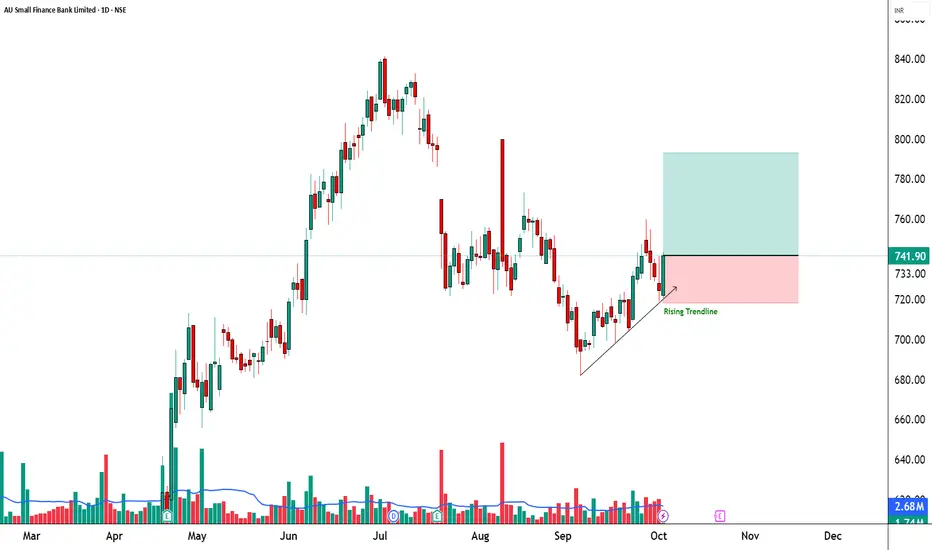
📈 AU Small Finance Bank | Bullish Engulfing + EMA50 Breakout 🚀
🔹 Entry Zone: ₹741.90 – ₹743.70
🔹 Stop Loss: ₹718.20 (Risk ~23 pts)
🔹 Supports: 727.17 / 712.43 / 704.17
🔹 Resistances: 750.17 / 758.43 / 773.17
________________________________________
🔑 Key Highlights
✅ Strong Bullish Candle – Engulfing pattern confirming reversal power
✅ EMA50 Breakout – trend shift signal
✅ Bullish VWAP Alignment – institutional buying confirmation
✅ Bollinger Squeeze-Off → breakout & volatility expansion expected
________________________________________
🎯 STWP Trade View
📊 Momentum indicates short-term bullish rally. A close above ₹750 may trigger an extended upside towards ₹758–773.
⚠️ Supports at ₹727 & ₹712 are important for trade protection.
________________________________________
💡 Learning Note
This setup demonstrates how a Bullish Engulfing pattern combined with EMA breakout + VWAP alignment can act as a multi-signal confirmation for a trend reversal.
________________________________________
⚠️ Disclosure & Disclaimer – Please Read Carefully
The information shared here is meant purely for learning and awareness. It is not a buy or sell recommendation and should not be taken as investment advice. I am not a SEBI-registered investment adviser, and all views expressed are based on personal study, chart patterns, and publicly available market data.
Trading—whether in stocks or options—carries risk. Markets can move unexpectedly, and losses can sometimes exceed the money you have invested. Past performance or past setups do not guarantee future results.
If you are a beginner, treat this as a guide to understand how the market works and practice on paper trades before risking real money. If you are experienced, always assess your own risk, position sizing, and strategy suitability before entering trades.
Consult a SEBI-registered financial adviser before making any real trading decision. By engaging with this content, you acknowledge full responsibility for your trades and investments.
💬 Found this useful?
🔼 Give this post a Boost to help more traders discover clean, structured learning.
✍️ Drop your thoughts, questions, or setups in the comments — let’s grow together!
🔁 Share with fellow traders and beginners to spread awareness.
👉 “If you liked this breakdown, follow for more clean, structured setups with discipline at the core.”
🚀 Stay Calm. Stay Clean. Trade With Patience.
Trade Smart | Learn Zones | Be Self-Reliant 📊