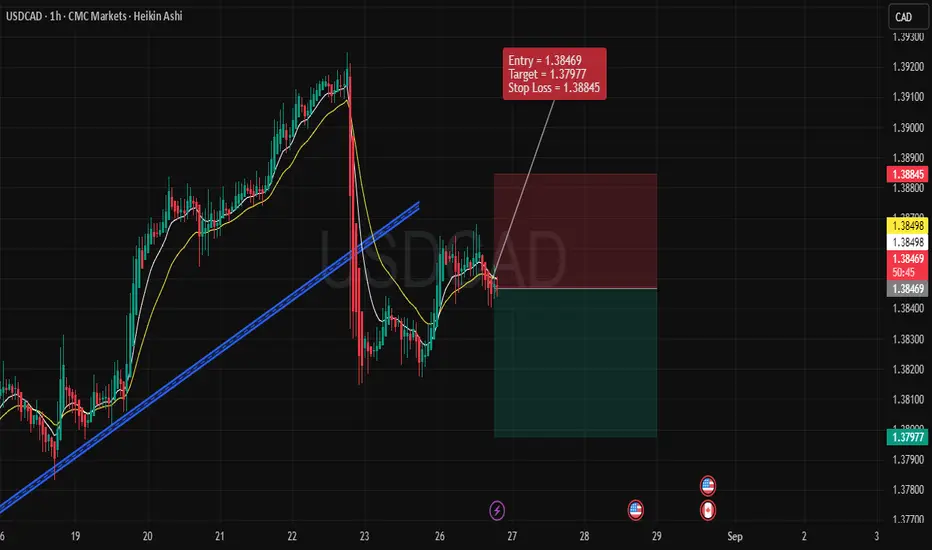
USDCAD – Bearish Trade Setup (1H Timeframe)Trade Details
Entry: 1.38469
Stop Loss: 1.38845
Target: 1.37977
🔹 Technical Reasons for Bearish Bias
Trendline Breakdown
Price recently broke below the rising trendline, indicating that the bullish momentum has weakened.
The failed retest of the broken trendline confirms bearish pressure.
Moving Averages Confirmation
The short-term moving averages (yellow lines) have crossed to the downside, aligning with bearish sentiment.
Price is trading below these moving averages, signaling sellers are in control.
Lower High Formation
After the sharp drop, the latest pullback failed to make a new higher high.
This indicates a shift from bullish structure to a bearish lower-high pattern.
Weak Recovery Attempt
The rebound after the drop is shallow and lacks strong bullish candles.
This suggests the market is unable to regain bullish momentum.
🔹 Risk Management
The Stop Loss is placed above the recent swing high (1.38845), protecting against sudden spikes.
The Target is set at 1.37977, aligning with recent support levels and offering a favorable risk-to-reward ratio.
🔹 Trade Outlook
This setup anticipates continuation of the bearish trend after the trendline break. Unless price reclaims and sustains above 1.3885, sellers remain favored in the short term. A successful breakdown could open the way for deeper downside in USDCAD.
✅ Summary:
Bearish structure confirmed by trendline break, bearish moving average alignment, and weak recovery → Entered short at 1.38469, targeting 1.37977 with stop at 1.38845.
Strongsell
BNB/USDT – Short Setup (1H Chart)BNB is showing weakness after repeated rejections and a break below short-term moving averages. Price action indicates selling pressure, and the recent structure suggests continuation to the downside.
🔹 Entry: 841.825
🔹 Target: 784.770
🔹 Stop Loss: 870.281
The risk-to-reward ratio looks favorable, with sellers gaining momentum as long as price remains below resistance. A breakdown from the current consolidation zone may accelerate bearish momentum toward the target zone.
⚠️ This is a short-term bearish trade idea based on technicals. Always manage risk and adjust positions as per market conditions.

Hindustan Aeronautics Limited (HAL)All major points are marked in Chart.
Strong stock for accumulating in the Support. Get good return in long term.
*Do own research before investing in Equity markets.

Bullish Flag & Pole B/o in UTIAMCGood Morning Friends,
A bullish flag and pole pattern emerged on the hourly chart of NSE:UTIAMC the bullish view will be negated if the stock closed below 756 on DCB. So as per the current probablity one take the trade at 786 or below with stoploss of 756 on DCB basis for the 1st target of 816 then 2nd target of 846 and the final target of 876.
Exit the position if the stop loss triggered on daily closing basis.
The risk reward ratio for the trade is 1:3
DO YOU WANT ALL MY RESEARCH FOR FREE THEN DON'T FORGET TO FOLLOW ME.
i AM EAGERLY WAITING FOR YOU COMMENTS ON THE STUDY...
Disclaimer: Content shared is for information and education purposes only and should not be treated as investment or trading advice. Please do your own analysis or take independent professional financial advice before making any investments based on your own personal circumstances. Investment in securities are subject to market risks, please carry out your due diligence before investing. And last but not the least, past performance is not indicative of future returns.

RUNE/USDT time to short?RUNE/USDT has formed bearish flag pattern + It also broke support of (≈)3.274.
BTC also looks bearish now, so it might be time to short RUNE/USDT after it successfully breaks support with conformations(Bearish candlestick patterns).
BTC has broken its support and formed bearish engulfing candlestick pattern in daily chart(still the candle hasn't closed, so wait for it to close in 9 hours and 19 minutes), so it might break its support of (approx)29700.
RUNE/USDT short entry-------->
Entry price - current price (around 3.180) or upon retest (if it retests) (around 3 or 3.2)
Stop loss - 3.4
Target price - 1.521, 1.300, 1.000
price might consolidate(or retest or take pullback) before crashing
(Don't open any position on wick)
(Don't take trades based on this idea, even I don't trade according to my idea)
(Do your own analysis)
(NOT A financial advice)
(High chances of loss if you follow my idea)

Strong Bearish USDCADBears are trying their best to pull market back to the correction, as we had seen a great jump in the asset in past few days;
Now it's the time to bring back the market for correction.
1.2100 is the expected target but the traders can do the partial booking before also and use a trailing stoploss if possible or trail it manually.

Dow Jones DJI Strong SellJow Jones Breakdown trend line, hope fall continue till 31000 to 31600 levels....💥

NIFTY 50 TO SEE SELLING IN THE COMING DAYS!!!!!!!Selling in Nifty & Bank Nifty The Two Major Indices are expected to have a substantial bearish breakdown as the RSI indicator shows Index making lower Highs, However the Price making Higher highs indicating bearish divergence. NIFTY 50 is expected to move lower once it breaks the trendlines. WE EXPECT THE BEARS TO GET STRONGER ONCE THE INDEX MOVES BELOW 11,550.

what if bank nifty closes below 24900 ,24 850 ????..i feel that bank nifty must remain range bound and should stay between 24800 to 25100
the moment it closes below 24800 a sharp fall can be seen immediately !!!!!!!!!!!!
