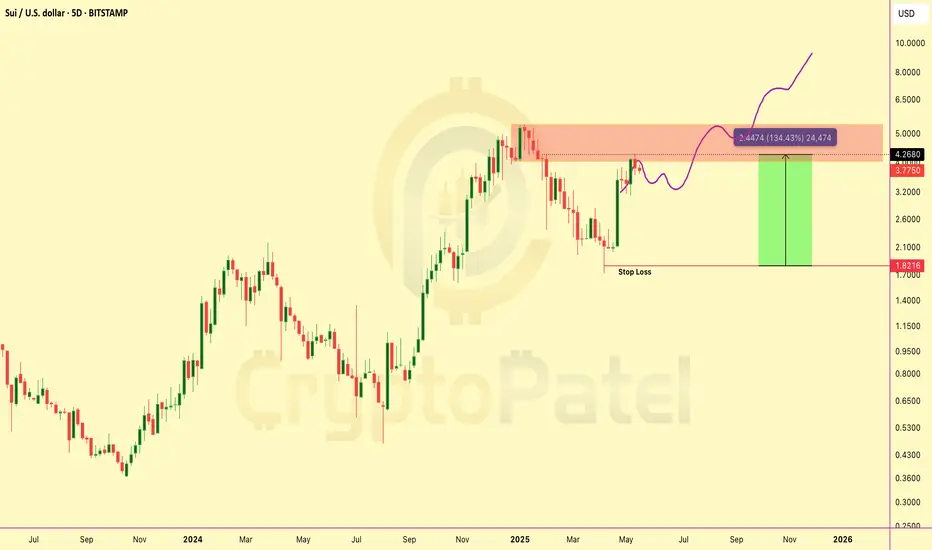
$SUI PRICE FORECAST | IS $20 POSSIBLE? CRYPTOCAP:SUI PRICE FORECAST | IS $20 POSSIBLE? | ANALYSIS BY CRYPTOPATEL
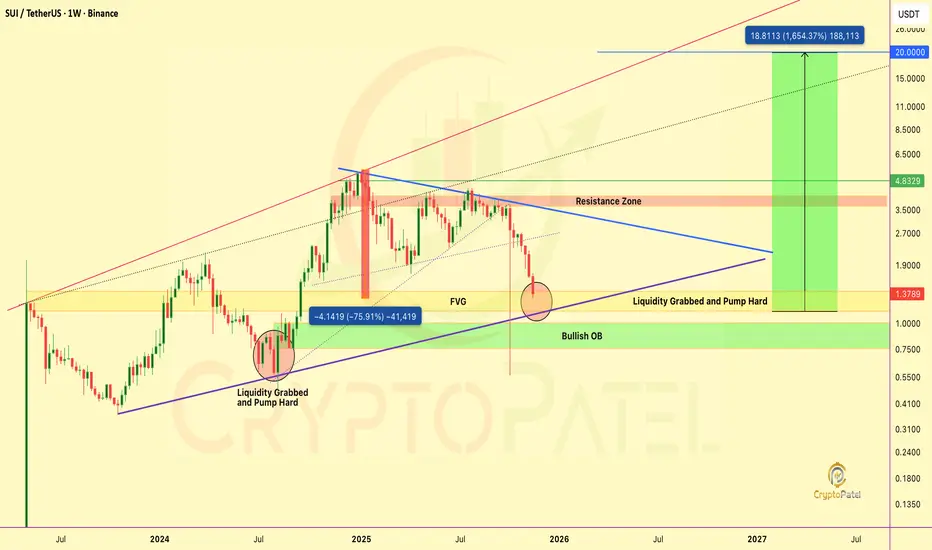
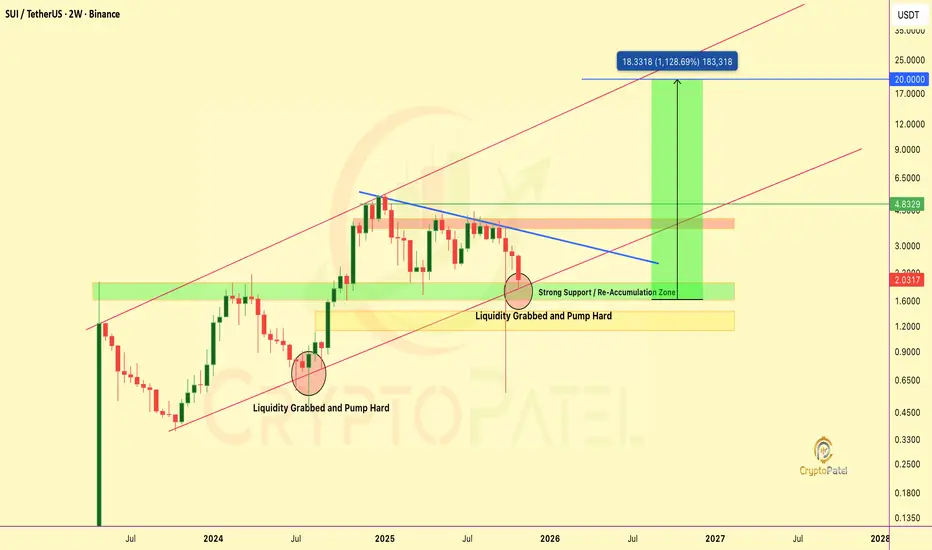
CRYPTOCAP:SUI Is Showing A Clear High-Timeframe Smart Money Re-Accumulation Structure On The Weekly Chart After A Deep Correction From 2024 Highs.
Market Structure Overview
After A ~76% Drawdown, Price Swept Liquidity At The Lows And Printed A Strong Reversal, Signaling Demand Absorption And Institutional Interest.
Technical Confluence
Weekly Bullish Order Block: $1.50 – $1.30
OB Aligned With Fair Value Gap (Strong Demand Zone)
~45% Impulse Move Already Delivered From This Area
Price Structure Respects A Rising Channel
HTF Bias Turning Bullish
👉 Best Entry Zone ($1.50 – $1.30) Was Shared Earlier, Cleanly Filled, And Has Already Given ~45% Profit On A Short-Term Swing.
Targets (HTF Expansion)
TP1: $4.8 (Previous Weekly Resistance)
TP2: $18 – $20 (HTF Expansion + Psychological Zone)
⚠️ Invalidation
Weekly Close Below $1.20 Breaks The Bullish Structure
Final Thoughts
This Is A Patience-Based Weekly Setup, Not A Short-Term Trade. As Long As Price Holds Above The Bullish OB, Upside Expansion Remains The Higher Probability Scenario.
Disclaimer: TA Only. Not Financial Advice. Markets Are Probabilistic. Always Do Your Own Research.
SUI

ETHEREUM ANALYSIS UPDATE:ETHEREUM ANALYSIS UPDATE:
Exactly as projected, CRYPTOCAP:ETH bounced perfectly from the 0.5 FIB retracement at $2,622.
That level has now transformed into a strong structural support, increasing the probability of an upside continuation and a potential run toward a new All-Time High.
But remember 👇
If Ethereum breaks below $2,622 (0.5 FIB), the market will likely hunt liquidity into the 0.618 Golden Zone or the Bullish Order Block before launching toward the $10K macro target.
Big dips = Big accumulation discounts. Stay strategic, not emotional.
1️⃣ $2,622 (0.5) – First Defense ✅
2️⃣ $2,256 (0.618) – Golden Zone
3️⃣ $1,821 (0.786) – Nuclear Support
NFA & DYOR

$SUI JUST ENTERED ITS DO-OR-DIE ZONE CRYPTOCAP:SUI JUST ENTERED ITS DO-OR-DIE ZONE AND THE WEEKLY CHART IS SCREAMING A REVERSAL SETUP
Everyone is panicking at the dump…
But nobody is seeing what actually happened on the HTF:
🔹 Massive Liquidity Grab Completed — identical to the 2024 bottom pattern.
🔹 Price nuked directly into FVG + Bullish Order Block.
🔹 Strong rejection wick = smart money accumulation confirmed.
🔹 Macro trendline STILL intact. Structure STILL bullish.
But let’s be Honest:
👉 Market condition is extremely worst right now.
👉 All altcoins dumped hard.
👉 CRYPTOCAP:SUI is –75% down from its Jan 2025 ATH… 10 months of pure bleeding.
Still, the chart is loading something big.
Here’s my IMO approach:
🔹 Accumulation Zone 1: $1.35 – $1.15
🔹 Accumulation Zone 2: $0.90 – $0.75
⭐ Don’t try to buy once.
⭐ No one knows the exact dip.
⭐ Smart way = accumulate slowly inside these zones.
Strong bounce potential sits exactly from the FVG → Bullish OB confluence.
If SUI breaks $4.8 resistance?
Targets: $5 → $10 → $20
IMO one day CRYPTOCAP:SUI will hit $20 easily.
But of course, Not financial advice. DYOR before investing.
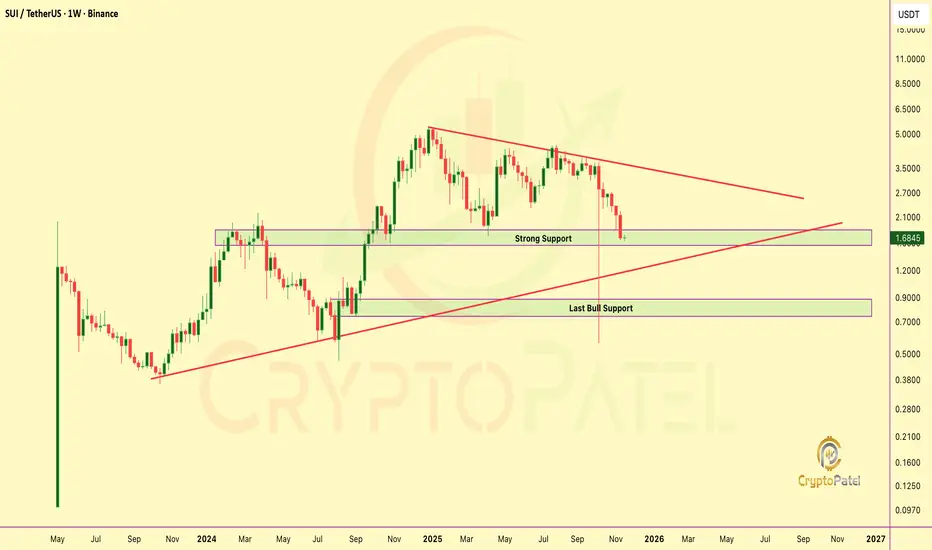
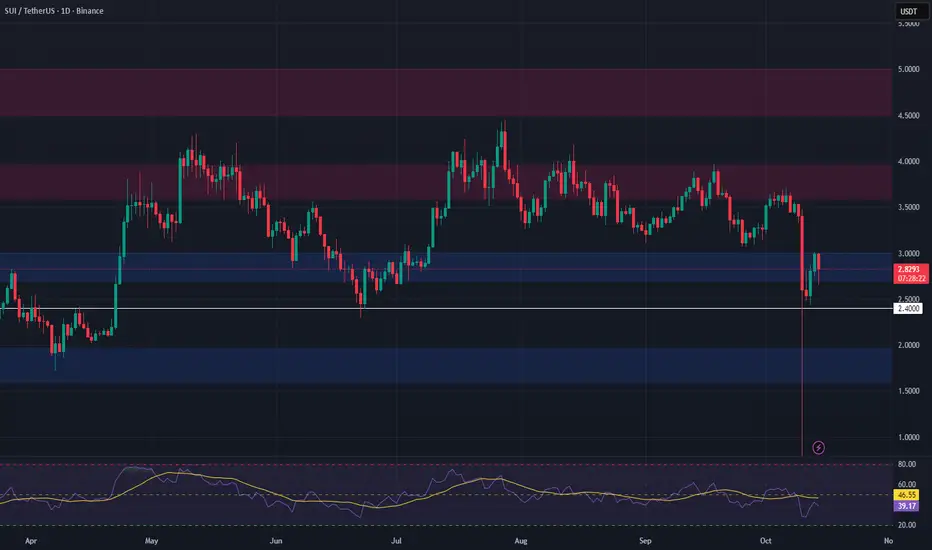
$SUI $1.66: The Liquidation Event That Just Printed the Next CycCRYPTOCAP:SUI Sharp ~70% Drawdown to the $1.66 zone has triggered broad Capitulation, with sentiment flipping decisively risk-off.
This is market structure: forced liquidity, weak-hand exits, and a reset in positioning after an overextended leg.
But historically, deep corrective sweeps often mark the final stage before trend re-acceleration. The $1.70–$1.00 range is emerging as a high-conviction accumulation pocket for investors with longer time horizons.
Should liquidity rotate back into high-beta assets later this cycle, a re-pricing toward the $10 region stays firmly on the Table.
In Crypto, Volatility Punishes Impatience and Rewards Discipline.
NFA & DYOR
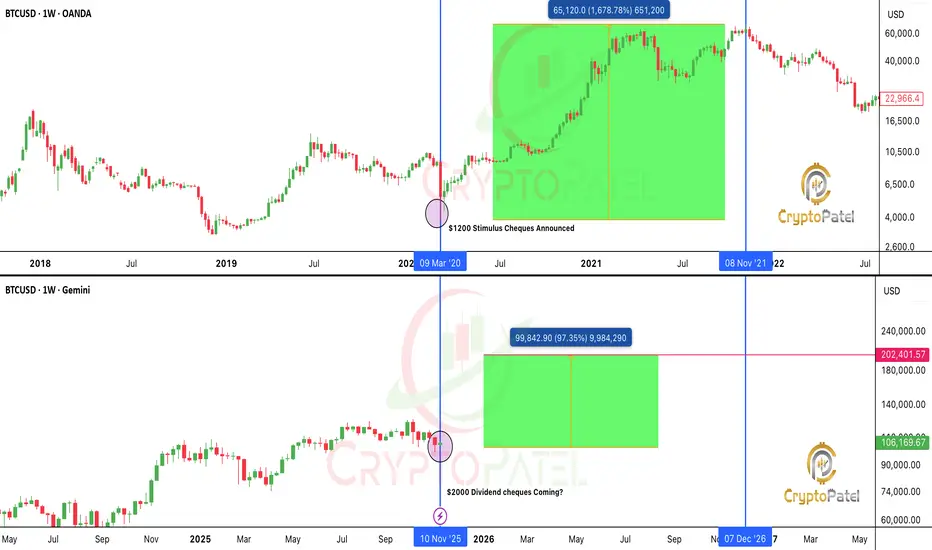
Trump’s $2,000 stimulus = $600B Liquidity: Bitcoin To the Moon?Trump’s $2,000 Stimulus Could Light the Fuse for the Biggest Crypto Rally Ever
This isn’t just another political headline.
If Trump’s plan to send $2,000 stimulus checks funded by tariff dividends actually happens, it could unleash a $600 billion liquidity wave into the economy.
That’s nearly the same scale as the 2020 stimulus, which kicked off one of the most legendary bull runs in history.
🔹 Bitcoin skyrocketed from $3,800 to $69,000
🔹 Ethereum exploded from $90 to $4,800
🔹 Altcoins went absolutely wild, 50x, 100x, even more
But here’s the twist...
This time, the setup is 10x stronger.
In 2020, those checks were about survival, paying rent, buying food, covering bills.
Crypto was new. ETFs didn’t exist. Institutions were on the sidelines.
Now? The game has completely changed.
✅ Crypto is mainstream
✅ Bitcoin ETFs are live
✅ Institutions are ready to buy
✅ Retail access is everywhere
✅ The U.S. economy is growing, not crashing
In 2020, people used stimulus to survive.
In 2025, they’ll use it to invest.
When money flows into a market that’s already primed for risk...
That’s not just bullish, that’s explosive.
The 2020 checks fueled a survival rally.
The 2025 checks could ignite a speculation supercycle.
Imagine $600 billion pouring into a global asset class that’s waiting for liquidity.
Bitcoin. Ethereum. Solana. AI coins. RWA tokens. Meme coins.
History doesn’t repeat but it sure does rhyme.
And this rhyme could make millionaires all over again.
NFA & DYOR
SUI– Breakout Setup Forming, Bulls Eyeing a Move Toward $20SUI/USDT – Breakout Setup Forming, Bulls Eyeing a Move Toward $20
SUI is building a strong re-accumulation base after months of correction. The $1.6–$2 demand zone continues to attract heavy buying interest, the same zone that triggered the last major rally.
Technical Highlights:
✅ Multiple liquidity grabs with strong rebounds
✅ $1.6–$2 zone acting as key accumulation area
✅ Descending trendline compression nearing breakout
✅ Structure remains bullish above $1.6
A confirmed breakout above the descending trendline could launch SUI into a high-momentum phase, targeting higher resistances.
Upside Levels: $4.8 / $10 / $20 – Macro channel target
Accumulation View:
Smart money is active below $2, positioning early before expansion. As long as $1.6 holds, the structure favors a bullish continuation.
High compression. Low noise. When this trendline breaks, volatility will speak loud. NFA & DYOR
Will SUI/USDT hit $20 in current bull market or future?SUI Testing Final Demand Zone: Reversal Imminent?
SUI is currently testing a major re-accumulation zone around $2.1 – $1.8, which previously acted as a strong demand area.
A liquidity grab below this level could trigger a sharp reversal, similar to the last time price swept lows before a massive rally.
The structure remains valid as long as this zone holds.
Once price reclaims the $2.7–$3.0 resistance, momentum could shift strongly bullish, targeting the $4.8 zone, and eventually the $20 macro target if the trend continues.
Support: $2.1 – $1.8
Resistance: $2.7 / $4.8
Macro Target: $20
Of course, NFA & Always DYOR

Will Bitcoin Ready to Next leg down toward $76000?CRYPTOCAP:BTC has completed a bearish retest at the $116K resistance zone, maintaining a bearish bias below $116K–$117K
If price continues to reject this level, I’m anticipating a corrective move toward: $105K → $93K → $76K
However, a confirmed breakout above $117K would invalidate the bearish structure and could trigger an extended rally toward $150K+.
Resistance: $116K–$117K
Support: $105K / $93K / $76K
Bias: Bearish below $116K | Bullish above $117K
Stay disciplined — structure > sentiment.
NFA & DYOR

SUI – Swing Trade Setup from Key Support ZoneSUI is currently trading in a major support zone between $2.70 and $3.00, a level that has previously acted as a strong demand area. The price is consolidating here, and this could offer a high-probability long opportunity for swing traders watching for a potential bounce.
📈 Entry Zone: $2.70 – $3.00
🎯 Take Profit Targets:
• TP1: $3.60 – $3.95
• TP2: $4.50 – $5.45
🛑 Stop Loss: $2.40
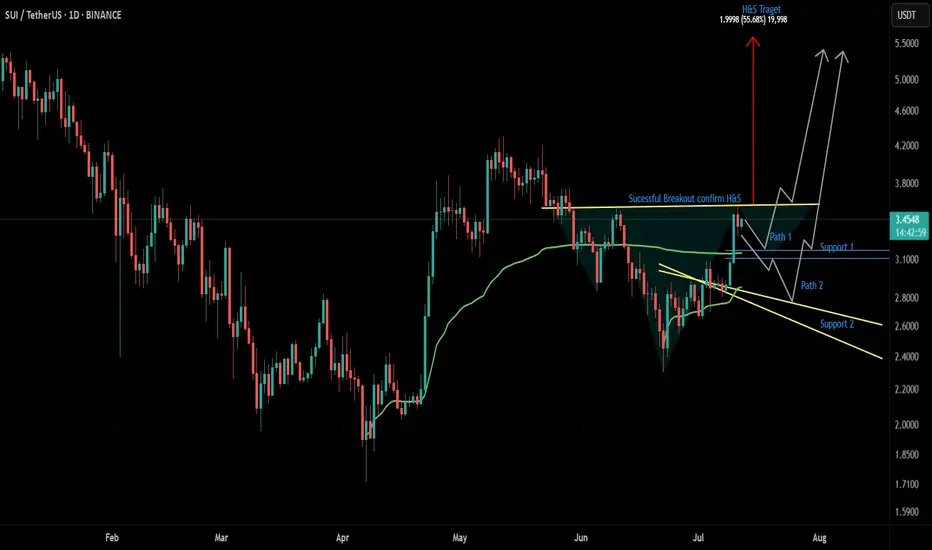
$SUI Inverse H&S FormingA large inverse Head & Shoulders pattern appears to be forming on $SUI. The $3.1758 zone looks like a solid area to long — potentially marking the bottom of the second shoulder. If a deeper correction occurs, I'm also watching the $2.7473 level for another possible long entry.
My plan is to pre-position by longing near the second shoulder. Once $3.5902 breaks and we get a successful retest, the pattern would be confirmed. From there, a 50% move up toward the neckline target of $5.6252 could follow.
This is not financial advice. Trade at your own risk.
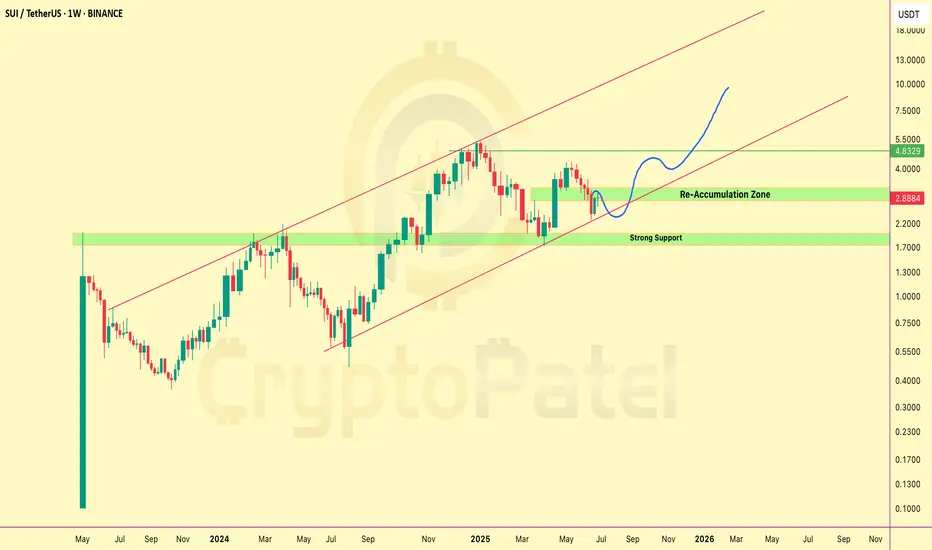
SUI to $10, $20.. Even $50? The Setup Looks Insane-Weekly ChartSUI is trading around $2.89, currently sitting in a key re-accumulation zone after a correction.
Trend: Still holding inside a long-term uptrend channel — structure remains bullish.
Support Zones:
🔹 $2.00–$2.50 is a strong demand area
🔹 $1.70 is a critical support — bullish above this,
but if price breaks below, we may enter major bearish mode
What to watch: If SUI holds this zone and continues upward:
🔹 Short-term target: $5/$10
🔹 Long-term potential: $20 → $50
I’m watching the $2.50 zone closely for possible long entries.
This could be a solid long-term opportunity if support holds.
NFA. DYOR.
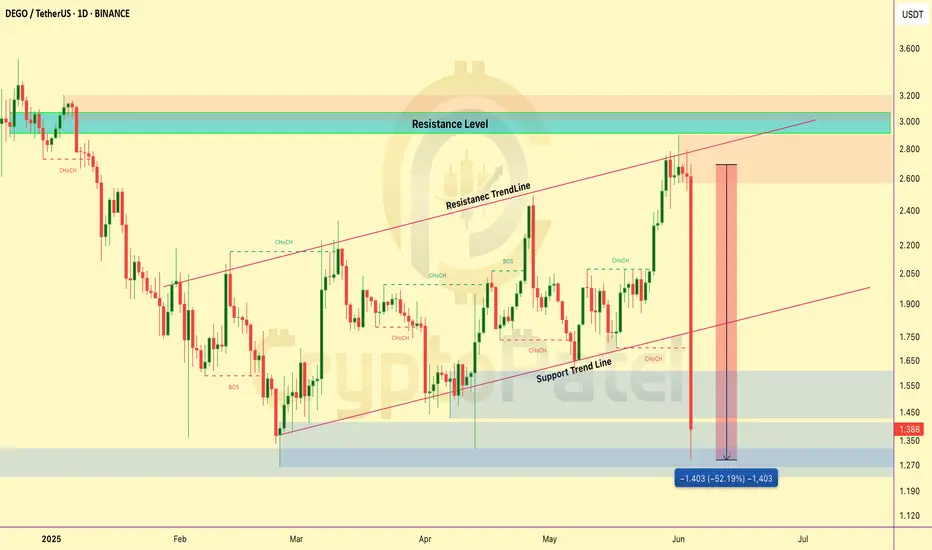
DEGO Price Dumped Hard – What Happened?🚨 DEGO Price Dumped Hard – What Happened?
Dego Finance ($DEGO) dropped over 40% today and here’s why:
🔻 Big Token Dump:
A huge amount of DEGO tokens (worth over $250K) was sent to exchanges — this caused heavy selling pressure.
💥 Record Liquidations:
Over $650K in long positions got liquidated — highest ever for DEGO!
⚠️ USD1 Stablecoin FUD:
DEGO recently said they bought the new USD1 stablecoin. Some users think this might be a risky or scammy move, adding more fear.
📉 Technical Rejection:
Price hit $2.70, then faced strong resistance and dropped fast. Bearish market conditions made it worse.
Stay alert! This is a high-risk zone — wait for stable support if you’re planning to enter.
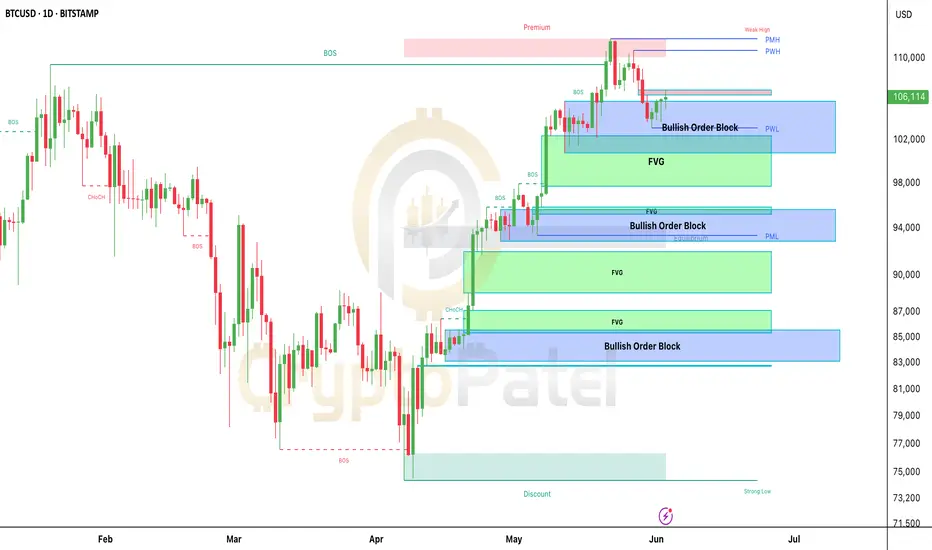
Bitcoin's Next Move: $110K Breakout or $94K Dip? SMC Decides#Bitcoin Daily Chart Analysis – Smart Money Update
As of today, BTC is trading around $105,800 and is showing signs of consolidation after reaching a key resistance zone near $110K.
Let’s break down what’s happening on the chart 👇
Current Market Structure
▶️ BTC has been in a clear uptrend, with multiple Breaks of Structure (BOS) confirming bullish momentum throughout April and May.
▶️ However, price recently entered a premium zone (above $110K), where it faced strong resistance.
▶️ This created a weak high, and we saw a Change of Character (CHoCH) that suggests buyers are slowing down.
Key Levels to Watch
$102K–$106K Zone (Current Area)
▶️ Price is sitting inside a Bullish Order Block + Fair Value Gap (FVG).
▶️ This is a strong support zone.
▶️ If this area holds, we could see a move back up toward $110K or even higher.
$93K–$96K Zone
▶️ Another clean Bullish OB + FVG combo.
▶️ If BTC breaks down from the current zone, this is the next major area where Smart Money might step in to buy.
$83K–$87K Zone
▶️ Deep discount zone, far below equilibrium.
▶️ If price reaches here, it’s a high-probability reversal area.
What Smart Money Might Do
▶️ If BTC holds above $102K–$105K, bulls could regain control and retest the highs near $110K.
▶️ If we break below this zone, expect a pullback toward $94K–$95K or even $87K, where more demand is waiting.
Fair Value Gaps (FVGs)
▶️ Several FVGs are visible, especially between $98K–$103K and $93K–$96K.
▶️ These gaps are areas of imbalance where price is likely to return and fill before the next move.
Summary
▶️ BTC is currently in a decision zone.
▶️ Holding above $102K = bullish continuation likely.
▶️ Breakdown = retracement into deeper bullish zones.
⚠️ As always, wait for confirmation on lower timeframes before entering any trade. Let the market show its hand.
Stay patient. Smart Money doesn’t chase—It waits.
NFA & DYOR
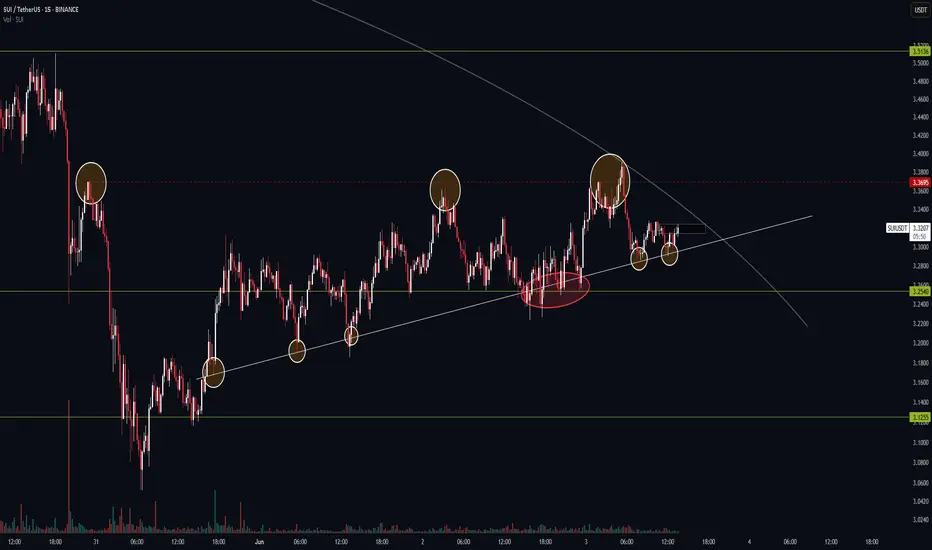
Trendline vs. Resistance — SUI’s Battle on the 15-Minute ChartBINANCE:SUIUSDT
📊 Cycle Structure:
HWC (Higher Wave Cycle): Bullish 🔼
MWC (Middle Wave Cycle): Bearish 🔽
LWC (Lower Wave Cycle): Bullish 🔼
📌 This mixed structure creates a conflicting environment — higher timeframe trend is bullish, but MWC acts as a drag, preventing smooth upward momentum.
📉 Market Structure:
Currently, price is consolidating with a slight bullish tilt. BTC itself is in a very uncertain state, but its cycles are still bullish — meaning SUI might act unpredictably.
We’re looking at two main setups here:
Long Entry: On clean breakout of key resistance.
Short Entry: On breakdown of the descending trendline.
🔸 The 15M descending trendline has already seen 6 touches.
✅ A breakdown could trigger a short setup — but since it's on a low timeframe, don’t expect a massive dump.
🎯 First TP zone for shorts: the 32540 support — a solid zone for partial profit-taking.
🟢 My Personal Preference — Long Bias:
I'm leaning toward the long side for a few reasons:
HWC and LWC are both bullish.
BTC.D just rejected hard from its channel top — signaling altcoins like SUI may perform better.
🔹 32695 has seen 3 touches already, with the third one being a fakeout.
✅ If we see weak selling pressure and strong volume on the next touch, it can be a valid long trigger.
🎯 Potential upside target: the 35135 resistance zone — where a decent reaction is expected.
📌 Want a specific coin or pair analyzed? Drop it in the comments — I’ll pick a few and break them down.
⚠️ Without proper risk management, you're just a ticking time bomb.
— PXA | Structure-Based Precision Trading
$SUI Looks Super Bullish, But There’s a Catch!CRYPTOCAP:SUI Looks Super Bullish, But There’s a Catch!
SUI Network is heating up in this bull market, and yes — it could potentially reach $10… even $15–$20 long-term! 🔥
But here’s something you need to know 👇
🔓 Today, 44M CRYPTOCAP:SUI (~$143M) tokens got unlocked — that’s 1.32% of the circulating supply.
▶️ Only 33.87% of total supply is unlocked — meaning 66.13% is still locked with early investors and the team.
▶️ That’s ~$140M worth of tokens unlocking every month. This could put serious sell pressure on the price!
✅ I'm still bullish long-term, already holding from $0.50–$0.60.
▶️ If CRYPTOCAP:SUI drops to around $2.80, I’ll be buying more.
Short-term dip = Long-term opportunity?
Be smart. Track unlocks. Buy low. Think long.
NFA & DYOR

$SUI 130% up from our Entry and What Next?CRYPTOCAP:SUI pumped 130% from our entry around $2 — now hitting $4.29! Bottom perfectly caught.
Expecting a healthy pullback to ~$3 before next leg higher — that zone is ideal for fresh entries.
Long-term targets: $5/$10/$15/$20
#SUI #Altcoins
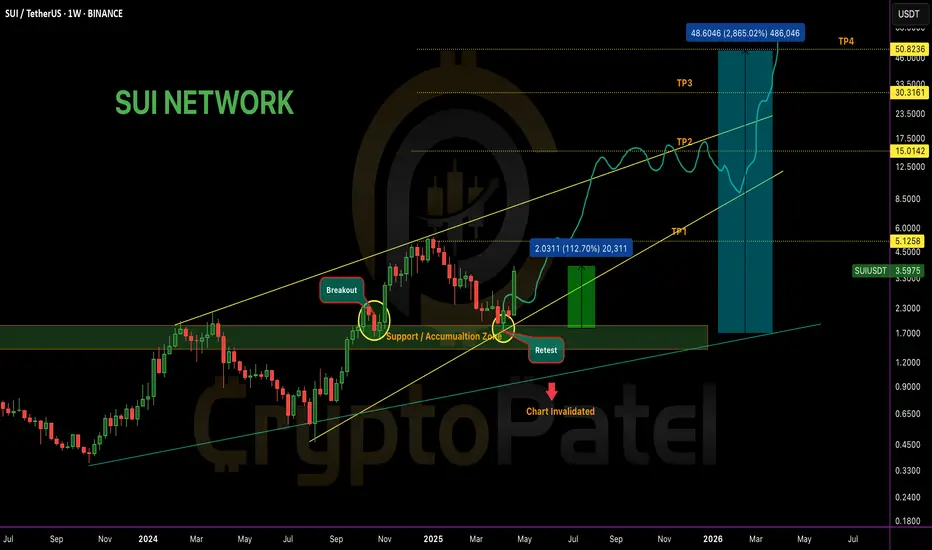
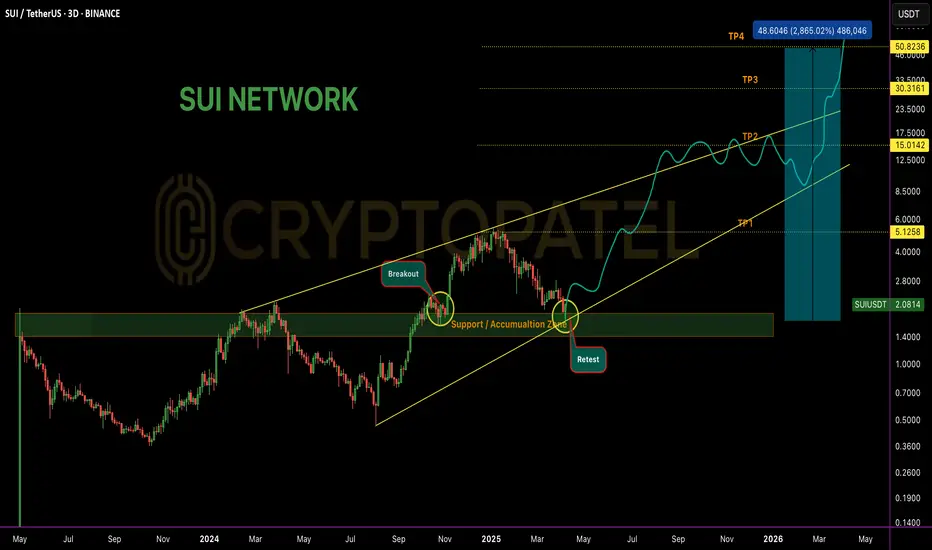
Will SUI hit $50 in Comming Years?SUI NETWORK MEGA BREAKOUT ALERT! 🚀
🟢 Chart Analysis Update:
• Breakout confirmed from the long-term accumulation zone.
• Retest successful — price bounced perfectly from the previous support zone.
• Current price: $3.59 (up +112% From our recent bottom price Entry)
• Next major targets:
🎯 TP1: $5.12
🎯 TP2: $15.01
🎯 TP3: $30.31
🎯 TP4: $50.82
Potential upside: 2,865%+ if the full move plays out!
🔔 Key Points:
Strong support holding at $2.00 zone.
Chart remains valid as long as price stays above accumulation zone.
Invalidation only if SUI breaks below $1.80 zone.
If momentum continues, SUI could enter a parabolic run in the coming months. Eyes on this rocket! 🚀
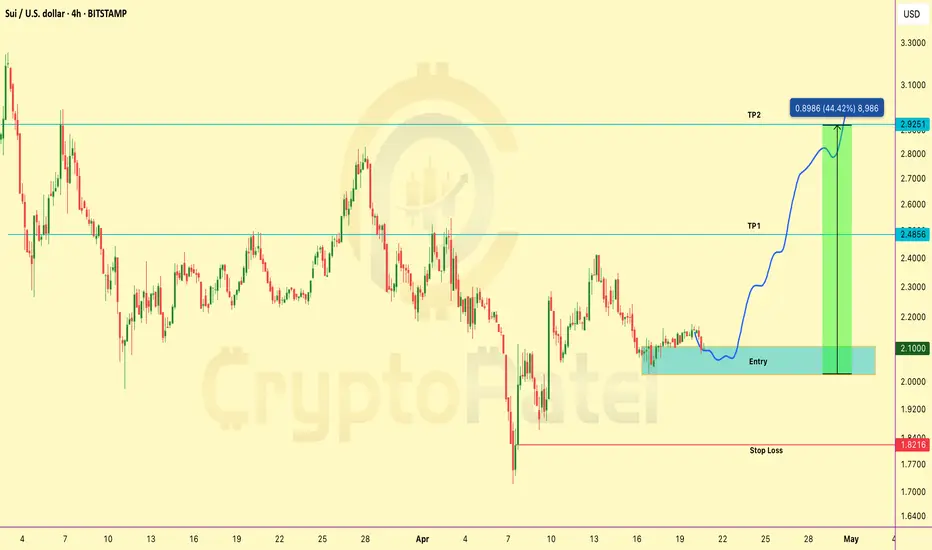
SUI/USDT Chart Analysis and Looking Long Setup for Good RRIf you're hunting clean setups with solid R:R — this CRYPTOCAP:SUI long looks 🔥
▶️ Entry: $2.10–$2.00
▶️ Targets: $2.48 / $2.92
▶️ SL: $1.82
Perfect for risk-managed apes. Don’t sleep on it.
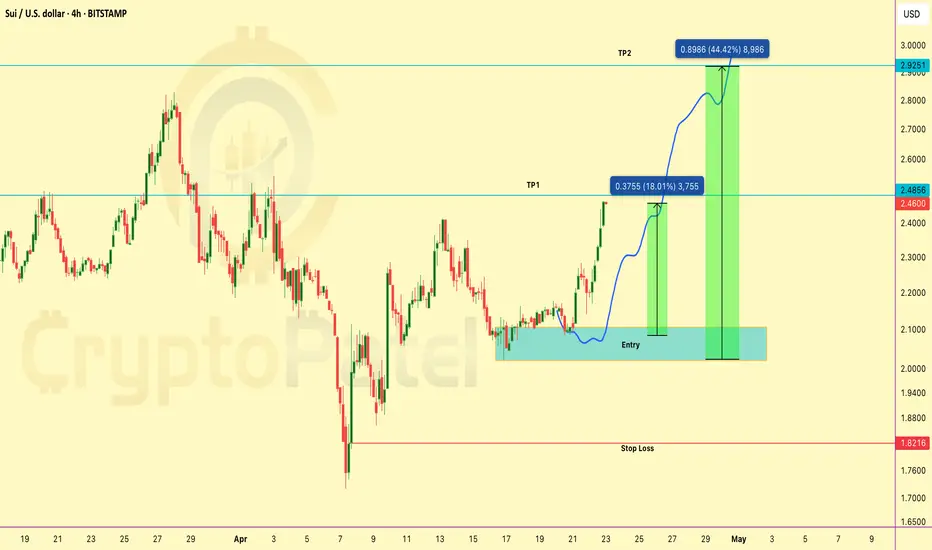
SUI/USDT Now 18% up in Spot from our Entry LevelCRYPTOCAP:SUI just hit +18% on spot and a massive +176% on 10x leverage from our shared trade setup! 🚀
➡️ Entry: $2.08
➡️ Current: $2.4660
Solid breakout play — hope you all caught the move!
Feel free to lock in profits anytime here for a safe exit. ✅
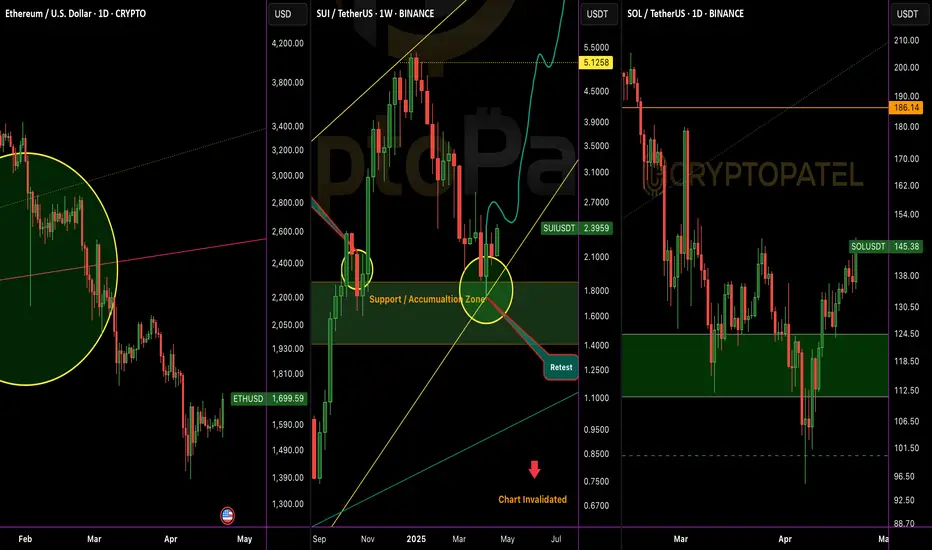
Bitcoin And Altcoins Price Difference🚨 2 months ago, #Bitcoin hit $90K and alts were flying:
CRYPTOCAP:ETH – $2,850
CRYPTOCAP:SUI – $3.50
CRYPTOCAP:SOL – $180
Today, BTC is BACK above $90K… but alts are in the dip!
CRYPTOCAP:ETH – $1,700
CRYPTOCAP:SUI – $2.40
CRYPTOCAP:SOL – $145
Never Forget to Buy at F*** Dip you Planning for Long Run
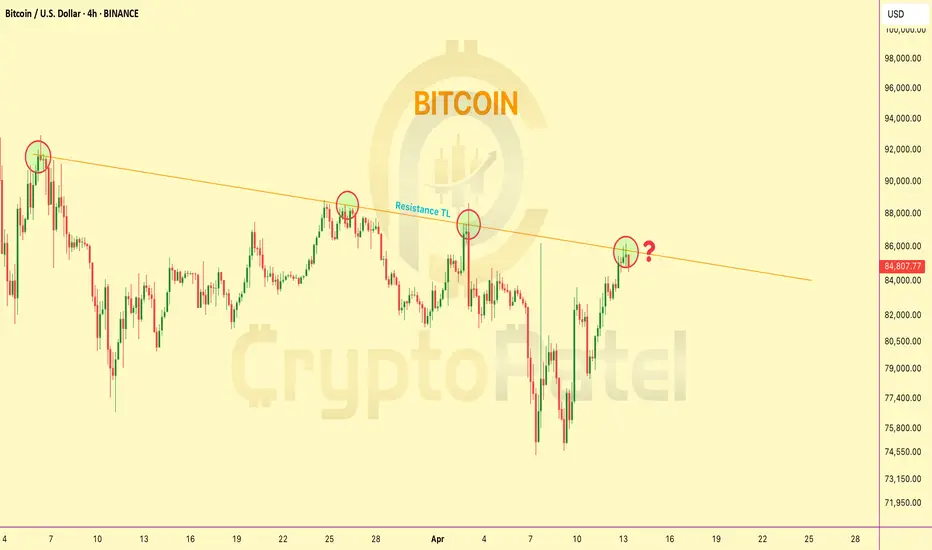
Bitcoin trading at Resistance level so What Next?🚨 Bitcoin 4H Chart Update
CRYPTOCAP:BTC is now trading right at the trendline resistance on the 4H chart
So what’s next?
1️⃣ Breakout and blast toward $100K?
2️⃣ Or another rejection down below $70K?
The decision point is HERE.
This breakout could change the game.
👇 Drop your thoughts –
#SUI to $50 in the Future? Which is 25x-30x ?#SUI to $50 in the Future?
I won’t tell you why — because that’s where your research comes in.
But here’s a clue:
▪️ Accumulation Zone: Below or around $2
▪️ Patience = Potential
▪️ Come back and thank me in 3–4 years.
Not Financial Advice — Always DYOR.
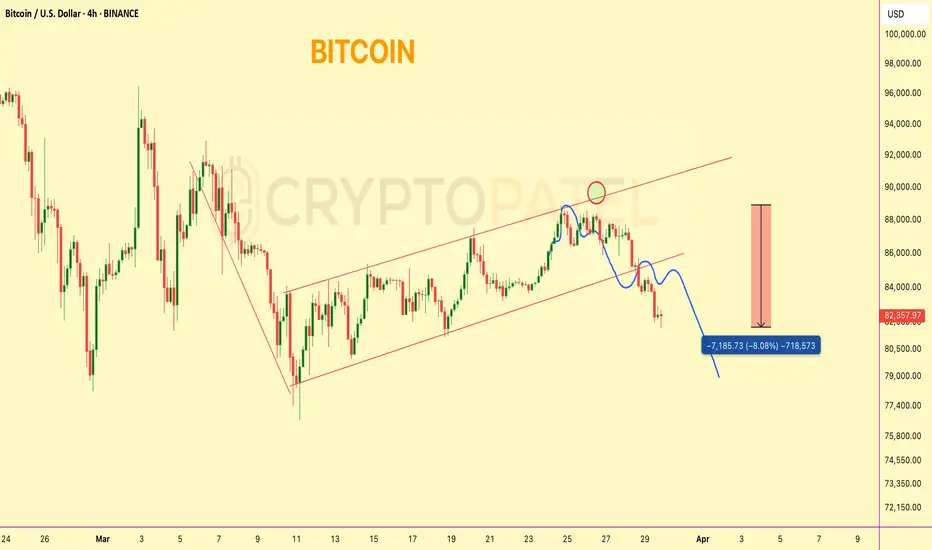
Bitcoin Dumped from our Entry levels and now 8% down#Bitcoin Bearish Flag Update
Price rejected perfectly from $89,000 resistance — our short setup played out with a solid -8% move.
Currently trading around key support at $82,000.
Trend Bias: Bearish below $85,700
Next major support: $75,000–$70,000 zone
Structure still favors further downside unless $85.7K is reclaimed.