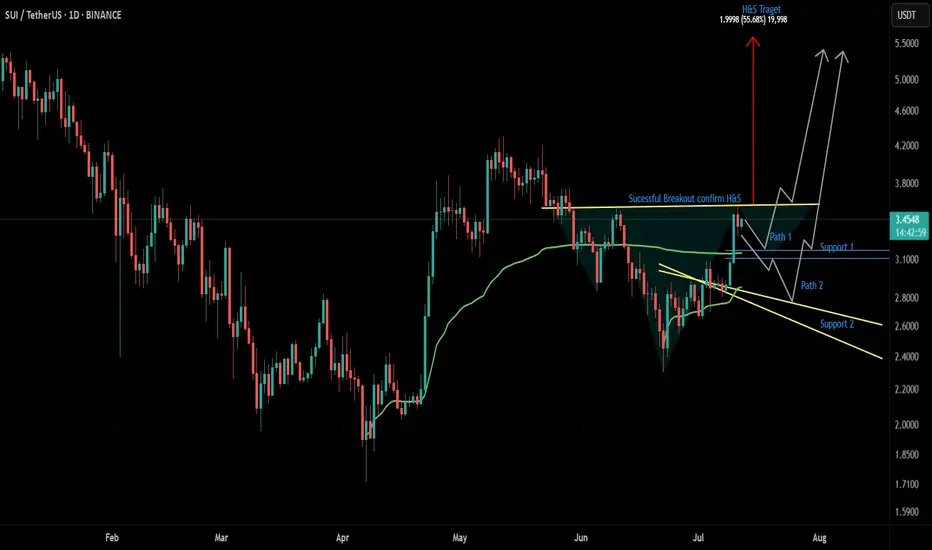
$SUI Inverse H&S FormingA large inverse Head & Shoulders pattern appears to be forming on $SUI. The $3.1758 zone looks like a solid area to long — potentially marking the bottom of the second shoulder. If a deeper correction occurs, I'm also watching the $2.7473 level for another possible long entry.
My plan is to pre-position by longing near the second shoulder. Once $3.5902 breaks and we get a successful retest, the pattern would be confirmed. From there, a 50% move up toward the neckline target of $5.6252 could follow.
This is not financial advice. Trade at your own risk.
SUIUSD
SUI ATH Technical Analysis & Commentary- SUI is currently trading at 3$ and printed another new All time high
- SUI is driving a lot of FOMO amongst retailers
- SUI has shown real outperformance when compared to Altcoins
- SUI is currently in a price discovery mode
- Accumulation Zones for Spot Buys: I have drawn 2 accumulation zones that you all can keep your radar on these two zones are highly conservative and efficient in terms of spot buys
- Short Term Targets: 3.5$ and 4.1$
- Note: If you are already holding SUI and if you are in a massive profit start locing in partials and utilize the same money to add in dips. Never leave gains on the table

SUI TRADE ANALYSIS #SUI is showing strong performance with a breakout above a descending trendline. Currently, a small pullback is needed for BTC as well as SUI in order make its price higher.
SUI broke descending trendline successfully and currently retesting is on the way. If retracement occurs and holds, price target coulb be above 0.90 and above 1.10
Idea entry is approx 0.75 region.

#SUI : Bullish breakout pending!!!!!#SUI / D1 :
Sui is trading inside a rising wedge and it is repeatedly testing its resistance trendline. If the resistance gets broken, Expecting a 40% bullish rally as per textbook pattern target.
Also, Rising wedges mostly tend to break upwards during bull markets.

SUI SWING LONG SETUP SUI/USDT LONG SETUP
Entry - 0.55-0.60$
SL - 0.50$
Sui is a Solana kille
The setup forming currently looks amazing
Huge base building on a daily timeframe
Sui if entered at a great discount can easily fetch 50% in a month because it's getting ready for an impulsive move
