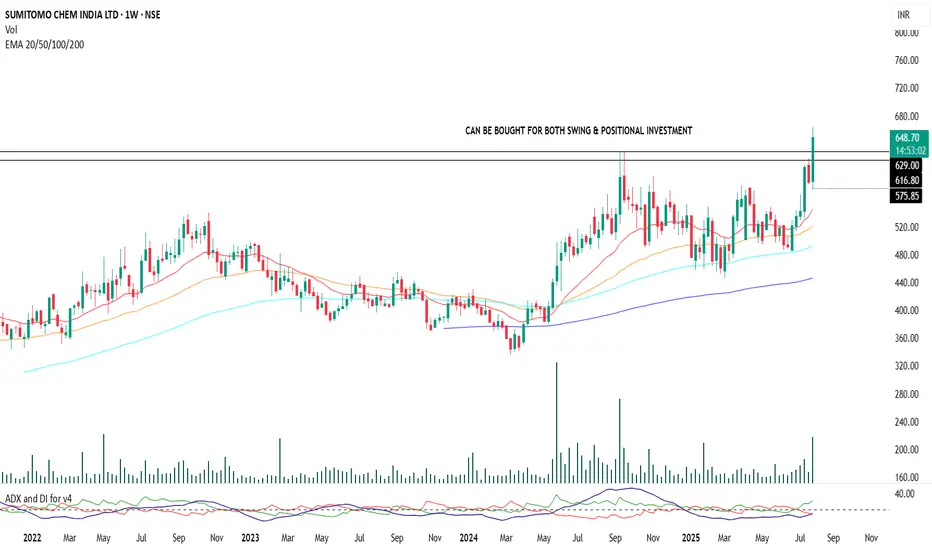
Sumitomo Chemical | Positional Swing Setup with Dynamic SLA strong setup is forming in Sumitomo Chemical with bullish c price action and trend indicators. Entry can be been initiated at current levels with small quantity with a stop-loss placed at ₹570 on a weekly closing basis.
No fixed targets. This is a trailing stop-loss-based position aimed at capturing a sustained trend move.
Add-on Zone: If the price retests the support near the ₹630 level (previous structure/support), more quantity will be added as part of a pyramiding strategy, provided broader market structure remains bullish.
Indicators Used for Trailing SL & Confirmation:
ADX & DI , RSI Levels
Exit Criteria:
Weekly close below ₹570 (hard stop)
Note: This is a disciplined, structure-based swing trade with optional pyramiding. Avoid impulsive exits; trail stop-losses logically based on trend indicators.
Sumitomochemicals
Sumitomo Chemical - Chart of the MonthNSE:SUMICHEM showed good price action this month, showcasing strength in this market and looking to continue that further, hence qualifying for my Chart of the Month.
About:
NSE:SUMICHEM is one of the leading players in the industry, which has a balanced portfolio of technical and formulation products along with backward integration for some products.
The Company is known for domestic marketing of proprietary products of its Japanese parent, TSE:4005 in agrochemicals, animal nutrition, and environmental health business segments. With the integration of Excel Crop Care Limited, the Company now has a strong portfolio of generics in addition to specialty products and a strong combined marketing network.
Trade Setup:
It crossed major Swing High Levels this Month and is now looking to cross ATH, RSI & MACD Trending Upwards. Buy on DIPS can be done if it consolidates. The Base Formed Will be an Ideal Stop Loss.
Target:
Around 672 Levels can book a partial at the ATH Zones.
Stop Loss:
Entry Candle Low For Swing Traders and Base Marked for Positional Traders.

sumitomo chem india ltd | Wtf major breakout!📌 counter trendline (ct) – The yellow line that acted as resistance for the stock during its downtrend. The price has now broken above this, indicating a potential reversal.
📌 hidden line (hl) – The white line marking a key resistance level. Once this was breached, it signaled strong bullish momentum.
📌 trendline (t) – The green line acting as a long-term support. As long as the stock respects this trendline, the bullish structure remains intact.
📊 volume confirmation – A noticeable increase in volume suggests strong buyer interest, adding weight to the breakout.
What’s your take on this setup? 📈

SUMITOMO CHEMICALS: Possible 20% upside ⚡️Price Analysis:
1️⃣ Healthy buying volumes
2️⃣ Bullish price structure with clear HH-HL formation intact
3️⃣ Trading near crucial EMA support - potential reversal zone
4️⃣ Multiple demand zones providing strong confluence support
5️⃣ Strong bullish candle near the fibo support.
✨ Key Observations:
➡️ Strong Dz forming at EMA confluence zone
➡️ Trendline break could trigger fresh momentum
➡️ Volume confirms accumulation at lower levels
➡️ Bullish reversal candle formation at support
➡️ Similar setup to Care Ratings as shared in the earlier publication.
➡️ RRR favorable for longs at current levels
⚠️ Disclaimer: This is NOT a buy/sell recommendation. This post is meant for learning purposes only. Views are personal. Please, do your due diligence before investing.⚠️
💬 What's your view on Chemical sector? Share below! ✌️🔥 Happy Trading!✅🚀

Sharda Cropchem for 60% gainsDate: 11 Nov’24
Symbol: SHARDACROP
Timeframe: Daily
Sharda Cropchem seems to be in Wave III of 3 which is heading towards 1350 (~60% from current price of 800) as seen in the chart. Wave 3 could even extend to 1500 which can be reviewed after closing above 1100 in Wave V of 3. Recent Q2 results are good with better margins compared to last FY.
This is not a trade recommendation. Please do your own analysis. And I have the right to be wrong.
HINGLISH VERSION
Jaisa ki chart mein dekha gaya hai, Sharda Cropchem 3 ke Wave III mein dikh raha hai jo 1350 (800 ki maujooda keemat se ~60%) ki taraf badh raha hai. Wave 3 1500 tak bhi jaa sakta hai; jiskee sameeksha 3 ke Wave V mein 1100 se upar band hone ke baad ki jaa sakti hai. Pichhle FY ki tulana mein behatar margin ke saath haal ke Q2 ke nateeje achchhe hain.
Yah koi trade lene ya nivesh karne ki salah nahin hai. Kripya apna vishleshan svayan karen. Aur mujhe galat hone ka adhikaar hai.

SUMICHEMICAL PROBABLE LONG IDEASUMICHEMICAL looks strong breaking out in weekly timeframe.
It closed above weekly support line during heavy volatility on June4.
So need to see whether it closes above weekly support line this Friday
Need to plan trade accordingly.

minor update on previous chart sumitomo chem ....every thing looks alike as previous chart. i just tabled the first wave of the new emerging wave in a detailed manner than the previous chart. a minor update

buy point with sumitomo.we may accumulate at this point.
with 381 as stop loss we can go to sail with the tide.

Sumitomo chemical Sumitomo chemical is currently trading in an uptrend , wait for the up or down breakout

Trend Support - Key LevelSumitomo chemicals is an leading company in Indian Chemicals sector.
The quarterly earnings of the company were strong, but due to short term regulatory changes, the share saw a downfall.
One of its chemicals ~ 15% revenue had its usage restricted, but the management expects these headwinds to ease in the mid to long run.
Overall valuations seem attractive, sound fundamentals and with the growth in the entire chemicals space, the company is bound to benefit.
I will be interesting to see how longer can the market keep up its bearish pressure despite good quarterly numbers.
I am expecting a maximum drawdown to 450, and good bounce after that.
Not an Investment Advice, only for educational purpose.

SUMITOMO CHEMICAL GOING TO BLASTSumitomo chemical picking up the volumes and broke it previous resistance .Target shows in the chart
ps.I am not sebi registered this content is education purpose only

Target 1 (9%) achieved in Sumitomo Chemical. Target 2 is ON...This is follow-up on Sumitomo Chemical. Can check link to related ideas.
Target 1 achieved. More than 9%. Target 2 is ON. Can give big move once price close above purple trend line .
Chart is self explanatory. Entry, Targets and Trailing Stop Loss are mentioned on the chart.
Disclaimer: This is for demonstration and educational purpose only. This is not buying or selling recommendations. I am not SEBI registered. Please consult your financial advisor before taking any trade.

SUMITOMO | Breakout with Vol | 30% PossibleNSE:SUMICHEM
Breakout with Volume from Downward Sloping Trendline
Tgt : 455 - 510 - 550
SL : 378
RSI in Bullish Zone & Rising

SUMITOMO CHEMICALS IND LTDThis is just for educational purpose and no buy or sell recommended.
Chart is self explanatory and if it shows a good green breakout candle then consider this for long positions

Bullish Divergence & Break out on Daily charts for Sumitomo ChemSumitomo Chemicals seems to be giving a BO on daily charts, volumes are decent, RSO is close to 60. The RSI has given bullish divergence, this can be confirmed with the BO given today of the falling trendline with decent volumes.
Disc : Invested, not a reco to buy or sell.

Flag and pole pattern in SumiChem?CHART -> Sumitomo Chemical WEEKLY SETUP
As seen per chart, it looks like Sumitomo Chemical is trading under a flag and pole pattern. Any side of the trendline breakout, may it be on the upper or lower, will decide the further path of the stock. For breakout it has to cut the trendline on a weekly close candle.
As per today's scenario a morning star, which is bullish reversal pattern is forming on the chart. If price sustain around 380-385 or higher than that upto this coming Friday, we may see strength in coming weeks.
Also as per today RSI has also gave a breakout, showing strength of bulls.
Disclaimer: This is for educational purpose only. This is not any recommendations. I am not SEBI registered. Please consult your financial advisor before taking any action.

BUY - Sumitomo chem [swing trade idea]NSE:SUMICHEM
Stock trading near good support zone. Buy at this level for a target of 450. NOTE - Wait until we see good volumes.

Sumitomo sumichem should perform now#sumichem
Sumichem / sumitomo
Volumes are nearly dead.
Expecting a spike soon.
Trading around support area.
Can be good addition.
Although in chemical play don't keep this one as major holding in folio.
#VR

Can it go up? or will go down?Fundamentally the stock is Strong.
If it gives a breakout can go back to previous highs and a little further.
if it breaksdown can go down a good way.
Watchout!!
in my watchlish!!.

SumiChem Expecting Breakout for Intraday*Always Enter With good confirmation & Maintain proper Risk Reward.
******* Knowledge Purpose only ********
>> Visit My Ideas Page for Daily Stock Analysis & check my previous stock analysis how accurate they are for Swing and Intraday Trades<<

SUMITOMO CHEMICAL--> Standing on supportCurrently standing at a crucial support of 21EMA can give fast 5-6% return on upside. its worth keeping in your watchlist


SUMITOMO CHEMICAL LONGLooking at the weekly charts of Sumitomo Chemicals it can be seen that there is a year old resistance line. And then there is beautiful breakout of this line accompanied by good volumes... (OPEN THE CHART FOR DEATAILED VIEW)
Now, here RSI is high and shows momentum. Hence RSI should fall marginally. Therefore, prices must fall, but not to a great extent. This can be justified as a retrace after the breakout.
LEVELS:
Entry: 372-377 (After retrace)
Target 1: 452-455
Target 2: 525-528
STOP LOSS: 355-357 (Closing basis0
TRAIL STOP LOSS
Risk-Reward Ratio Favorable!!
Volumes check
MACD bullish
I would recommend going long on SUMITOMO CHEM. for a swing trade
FOLLOW IF YOU LIKE THE ANALYSIS
LIKE AND COMMENT WHAT YOU THINK!!
THANKS
