SUN PHARMA Near Key Demand | High-Probability Swing Buy ZoneTimeframe: Daily
Current Spot Price: ~₹1,701
🔍 Technical Structure & Chart Logic
Sun Pharma remains in a broader consolidation with higher-timeframe strength, holding firmly above the 200-DMA (~₹1,649).
The recent decline is a healthy corrective ABC structure:
Wave (a): Initial decline from the recent swing high
Wave (b): Corrective pullback
Wave (c): Decline into the Golden Retracement Zone (50%–61.8%)
The Golden Retracement Zone (₹1,612 – ₹1,698) overlaps with:
Prior demand base
Rising 200-DMA
Breakout retest region
This zone acts as a high-probability accumulation area for swing buyers.
🟢 Swing Trade – Buying Strategy (Cash / Futures)
✅ Best Buying Zone (As per Chart):
₹1,669 – ₹1,682
Secondary accumulation allowed on dips toward ₹1,620–₹1,650
🎯 Swing Targets:
Target 1: ₹1,780
Target 2: ₹1,880
Major Target Zone: ₹1,970 – ₹2,000
🛑 Swing Stop Loss (Strict):
₹1,607 – Daily candle close below
The swing structure remains valid as long as price holds above the golden retracement zone.
🟡 Options Trade – January Expiry Strategy
📌 Directional Bias: Buy-on-dips | Moderately Bullish
▶️ Call Option Setup
Buy: 1700 CE or 1750 CE (January Expiry)
Entry Logic:
Near ₹1,670–₹1,700 on stabilization
OR on strong hourly close above ₹1,720
🎯 Option Targets (Spot-Based):
₹1,780 → partial profit booking
₹1,880 → trail SL
Momentum continuation may extend toward ₹1,970+
🛑 Options Stop Loss:
Spot-based: Hourly close below ₹1,650
OR
35–40% premium stop loss
Prefer ATM / slightly ITM strikes to reduce theta decay risk.
⚠️ Risk & Invalidation Levels
Hourly acceptance below ₹1,650 indicates weakness.
Daily close below ₹1,607 invalidates the bullish swing view.
Below this, price may revisit deeper consolidation supports.
📌 Conclusion
Sun Pharma is testing a textbook golden retracement + 200-DMA confluence zone. This setup favors swing accumulation with defined risk, while January expiry options offer a controlled way to participate in the potential upside.
⚠️ Disclaimer
This analysis is for educational purposes only. I am not a SEBI-registered analyst. Please manage risk responsibly.
SUNPHARMA

Sun Pharma Beakout on 1W TFHello Traders,
Sun Pharma had given the breakout, retested the trendline, and had formed the green candle closing this week. Previous resistance zone can act as support. Target are recent high and the all tiem high. RR ratio is about 2.7 which looks pretty good for swing trade.
Note: This post is for information purpose only. This is not any trading or investment advice.

Senores pharma breakout possibleUS fda approved facility which prevents them from any risk of tariff, very good guidance and growth projections. breakout possible very soon

Sunpharma Buy - Trade confirmationSunpharma - Bullish Breakout
1) Strong Trendline Breakout
2) From recent low made Higher High
3) Solid Range Breakout
4) EMA crossover and Sorted.
Disclaimer - Charts shared are for educational purposes only. It’s not a trade recommendation. Market are subject to financial risk, Do your own analysis before initiating any Trade.

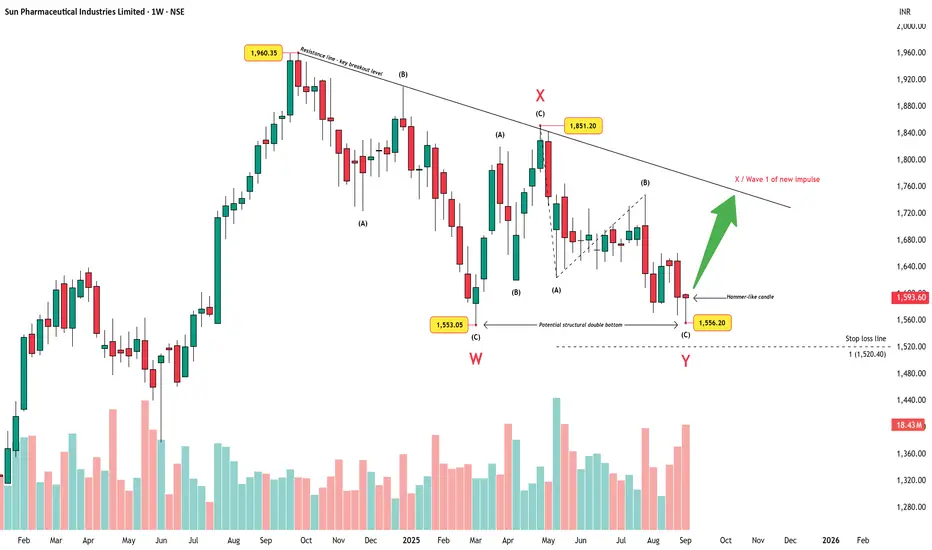
Sun Pharma – Double Bottom and Trendline Test AheadChart Summary
Sun Pharma’s weekly chart shows a completed W–X–Y corrective structure. Wave W bottomed near ₹1,553.05, followed by a corrective X at ₹1,851.20, and Wave Y terminating at ₹1,556.20. This final Y-leg has unfolded as an abc zigzag, respecting the larger corrective framework.
Price Action Highlights
A potential structural double bottom has formed around the ₹1,553–₹1,556 zone, hinting at possible exhaustion of the correction.
The latest candle is a hammer-like bar, suggesting demand stepped in around support levels.
Overhead, a major downtrend resistance line connecting the highs (₹1,960.35) to the swing X (₹1,851.20) remains the decisive breakout level.
A clear stop-loss line sits near ₹1,520.40, aligned with the 100% extension of Wave A inside Y. A break below this level invalidates the bullish case.
Volume Perspective
Recent selling has come with a volume spike, often seen during exhausation selling phases. If volume eases on follow-up candles while price holds above the support zone, it strengthens the case for a reversal.
Outlook
If price can sustain above the ₹1,553–₹1,556 support cluster and eventually break the trendline resistance, it may confirm the end of the corrective phase and open the door for a new impulsive sequence higher. Failure to hold the stop-loss zone, however, would negate this view and suggest further downside.
Disclaimer: This analysis is for educational purposes only and does not constitute investment advice. Please do your own research (DYOR) before making any trading decisions.
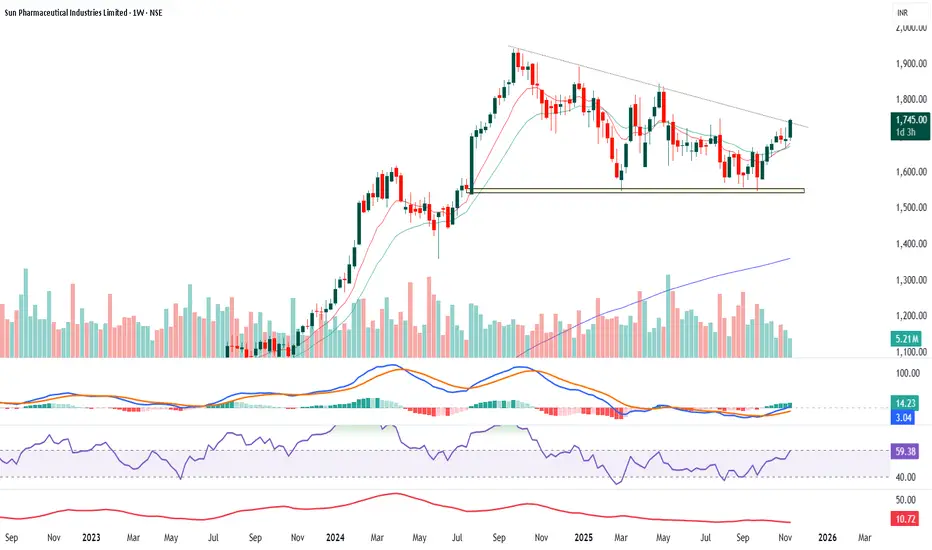
SUNPHARMA - Weekly- LONGA simple and clear analysis of the Sun Pharma weekly chart based on trend, volumes, momentum, RSI, ADX, and chart structure:
Trend: The stock has been in a broad consolidation for many months. It was making lower highs, forming a downward sloping trendline. Now the price is trying to break above that trendline. This shows the first sign that the downtrend may be ending and a fresh upward move may start. The long-term trend is still positive because the price has stayed above the major support zone around 1550–1600.
Chart pattern : The chart is showing a descending trendline with multiple touch points. The stock has bounced strongly from the support zone and is now testing the trendline. A clean breakout above this trendline will confirm a trend reversal.
Volumes: Volumes have been stable but not very strong. However, during recent green candles, volumes have slightly increased, which shows buying interest returning slowly. A breakout with higher volume will give more confidence.
Momentum (MACD)
The MACD has crossed above the signal line, which indicates bullish momentum building up. The histogram turning green also supports the idea that the momentum is improving.
RSI : RSI is around 59, which means the stock is gaining strength but is still not overbought. This is a healthy zone for an early-stage uptrend.
ADX : ADX is around 10, which indicates that the current trend strength is weak. It means the stock was in a range for a long time. As price breaks out and ADX starts rising, the new trend will get stronger.
Overall view : Sun Pharma is showing early signs of a trend reversal. Price is near a trendline breakout, momentum indicators have turned positive, RSI is rising, and the stock is holding a strong support zone. A confirmed breakout above the trendline with good volume can start a fresh upward move.
#Cipla - #ShortTerm #Inveatment IdeaCipla Ltd - Technical Analysis
Current Price: 1,639.10
Timeframe: Monthly Chart Analysis
This analysis utilizes:
- Monthly and Weekly timeframe analysis
- Fibonacci extension and retracement levels
- Support/resistance identification
- RSI momentum analysis
- Price action patterns
Technical Structure Overview
1. Monthly Consolidation Phase
After making a higher high, Cipla is currently in a consolidation phase on the monthly chart, forming a strong base. This consolidation suggests preparation for a potential significant move higher.
2. Breakout Level to Watch
The critical level to monitor for breakout confirmation is around the recent high zone. A decisive break above this level could trigger the next leg of the uptrend.
3. Weekly Timeframe Confirmation
For higher probability setups, confirmation should be sought on the weekly timeframe before taking any positions. This multi-timeframe approach reduces false signals.
4. Fibonacci Extension Targets
Based on Fibonacci patterns, the following extension levels have been identified as potential targets for future price movement.
5. Risk Management Strategy
Following a risk-reward approach is essential for this setup given the consolidation phase and potential for significant moves in either direction.
Fibonacci Extension Target Levels
Based on technical projections:
- Target 1: 1,872.70 (1.272 Extension at 1,878.05)
- Target 2: 1,986.95 (1.414 Extension at 1,987.15)
- Target 3: 2,145.45 (1.618 Extension at 2,143.95)
Key Support Levels
Primary Support: 1,345.75 (0.5 Fibonacci level)
Critical Support: 900.50 (0 level - invalidation zone)
Trading Considerations
Bullish Scenario:
- Wait for monthly candle close above consolidation range
- Confirm momentum on weekly timeframe
- Enter on weekly pullback for optimal risk-reward
Invalidation:
- Break and close below ₹1,345.75 would weaken the bullish structure
- RSI showing divergence patterns to monitor
DISCLOSURE & RISK WARNING:
This analysis is provided for educational and informational purposes only and should not be construed as financial advice, investment recommendation, or an offer to buy or sell securities. Past performance is not indicative of future results.

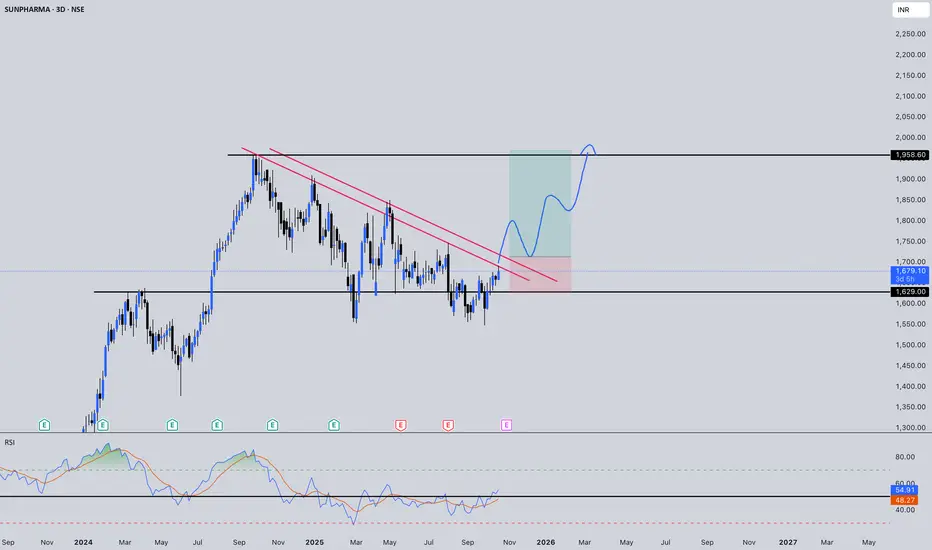
SUNPHARMA : The 12-Month Compression SetupAfter correcting 20%+ from ₹1,958 ATH, SUNPHARMA has spent 12 MONTHS building a base around ₹1,629. Classic descending triangle forming at apex.
🔍 Technical Snapshot:
🔺 Resistance: ₹1,700 (trendline + psychological)
🔻 Support: ₹1,629 (tested 5x, holding firm)
📈 RSI: 59 ( bullish, room to 70)
📉 Pattern: Descending triangle - lower highs meeting higher lows
What I'm Watching:
1️⃣ Trendline resistance at ₹1,700 (declining from ATH)
2️⃣ Each test of ₹1,629 support absorbed with higher lows
3️⃣ RSI sitting neutral - no momentum extreme yet
4️⃣ Volume declining during consolidation = Energy coiling
5️⃣ Breakout & retest of the trendline will be the perfect confirmed setup
Risk/Reward from ₹1,679:
- Upside to ₹1,970 = +15%
- Beyond ₹1,700 = ₹1,800-1,970 in play
The longer the consolidation, the bigger the eventual move 👀
Not advice - just what the chart shows.
Breakout Scenarios:
- Above ₹1,700 with volume → ₹1,750-1,800 targets (+4-7%)
- Below ₹1,629 breakdown → ₹1,580-1,550 risk (-3-8%)
The Setup: 6 months of compression between declining resistance and flat support = Spring loading.
The longer the base, the bigger the eventual move ⚡
Next 2-4 weeks critical. Watching for volume confirmation on direction. 🔥
⚠️ Disclaimer: This is NOT a buy/sell recommendation. This post is meant for learning purposes only. Views are personal. Please, do your due diligence before investing. (#DYOR)⚠️
💬 Share your thoughts in the comments below! ✌️
🔥 Trade Safe! ✅ 🚀
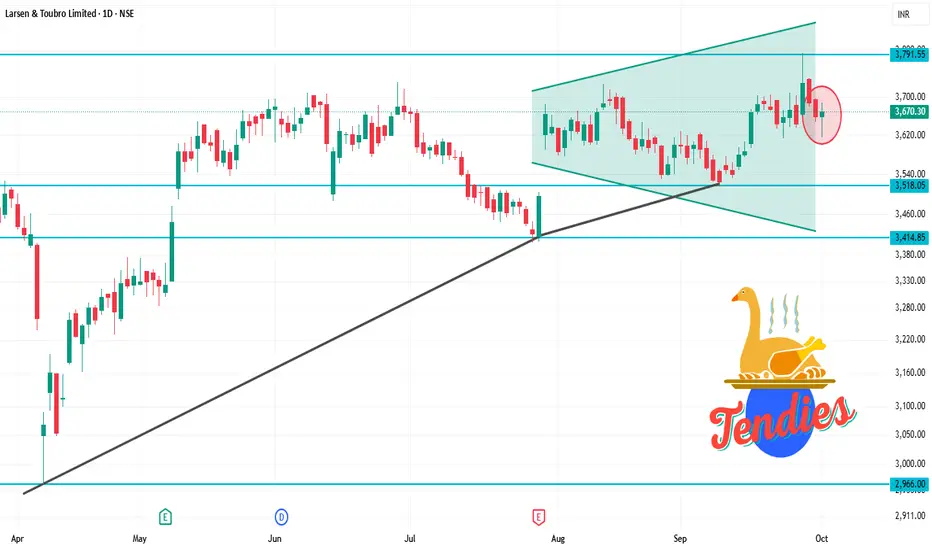
LT 1D Time frameCurrent Snapshot
Current Price: ₹3,670.30
52-Week High: ₹3,963.50
52-Week Low: ₹2,965.30
Strategy & Outlook
Bullish Bias: The stock is in a short-term uptrend with positive momentum indicators.
Buying Opportunity: Consider entering near support zones (₹3,600–₹3,650) with a target towards ₹3,700–₹3,750.
Risk Management: Place stop-loss orders below the support levels to manage potential downside risks.
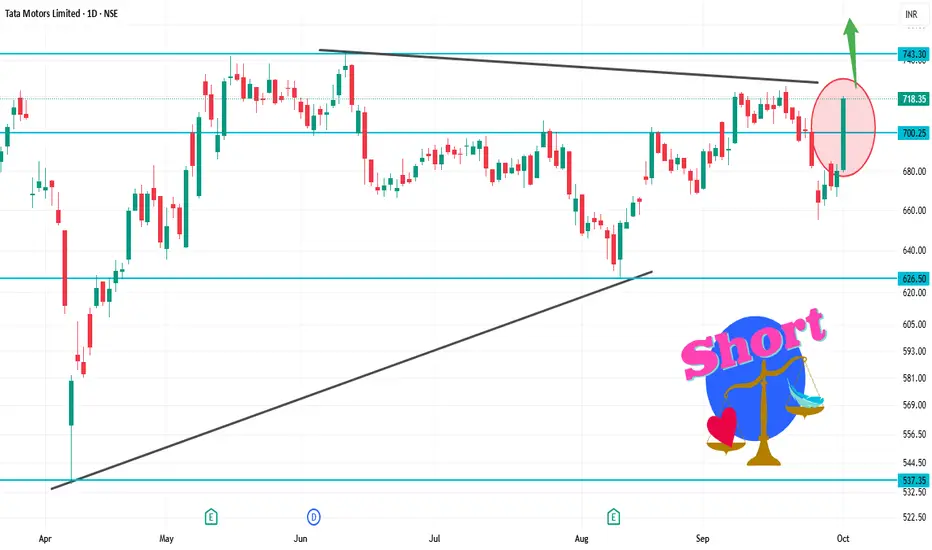
TATAMOTORS 1D Time frameCurrent Price: ₹718
Day Range (today): Around ₹705 – ₹725
52-Week Range: ₹535 – ~₹1,000
📏 Key Levels with ₹718 in focus
Immediate Resistance: ₹750 – ₹800 (needs breakout above this zone)
Current Level: ₹718 → price is right between support and resistance
Immediate Support: ₹700 – ₹705 (if broken, could fall further)
Next Support: ₹650 – ₹660 (major zone to watch)
🧠 What this means
Since price is just above support (₹705) and below resistance (₹750), it’s at a decision point.
If Tata Motors holds above ₹705–₹710, buyers may try to push toward ₹740–₹750.
If it fails and breaks below ₹705, price may revisit ₹660 levels.
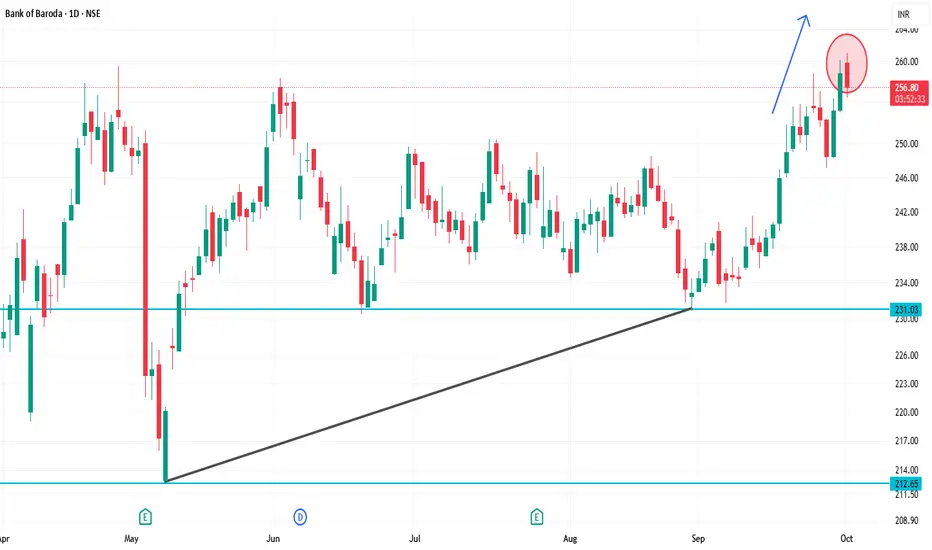
BANKBARODA 1D Time frameClosing Price: ₹257.60
Day Range: ₹253.70 – ₹260.00
Previous Close: ₹258.54
📉 Trend Analysis
Short-Term Trend: Bearish — The stock is trading below key moving averages, confirming the bearish trend.
Medium-Term Trend: Neutral — The stock is in a consolidation phase, characterized by lower highs and lower lows.
Long-Term Trend: Neutral — No significant trend identified; the stock is trading within a range.
🔮 Conclusion
Bank of Baroda is in a bearish trend with weak momentum.
Break below ₹250.00 could lead to further decline toward ₹245.00.
Break above ₹265.00 would indicate a potential trend reversal.
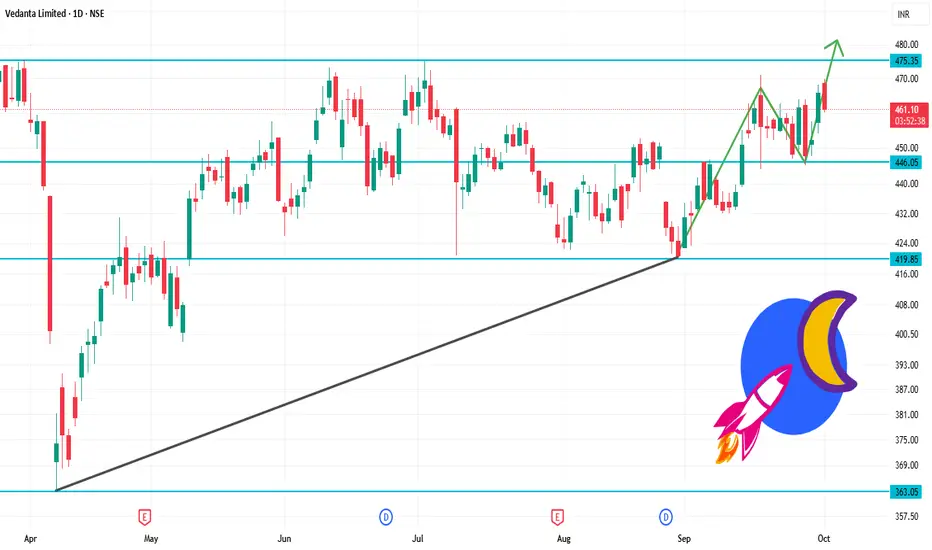
VEDL 1D Time frameOpening Price: ₹468.55
Closing Price: ₹461.40
Day Range: ₹463.00 – ₹469.85
Volume: 2,730,213 shares traded
📉 Trend Analysis
Short-Term Trend: Bearish – The stock is trading below key moving averages, confirming the bearish trend.
Medium-Term Trend: Neutral – The stock is in a consolidation phase, characterized by lower highs and lower lows.
Long-Term Trend: Neutral – No significant trend identified; the stock is trading within a range.
🔮 Conclusion
Vedanta Ltd. is in a bearish trend with weak momentum.
Break below ₹460.00 could lead to further decline toward ₹455.00.
Break above ₹475.00 would indicate a potential trend reversal.
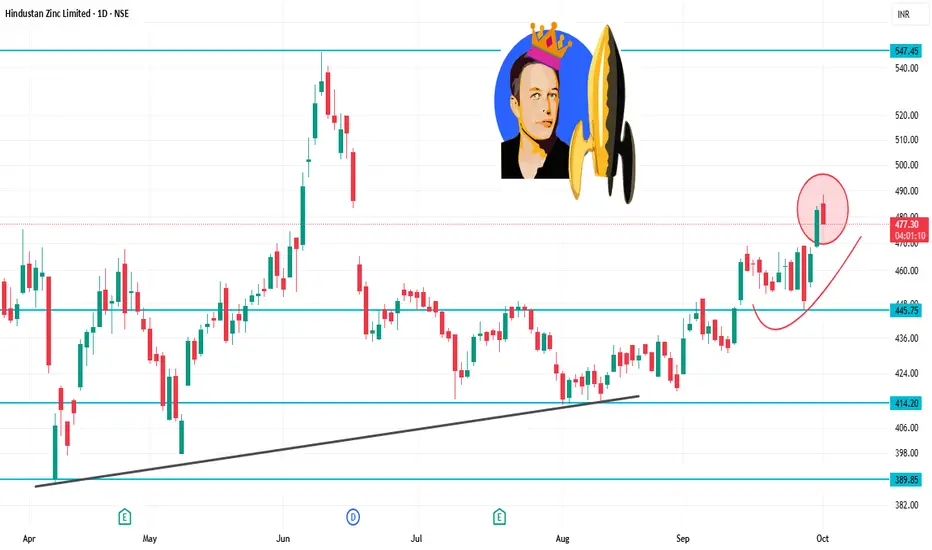
HINDZINC 1D Time frameDay Range: ₹478.35 – ₹488.40
52-Week Range: ₹378.15 – ₹575.40
Volume: 284,459 shares traded
📉 Trend Analysis
The stock is in a downtrend, characterized by:
Lower highs and lower lows.
Failure to break above resistance levels.
The short-term trend remains bearish.
🔮 Conclusion
Hindustan Zinc is in a downtrend with weak momentum.
Break below ₹470.00 could lead to further decline toward ₹460.00.
Break above ₹495.00 would indicate a potential trend reversal.
SENSEX 1D Time frameOpening Level: ₹80,500
Current Level: ₹80,15.23
Day's Range: ₹80,300 – ₹80,800
🔑 Key Support & Resistance Levels
Immediate Support: ₹80,500
Immediate Resistance: ₹81,000
Pivot Point: ₹80,745.23
📊 Market Sentiment
Trend: The Sensex has experienced a six-day losing streak, indicating bearish momentum.
Reuters
Volume: Trading volume is significantly higher than its 20-day average, suggesting increased investor activity.
📈 Strategy (1D Timeframe)
1. Bullish Scenario
Entry: Above ₹81,000
Stop-Loss: ₹80,500
Target: ₹81,300 → ₹81,500
2. Bearish Scenario
Entry: Below ₹80,500
Stop-Loss: ₹81,000
Target: ₹80,200 → ₹80,000
⚠️ Risk Management
Limit risk to 1% of capital per trade.
Always use stop-loss to protect against unexpected market movements.
Monitor broader market trends and sector-specific news that may impact index performance.

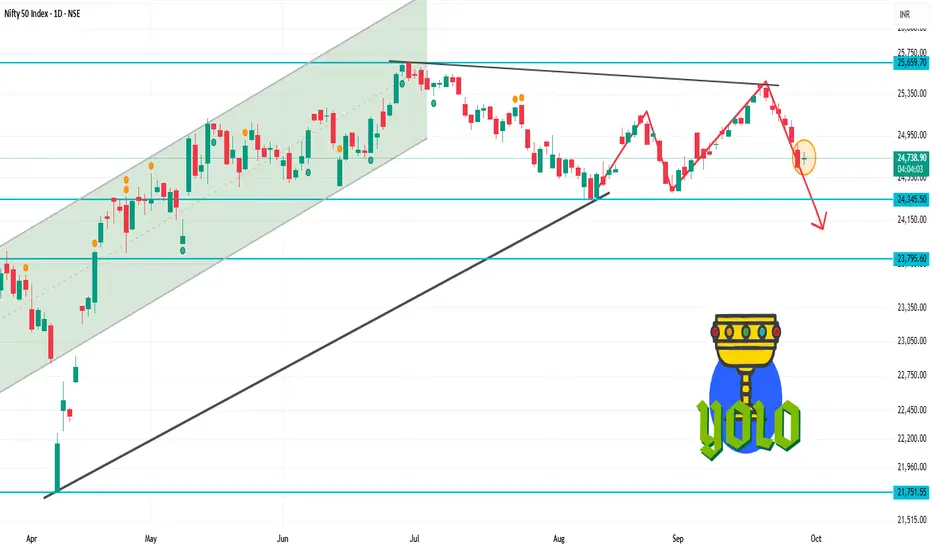
NIFTY 1D Time frameOpening Level: ₹24,691.10
Current Level: ₹24,765
Day's Range: ₹24,500 – ₹24,900 (approximate)
🔑 Key Support & Resistance Levels
Immediate Support: ₹24,500
Immediate Resistance: ₹24,900
Pivot Point: ₹24,765
📊 Market Sentiment
Trend: The NIFTY 50 has experienced a six-day losing streak, indicating bearish momentum.
NDTV Profit
Volume: Trading volume is higher than average, suggesting increased investor activity.
📈 Strategy (1D Timeframe)
1. Bullish Scenario
Entry: Above ₹24,900
Stop-Loss: ₹24,500
Target: ₹25,100 → ₹25,300
2. Bearish Scenario
Entry: Below ₹24,500
Stop-Loss: ₹24,900
Target: ₹24,300 → ₹24,100
⚠️ Risk Management
Limit risk to 1% of capital per trade.
Always use stop-loss to protect against unexpected market movements.
Monitor broader market trends and sector-specific news that may impact index performance.
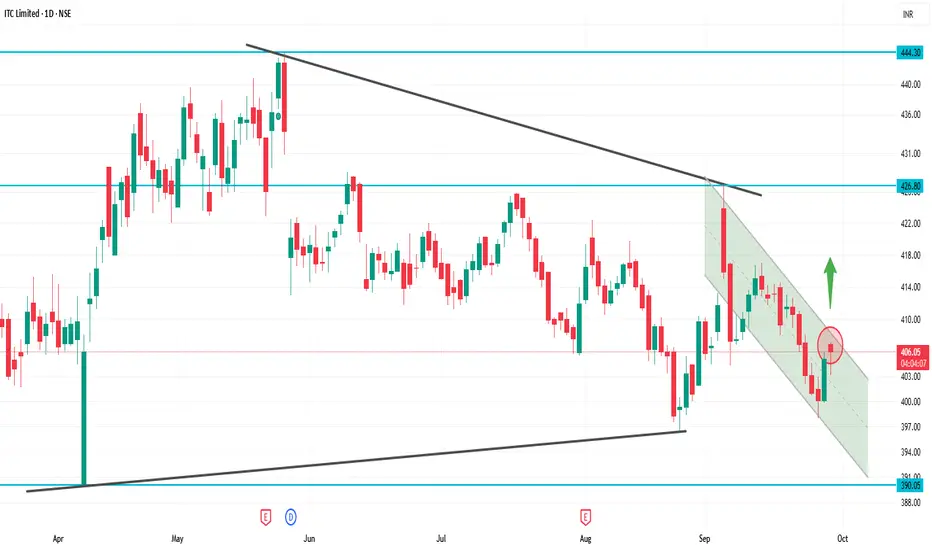
ITCITC Daily Snapshot
Current Price: ~₹405
Day’s Range: ~₹401 – ₹406
🔍 Key Levels
Support: Around ₹399 – ₹401 (near-term buying zone)
Resistance: Around ₹409 – ₹412 (supply zone)
📈 Technical Picture
Trend: Slightly bearish to sideways, but stabilizing above ₹405 gives some strength
RSI (Daily): Neutral zone, neither overbought nor oversold
Moving Averages: Price is close to short-term averages, so a decisive breakout above ₹409 is needed for bullish confirmation
VWAP: Trading near VWAP, showing balance between buyers and sellers
✅ Summary
At ₹405, ITC is near the middle of its range.
If it holds above ₹405 and breaks ₹409–₹412, bullish momentum can pick up.
If it falls below ₹401, it may retest support near ₹398.
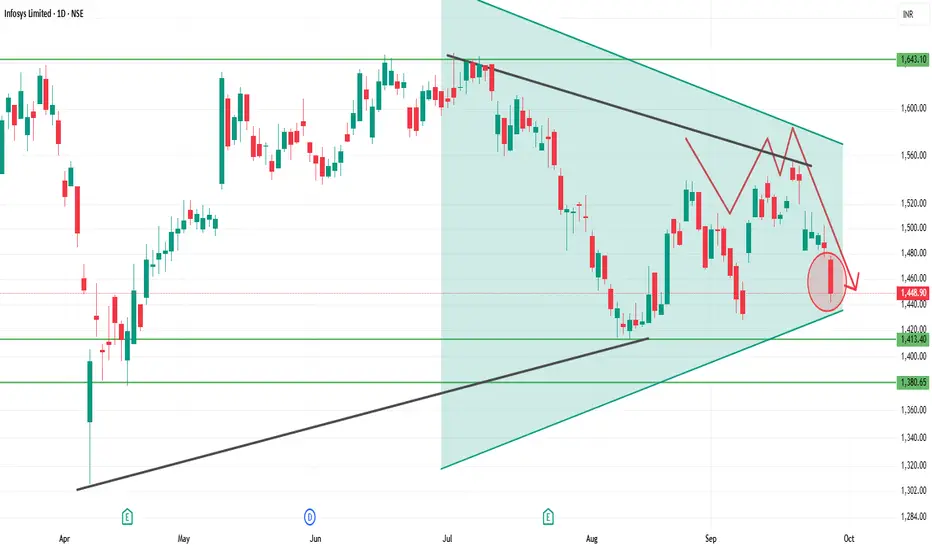
INFY 1D Time frameCurrent Zone: Around ₹1,448 – 1,450 (important support area).
Support Levels:
First support: ₹1,440 – ₹1,448
Next deeper support: ₹1,410 – ₹1,420
Resistance Levels:
Immediate resistance: ₹1,475 – ₹1,485
Strong resistance: ₹1,500 – ₹1,510
Trend Outlook:
Holding above ₹1,448 can trigger a short-term bounce.
Weakness below ₹1,440 may drag it toward ₹1,410.
A close above ₹1,485 would open upside toward ₹1,510+.
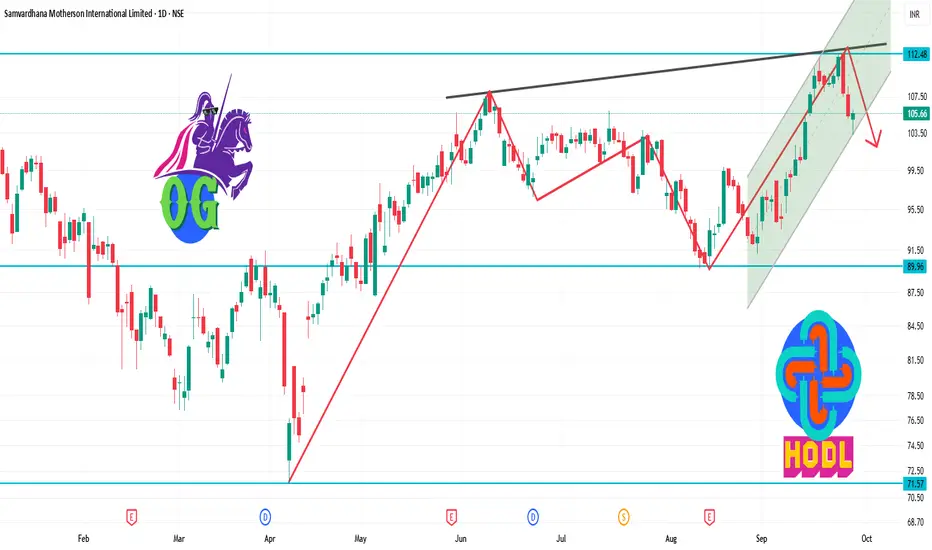
MOTHERSON 1D Time frameStock Snapshot
Closing Price: ₹105.66
Day's Range: ₹103.26 – ₹106.01
52-Week Range: ₹71.50 – ₹144.66
Market Cap: ₹1,11,518 crore
P/E Ratio (TTM): 33.54
P/B Ratio: 3.20
Dividend Yield: 0.80%
Book Value: ₹33.05
Beta: 1.64
Volume: 24,534,407 shares traded
VWAP: ₹104.93
Face Value: ₹1.00
📈 Performance Overview
1-Week Return: -3.14%
1-Month Return: +13.27%
YTD Return: +22.73%
1-Year Return: -11.16%
3-Year Return: +28.45%
5-Year Return: 0.00%
🧾 Financial Highlights
TTM EPS: ₹3.15
Net Sales (Latest Four Quarters): ₹9,271.58 crore
Net Profit (Latest Four Quarters): ₹605.86 crore
Shareholder's Funds: ₹1,676.80 crore
Total Assets: ₹3,089.00 crore
🔍 Technical Insights
Trend: Currently in a downtrend; price below VWAP indicates bearish momentum.
Support Levels: ₹103.26, ₹100.00
Resistance Levels: ₹106.01, ₹110.00
📌 Key Takeaways
Dividend: 50% (₹0.50 per share)
Bonus Issue: 1:2 ratio
Market Position: Strong over 3 years despite short-term volatility
Analyst Sentiment: Positive overall, short-term corrections possible
SENSEX 1D Time frameCurrent Snapshot
Closing / Current Level: ~ ₹ 80,426.46
Day’s Range: High ~ ₹ 81,033, Low ~ ₹ 80,332
Open: ~ ₹ 80,956
⚡ Strategy Thoughts
Bullish approach:
If it recovers above ~80,700 and holds, targets can be 81,000 → 81,300.
Bearish / defensive view:
If Sensex fails near 80,700–81,000, or breaks below ~80,300, downside toward 79,800 and lower comes into play.
Range play:
Between 80,300 and 80,700, you can trade both sides — buy near the bottom of the range, short near resistance — but use tight stops.

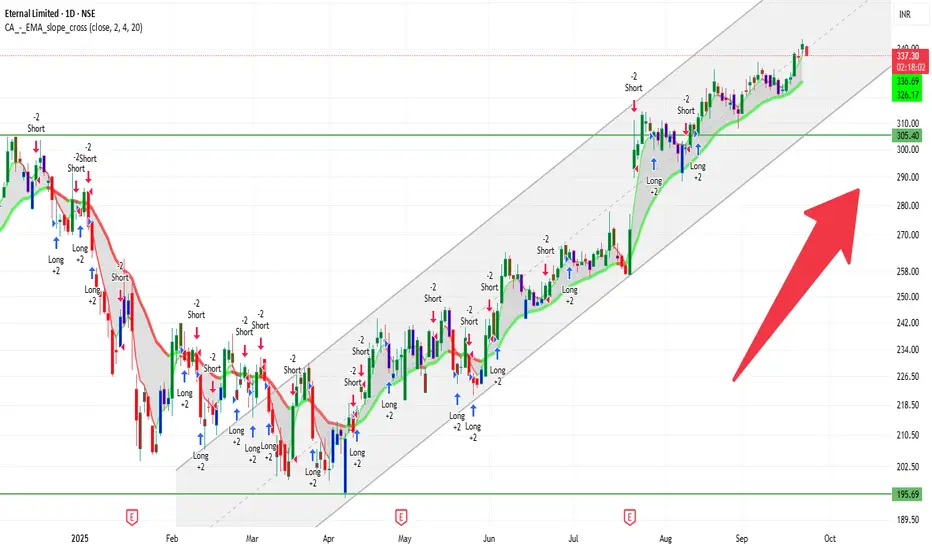
ETERNAL 1D Time frame📍 Today’s Expected Range (Intraday Approximation)
Expected High: ₹341–₹343
Expected Low: ₹336–₹335
These are approximate intraday levels. Actual prices may fluctuate slightly due to volatility.
🔍 Key Points
Current price: ₹337–₹338, trading near the middle of the day’s range.
If price breaks above ₹343 with strong volume → bullish momentum likely.
If price falls below ₹335 → short-term correction or pullback possible.
📊 Suggested Trading Strategy
Bullish Scenario
If Eternal breaks ₹341–₹343, you can buy, targeting ₹348–₹350.
Stop-loss: ₹335
Bearish Scenario
If Eternal drops below ₹335, you can sell/short, targeting ₹330–₹325.
Stop-loss: ₹338
Range-Bound / Sideways
If price trades between ₹335–₹343, it’s better to wait and avoid trading until a clear breakout occurs.
💡 Summary
Resistance Zone: ₹341–₹343
Support Zone: ₹335–₹336
Strategy: Trade in the direction of the breakout, and always use stop-loss to manage risk.
SBIN 1D Time frame📍 Today’s Expected Range (Intraday Approximation)
Expected High: ₹861–₹865
Expected Low: ₹855–₹850
These are approximate intraday levels. Actual prices may fluctuate slightly due to volatility.
🔍 Key Points
Current price: ₹860–₹861, close to resistance.
If price breaks above ₹861–₹865 with strong volume → bullish momentum likely.
If price drops below ₹855–₹850 → short-term correction or pullback possible.
📊 Suggested Trading Strategy
Bullish Scenario
If SBIN breaks ₹861–₹865, you can buy, targeting ₹870–₹875.
Stop-loss: ₹855
Bearish Scenario
If SBIN drops below ₹855, you can sell/short, targeting ₹850–₹845.
Stop-loss: ₹860
Range-Bound / Sideways
If SBIN trades between ₹855–₹861, it’s better to wait and avoid trading until a clear breakout occurs.
💡 Summary
Resistance Zone: ₹861–₹865
Support Zone: ₹855–₹850
Strategy: Trade in the direction of the breakout, and always use stop-loss to manage risk.

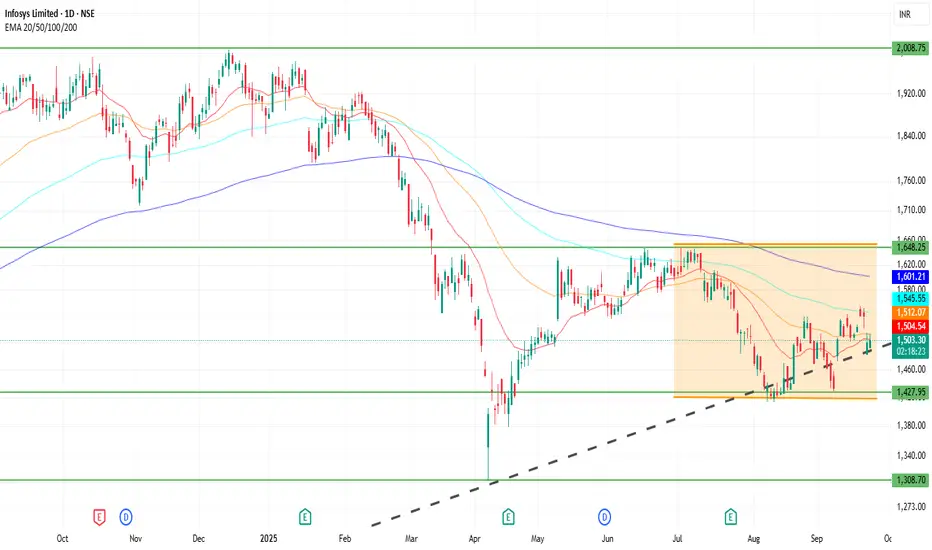
INFY 1D Time frame📍 Current Price & Range
Current Price: ₹1,503.00
Day’s High / Low: ₹1,540.20 / ₹1,499.50
52-week High / Low: ₹2,006.45 / ₹1,307.00
🔍 Key Levels
Immediate Resistance: ₹1,540–₹1,550
Next Resistance: ₹1,600
Immediate Support: ₹1,450–₹1,460
Strong Support: ₹1,400
📊 Indicators & Momentum
Short-term Trend: Neutral to slightly bearish; recent price action shows hesitation near resistance levels.
Volume: Higher-than-average trading volume observed, indicating increased investor interest.
Relative Strength Index (RSI): Approaching overbought territory; caution advised for potential pullbacks.
Moving Averages: Price trading below key moving averages; may act as resistance if price approaches them.
🔮 Possible Scenarios
Bullish Breakout: If INFY sustains above ₹1,550 with strong volume, it could target ₹1,600 and higher levels.
Sideways Consolidation: Price may trade between ₹1,450 and ₹1,550, awaiting a catalyst for direction.
Bearish Reversal: A drop below ₹1,450 could lead to a retest of the 52-week low around ₹1,307.
⚠️ Outlook
At the current level of ₹1,503.00, Infosys is at a critical juncture. A decisive move above ₹1,550 could open up upside potential, while a failure to hold above ₹1,450 may lead to further downside. Monitoring volume and RSI for confirmation is recommended.
KOTAKBANK 1D Time frame🔍 Current Price & Context
Current Price: ₹2,034.10
Day’s Range: ₹2,027.40 – ₹2,054.60
52-Week Range: ₹1,679.05 – ₹2,301.90
Previous Close: ₹2,031.00
Market Cap: ₹4,04,634 Cr
P/E Ratio: 21.10
Dividend Yield: 0.12%
Beta: 0.97
📊 Technical Indicators
Relative Strength Index (RSI): Approximately 49.64, indicating a neutral stance.
MACD: Positive, suggesting bullish momentum.
Moving Averages:
5-Day: ₹2,032.84
50-Day: ₹2,012.95
200-Day: ₹1,984.69
Pivot Points:
S1: ₹2,029.97
Pivot: ₹2,036.07
R1: ₹2,042.17
🧮 Strategy / Trade Ideas
Long Setup:
Entry: Consider entering near support levels (~₹2,020) if bullish reversal signals appear.
Stop Loss: Place below ₹1,980 to manage risk.
Target: First resistance around ₹2,042, then ₹2,070.
Short Setup:
Entry: If price fails to break above resistance (~₹2,042) and shows signs of reversal.
Stop Loss: Above ₹2,080.
Target: Downside toward ₹2,020, then ₹1,990.
