WIPRO 1D Time framw📈 Price Action
Previous Close: ₹255.75
Today's Close: ₹256.50
Daily Range: ₹253.00 – ₹257.00
Volume: 804,499 shares (significantly higher than the 50-day average of 369,496 shares)
52-Week Range: ₹228.00 – ₹324.55
🔧 Technical Indicators
Relative Strength Index (RSI): 63.59 — Indicates bullish momentum.
MACD: Positive — Suggests upward trend.
Moving Averages:
5-day MA: ₹254.50
50-day MA: ₹249.00
200-day MA: ₹265.00
Trend: Bullish, as the stock is trading above short-term moving averages.
Stochastic Oscillator: 76.47% — Indicates overbought conditions, suggesting potential for a pullback.
Average True Range (ATR): ₹0.05 — Indicates low volatility.
📊 Support & Resistance Levels
Immediate Support: ₹253.00
Immediate Resistance: ₹257.00
Pivot Point: ₹255.00
🧠 Trend Analysis
Trend: Bullish
Momentum: Positive
Volatility: Low
Summary: Wipro's stock is exhibiting a bullish trend with positive momentum. The current overbought condition, as indicated by the stochastic oscillator, suggests that the stock may experience a short-term pullback before continuing its upward trajectory. Traders should monitor the support and resistance levels for potential entry and exit points.
SUNPHARMA

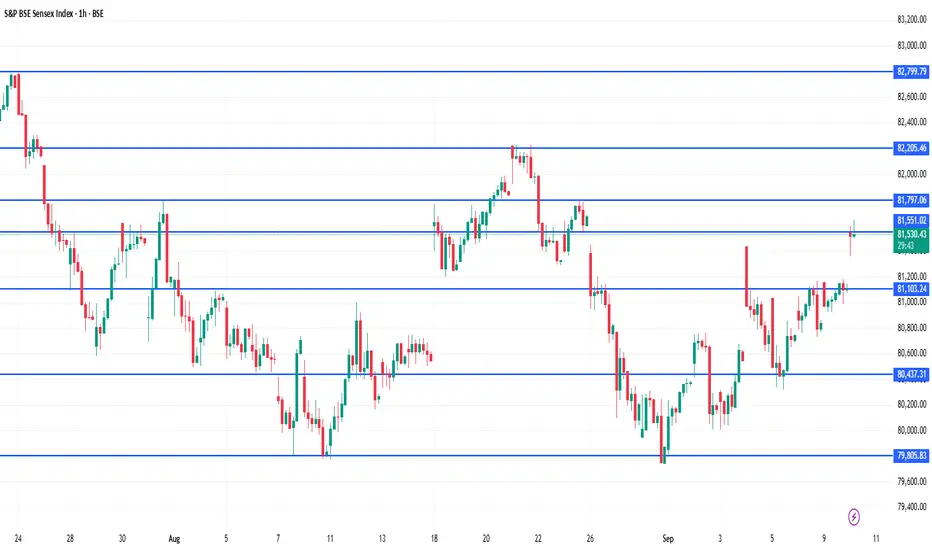
SENSEX 1hour Time frame📍 Sensex – 1H Important Levels (Current)
🔹 Support Zones
74,200 – 74,300 → Immediate intraday support
73,800 – 73,900 → Stronger support zone
73,400 – 73,500 → Major support, breakdown may trigger further downside
🔹 Resistance Zones
74,800 – 74,900 → Immediate 1H resistance
75,200 – 75,300 → Strong resistance; breakout can fuel upside momentum
75,600 – 75,800 → Major resistance; sellers likely to appear here
⚖️ Quick Summary
Bias: Mildly bullish as long as Sensex trades above 74,200.
A breakout above 74,900 may target 75,200 – 75,800.
A breakdown below 73,800 may drag it towards 73,400.
Current range to monitor: 74,200 – 74,900.
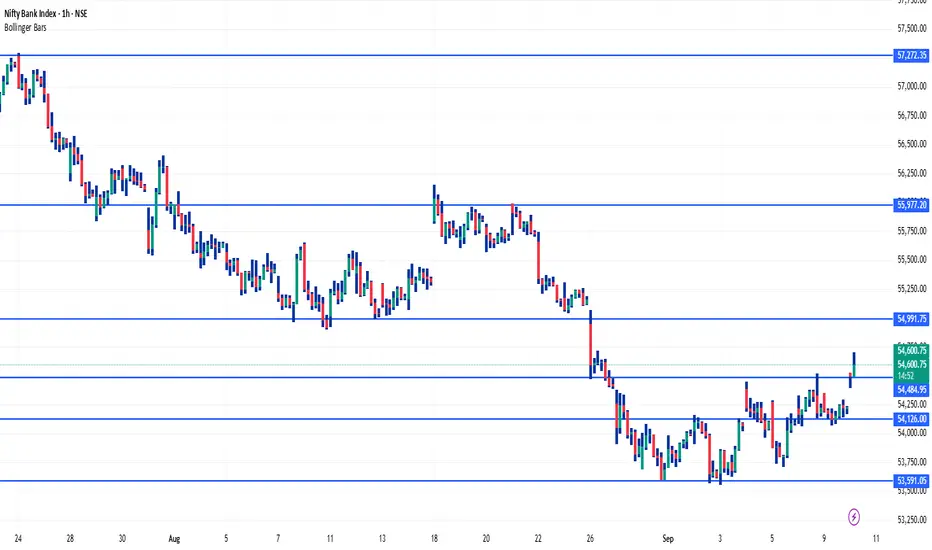
BANKNIFTY 1Hour Time frame📍 Bank Nifty – 1H Important Levels (Current)
🔹 Support Zones
47,800 – 47,900 → Immediate intraday support
47,400 – 47,500 → Strong support; buyers expected to defend here
47,000 – 47,100 → Major support; breakdown here can invite heavy selling
🔹 Resistance Zones
48,400 – 48,500 → Immediate 1H resistance
48,800 – 48,900 → Strong resistance zone
49,200 – 49,300 → Major resistance; breakout here may fuel a rally
⚖️ Quick Summary
Bias: Range-bound with a bullish tilt as long as Bank Nifty trades above 47,800.
Breakout above 48,500 can push towards 48,900 – 49,300.
Breakdown below 47,800 can drag the index to 47,400 – 47,000.
Current watch zone: 47,800 – 48,500.
NIFTY 1H Important Levels 📍 NIFTY – 1H Important Levels
🔹 Support Zones
22,350 – 22,400 → Immediate intraday support
22,200 – 22,250 → Strong support zone
22,000 – 22,050 → Major support; breakdown here may trigger deeper selling
🔹 Resistance Zones
22,600 – 22,650 → Immediate resistance on 1H chart
22,800 – 22,850 → Strong resistance; breakout can push momentum higher
23,000 → Major psychological resistance
⚖️ Quick Summary
Bias: Mildly bullish as long as Nifty trades above 22,350.
Breakout above 22,650 may extend the rally towards 22,850 – 23,000.
Breakdown below 22,350 may drag it towards 22,200 – 22,000.
Current watch zone: 22,350 – 22,650.

Sun Pharma: A Bullish OutlookHello Friends,
Welcome to RK_Chaarts,
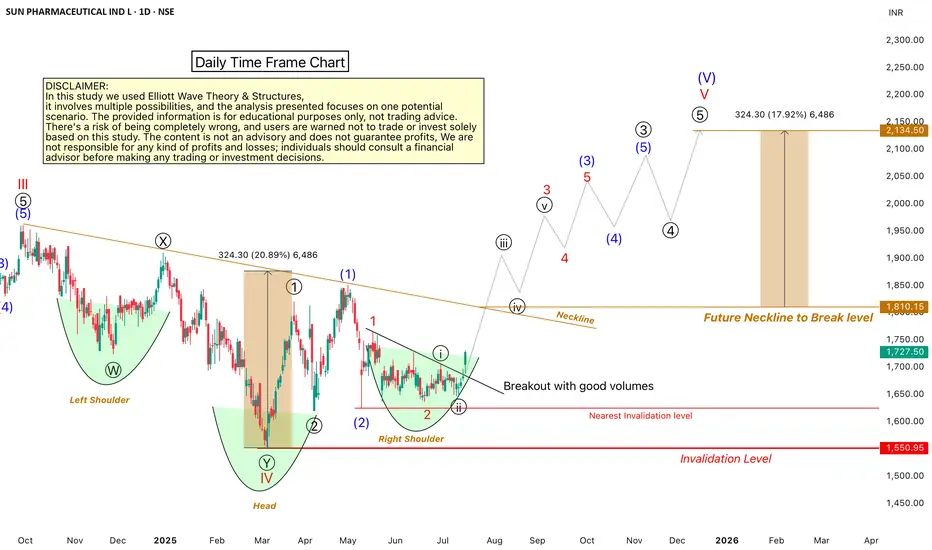
Let's analyze the Sun Pharmaceuticals chart using technical analysis, specifically the Elliott Wave Theory. According to this theory, the September 2024 top marked the end of Wave III cycle degree in red, and the March 2025 bottom marked the end of Wave IV cycle degree in red Now, Wave V of cycle degree in red has begun, which will move upward.
Within Wave V, we should have five sub-divisions of Primary degree in black, with Wave ((1)) & Wave ((2)) already completed. Wave ((3)) has started, with five further sub-divisions of one lower degree intermediate degree, We've marked these in blue, with Wave (1) and Wave (2) completed, and Wave (3) started. Within Wave (3), we have minor degree waves in red, with Wave 1 and Wave 2 completed, and Wave 3 breaking out today with good intensity of volumes.
We can see that the wave counts are super bullish, and so is the RSI, which is above 60. The MACD is also positive, and the price is above the 50-day and 200-day EMAs on the daily and weekly time frames. There's no moving average hurdle, which is another super bullish sign.
We can also see a higher high and higher low formation, which is a bullish sign according to Dow Theory. Additionally, an inverted head and shoulders pattern is forming, with the right shoulder being made. When it breaks out above the neckline, it will give us a target, which aligns with the Elliott Wave Target projection.
All these indicators – technical analysis, price action, and Elliott Wave – point to a bullish trend. However, there's an invalidation level at 1550; if the price falls below this level, our wave counts will be invalidated.
We're projecting targets between 2000-2200 based on Elliott Wave theory projections. Please note that this analysis is for educational purposes only and should not be considered as investment advice.
This post is shared purely for educational purpose & it’s Not a trading advice.
I am not Sebi registered analyst.
My studies are for educational purpose only.
Please Consult your financial advisor before trading or investing.
I am not responsible for any kinds of your profits and your losses.
Most investors treat trading as a hobby because they have a full-time job doing something else.
However, If you treat trading like a business, it will pay you like a business.
If you treat like a hobby, hobbies don't pay, they cost you...!
Hope this post is helpful to community
Thanks
RK💕
Disclaimer and Risk Warning.
The analysis and discussion provided on in.tradingview.com is intended for educational purposes only and should not be relied upon for trading decisions. RK_Chaarts is not an investment adviser and the information provided here should not be taken as professional investment advice. Before buying or selling any investments, securities, or precious metals, it is recommended that you conduct your own due diligence. RK_Chaarts does not share in your profits and will not take responsibility for any losses you may incur. So Please Consult your financial advisor before trading or investing.
(NSE:SUNPHARMA) Inverted H&S Breakout Eyes New ATH Chart Analysis:
Sun Pharma has formed a textbook Inverted Head & Shoulders (H&S) pattern on the daily timeframe, signaling a strong bullish reversal. The pattern completed with a clean breakout above the neckline at ₹1,820 , accompanied by a surge in trading volume (highest in 2 weeks). This validates buyer conviction and sets the stage for a sustained upward move.
Key Levels:
Neckline: ₹1,820
Resistance Targets:
Target 1: ₹1,910
Target 2: ₹1,960 (All-Time High, ATH)
Support Zone:1,750
Trade Setup:
Entry Zone: ₹1,820–1,835 (post-breakout retest opportunity)
Stop Loss: ₹1,750 (below the right shoulder to avoid false breaks)
Why This Works?
✅ Pure Price Action Focus: The analysis relies solely on pattern structure, volume, and key levels—no indicators cluttering the chart.
✅ Volume Confirmation: Breakout supported by above average volume, reinforcing bullish momentum.
✅ Pattern Perfection: Classic Inverted H&S structure with well-defined neckline and symmetry.
✅ Breakout Conviction: Price closed decisively above ₹1,820, indicating strong follow-through.
For Indicator Users:
Traders who incorporate tools like RSI or Moving Averages can cross-verify this setup with their preferred strategies. For instance, the breakout aligns with bullish momentum on higher timeframes.
Risk Management:
Trail stops to lock profits as price approaches ₹1,910.
Partial profit booking at ₹1,910 (T1) recommended.
Conclusion:
Sun Pharma’s breakout above ₹1,820 opens the door for a rally toward its ATH. Pure price action traders can leverage the clean setup, while others may combine it with their preferred indicators. Focus on the neckline (₹1,820–1,835) for potential entries, and maintain strict risk management.
*This analysis is for educational purposes only and does not constitute financial advice, investment recommendation, or an offer to buy/sell securities. Trading involves substantial risk of loss, and past performance is not indicative of future results.

Sun Pharma's Inverse Head and Shoulders: Bullish Setup Ahead!Hello Traders! Today, we’re taking a look at Sun Pharmaceutical and a potential Inverse Head and Shoulders pattern that's setting up on the chart. This pattern is a classic bullish reversal setup that indicates the stock could be gearing up for an upward move, especially if the neckline breakout gets confirmed. The price has already formed the left shoulder , the head , and now we’re watching the right shoulder develop.
Once the neckline breakout happens, we’ll have a solid confirmation of the bullish move. This would give us an opportunity for fresh entries, while those already in the trade can hold their positions with a trailing stop loss . A piercing line candlestick pattern is also forming, showing increased buying interest at the right shoulder , adding more confidence to this setup.
For the entry, keep an eye on the range around 1730-1713 , with a stop loss set at 1684 to protect from unexpected moves. The targets for this trade are 1748 for short-term gains, 1792 for medium-term moves, and the final long-term target of 1587 . If this pattern confirms, we could see a nice rally in Sun Pharma . Let’s stay sharp and manage risk effectively as we watch this pattern unfold!
Disclaimer:- This analysis is for educational purposes only. Please trade responsibly and consult a financial advisor before making any decisions.
If you found this analysis helpful, don’t forget to like, follow, and share your thoughts in the comments below! Your support keeps me motivated to share more insights. Let’s grow and learn together—happy trading!

Sunpharma set up move up another 80-100 point soonSunpharma looks highly bullish with three major technical logic.
its trading above the price with highest volume transaction
its reverse from the fib retracement support
before making the big bullish candle there was a insider bar.
Sl would be around 1700 with target 1900-1950

Long The stock is approximately 56.9% undervalued relative to its intrinsic value of 4,137.50, suggesting a significant buying opportunity at the current price of 1,783.
Based on technical analysis and market trends, a correction to around 1,600 to 1,400 could be an ideal buy zone, offering even greater upside potential for investors looking to enter at a discounted price. However, starting to accumulate shares at 1,783 could still provide a strong entry point for those with a long-term horizon

SPARC | LONG TERM INVESTMENT Hi Traders,
This is SPARC Monthly Chart.
This Best time to invest for long term with small
SL which is 27 Rupees.
I dont follow any fundamental i use only technical analysis
Note - This is only for education purpose

Natco Pharma for 45%+ gainsDate: 21 Nov’24
Symbol: NATCOPHARM
Timeframe: Daily
Natco Pharma currently seems to be in Wave IV of 3 which could end around 1240-1220 and Wave V could then head towards 1800-1900 levels (45%+ from where Wave IV would end) as seen in the chart. A more precise target can be pinned once it makes a fresh ATH. Two levels (1770 & 1900) have been marked as possible supply zone.
The company recently posted good Q2 numbers. The stock is currently trading at a PE multiple of 12.6 while the industry average is around 32.
This is not a prediction but a possible wave count. This is also not a recommendation to trade or invest. Please do your own analysis.
HINGLISH VERSION
Natco Pharma vartamaan mein 3 ke Wave IV mein hai, jo 1240-1220 ke aaspaas samaapt ho sakta hai aur Wave V phir 1800-1900 ke star (45%+ jahaan Wave IV samaapt hoga) kee taraf badh sakta hai, jaisa ki chart mein dekh sakte hain. Ek baar naya ATH banaane par adhik sateek target pin kiya ja sakta hai. Do staron (1770 aur 1900) ko sambhaavit supply zone ke roop mein mark kiya gaya hai.
Company ne haal hee mein achhe Q2 ke numbers post kiye hain. Stock vartamaan mein 12.6 ke PE multiple par kaarobaar kar raha hai jabki industry ka average lagbhag 32 hai.
Yah koee bhavishyavaanee nahin balki sambhaavit Wave count hai. Yah trade lene ya invest karne ki bhi salaah nahi hai. Kripya apana vishleshan svayan karen.

SUNPHARMA - Breakdown?There is tension on the support trendline. However, the price action seems to be weakening.
If a breakdown is witnessed, I expect some correction here in the short term.

Granules India for 35%+ gainsDate: 3 Oct’24
Stock: Granules
Timeframe: Daily chart
Granules India seems to have begun its up move in Wave V of 5 which could end around 810-820 (>35% from current price of 595) as seen in the chart. High volumes and strong reversal of RSI supports this stance.
This is not a trade recommendation. Please do your own analysis.
Aisa lagata hai ki Granules India ne 5 ke Wave V mein apni badhat shuroo kar dee hai, jo 810-820 (595 kee vartamaan keemat se 35%) ke aasapaas samaapt ho sakatee hai, jaisa ki chart mein dekh sakte hain. Achhi volume aur RSI ka majaboot ulataav is rukh ka samarthan karta hai.
Yeh koi vyaapaar ki rai nahin hai. Kripya apna vishleshan khud karein.

BREAKOUT OF BEARISH CHART PATTERNHere inverted cup & handle pattern is formed in daily chart, but you see here breakout has happened of this bearish chart pattern which is god-damn buying signal just like we do buy above red candle high or something because in htf this is a bearish candle.

Sun Pharmaceutical, Bearish - SidewaysThe stock has seen exponential rise since last many months without any intermittent major corrections. The fresh trend lines created have been breached now, and stock seems to have entered into sloping / sideways channel since Feb. Expect to see corrections upto 1300-1250 or upto the trend line which will be healthy for accumulation & gather momentum for future uptrend.

SUNPHARMA F&P BREAKOUTSunpharma breaking f&p continuation pattern
with good volume and rsi
#target 2000
sl 1750
EDUCATIONAL IDEA

SUNPHA likely to touch 1600 soon As 15 min candle closes above 1587, it is very likely to touch T1 of 1600 T2 1610 T3 1630
--- RSI crosses 70
--- Also Helped by good strength of NIFTY PHARMA

SUNPHARMA ready to move up SUNPHARMA after a good consolidation looks for a trend resumption up after spending good time near moving average on the weekly. Expect price to up once it breaches 1540 to test the highs once again and move further up to create new ATHs

SPARC Breaking Channel Formation Above 250Details:
Asset: Sun Pharma Advanced Research Company Ltd (SPARC)
Breakout Level: Above 250
Potential Target: Upside momentum expected
Stop Loss: Below breakout level or as per risk tolerance
Timeframe: Short to medium-term
Rationale: Sun Pharma Advanced Research Company Ltd (SPARC) is showing signs of a potential breakout above the 250 level, breaking out of a channel formation. Sustaining above this level could indicate a bullish sentiment shift and pave the way for a significant upmove.
Market Analysis:
Technical Breakout: Breaking out of the channel formation and sustaining above 250 suggests a technical breakout, potentially attracting buying interest and driving the price higher.
Market Sentiment: Positive market sentiment or company-specific factors may be contributing to the anticipated breakout in SPARC.
Potential Target:
The potential upside target for SPARC is not specified but is expected to be significant if the breakout sustains.
Risk Management:
Implementing a stop loss strategy below the breakout level is essential to manage risk in case of unexpected price reversals.
Timeframe:
The projected upside move for SPARC is based on a short to medium-term outlook, but actual timing may vary based on market conditions.
Risk-Reward Ratio: Consider individual risk tolerance and adjust position size accordingly to maintain a favorable risk-reward ratio.
As with any investment opportunity, conduct thorough analysis and consider factors such as market trends, company fundamentals, and risk management strategies before making trading decisions.

Sun Pharma, Stocks to keep in focus for coming sessions Intraday Stocks to Focus for coming sessions
Sun Pharma is showing consolidation from past few sessions
Momentum can come if decisively sustains outside the Range 1640 to 1580
Keep Tracking Charts
* For Educational purposes
Learn and Practice Price Action Setups

Double Moving Averages Crossover Swing Trade📊 Script: JINDALSTEL
📊 Nifty50 Stock: NO
📊 Sector: Steel
📊 Industry: Steel - Sponge Iron
⏱️ C.M.P 📑💰- 849
🟢 Target 🎯🏆 - 890
⚠️ Stoploss ☠️🚫 - 825
📊 Script: VTL
📊 Nifty50 Stock: NO
📊 Sector: Textiles
📊 Industry: Textiles - Cotton/Blended
⏱️ C.M.P 📑💰- 442
🟢 Target 🎯🏆 - 472
⚠️ Stoploss ☠️🚫 - 425
📊 Script: JSWENERGY
📊 Nifty50 Stock: NO
📊 Sector: Power Generation & Distribution
📊 Industry: Power Generation And Supply
⏱️ C.M.P 📑💰- 528
🟢 Target 🎯🏆 - 561
⚠️ Stoploss ☠️🚫 - 511
📊 Script: NYKAA
📊 Nifty50 Stock: NO
📊 Sector: E-Commerce/App based Aggregator
📊 Industry: Trading
⏱️ C.M.P 📑💰- 161
🟢 Target 🎯🏆 - 173
⚠️ Stoploss ☠️🚫 - 155
📊 Script: SUNPHARMA
📊 Nifty50 Stock: YES
📊 Sector: Pharmaceuticals
📊 Industry: Pharmaceuticals - Indian - Bulk Drugs
⏱️ C.M.P 📑💰- 1620
🟢 Target 🎯🏆 - 1692
⚠️ Stoploss ☠️🚫 - 1590
⚠️ Important: Always maintain your Risk & Reward Ratio.
✅Like and follow to never miss a new idea!✅
Disclaimer: I am not SEBI Registered Advisor. My posts are purely for training and educational purposes.
Eat🍜 Sleep😴 TradingView📈 Repeat 🔁
Happy learning with trading. Cheers!🥂

SUNPHARMA Prediction for Swing Trading SUNPHARMA Prediction for Swing/ Posional Trading
Breakout at entry (1162) level. Entry can be retest in future.
Sls- according to you RRR.
Targets- 1180,1200,1215,1235,1255,1275,1275,1315,1350,… (more will be updated later if need )
According to your “STOMACH” book your profit. Always maintain your risk management.
Watch Carefully – The Chart Explains For Itself.
Disclaimer:
I am not a SEBI Registered Analyst. Anything posted here is my own analysis and views. This is created for educational purposes only. Always consult your Financial Advisor before taking any decision or trade.
Happy trading.
About SUNPHARMA –
Sun Pharmaceutical Industries Ltd. engages in manufacturing, developing, and marketing of pharmaceuticals products. It offers tablets, capsules, injectable, inhalers, ointments, creams, and liquids. The company was founded by Dilip Shantilal Shanghvi in 1983 and is headquartered in Mumbai, India.

How to identify a multibagger stock?Ways to identifty a multibagger and a good stock for positional trade:
The stock should fulfill the following criteria
1.It should be from a booming sector and the broader index should be uptrending
2.The relative strength of the stock to Nifty 50 should be in uptrend
3.RSI should be above 40
4.The stock should be in a stage 2 uptrend structure (breakout with good volumes + consolidation --> breakout with good volumes as shown in the structure of sun pharma)
5.The stock should have low volume consolidation.
Many more examples are there from the realty sector and few from the financial sector and I will be uploading them very soon FOLLOW me to get notified when i upload a new idea
Till then,
Happy Trading :)
