SUN PHARMA Near Key Demand | High-Probability Swing Buy ZoneTimeframe: Daily
Current Spot Price: ~₹1,701
🔍 Technical Structure & Chart Logic
Sun Pharma remains in a broader consolidation with higher-timeframe strength, holding firmly above the 200-DMA (~₹1,649).
The recent decline is a healthy corrective ABC structure:
Wave (a): Initial decline from the recent swing high
Wave (b): Corrective pullback
Wave (c): Decline into the Golden Retracement Zone (50%–61.8%)
The Golden Retracement Zone (₹1,612 – ₹1,698) overlaps with:
Prior demand base
Rising 200-DMA
Breakout retest region
This zone acts as a high-probability accumulation area for swing buyers.
🟢 Swing Trade – Buying Strategy (Cash / Futures)
✅ Best Buying Zone (As per Chart):
₹1,669 – ₹1,682
Secondary accumulation allowed on dips toward ₹1,620–₹1,650
🎯 Swing Targets:
Target 1: ₹1,780
Target 2: ₹1,880
Major Target Zone: ₹1,970 – ₹2,000
🛑 Swing Stop Loss (Strict):
₹1,607 – Daily candle close below
The swing structure remains valid as long as price holds above the golden retracement zone.
🟡 Options Trade – January Expiry Strategy
📌 Directional Bias: Buy-on-dips | Moderately Bullish
▶️ Call Option Setup
Buy: 1700 CE or 1750 CE (January Expiry)
Entry Logic:
Near ₹1,670–₹1,700 on stabilization
OR on strong hourly close above ₹1,720
🎯 Option Targets (Spot-Based):
₹1,780 → partial profit booking
₹1,880 → trail SL
Momentum continuation may extend toward ₹1,970+
🛑 Options Stop Loss:
Spot-based: Hourly close below ₹1,650
OR
35–40% premium stop loss
Prefer ATM / slightly ITM strikes to reduce theta decay risk.
⚠️ Risk & Invalidation Levels
Hourly acceptance below ₹1,650 indicates weakness.
Daily close below ₹1,607 invalidates the bullish swing view.
Below this, price may revisit deeper consolidation supports.
📌 Conclusion
Sun Pharma is testing a textbook golden retracement + 200-DMA confluence zone. This setup favors swing accumulation with defined risk, while January expiry options offer a controlled way to participate in the potential upside.
⚠️ Disclaimer
This analysis is for educational purposes only. I am not a SEBI-registered analyst. Please manage risk responsibly.
Sunpharmalong

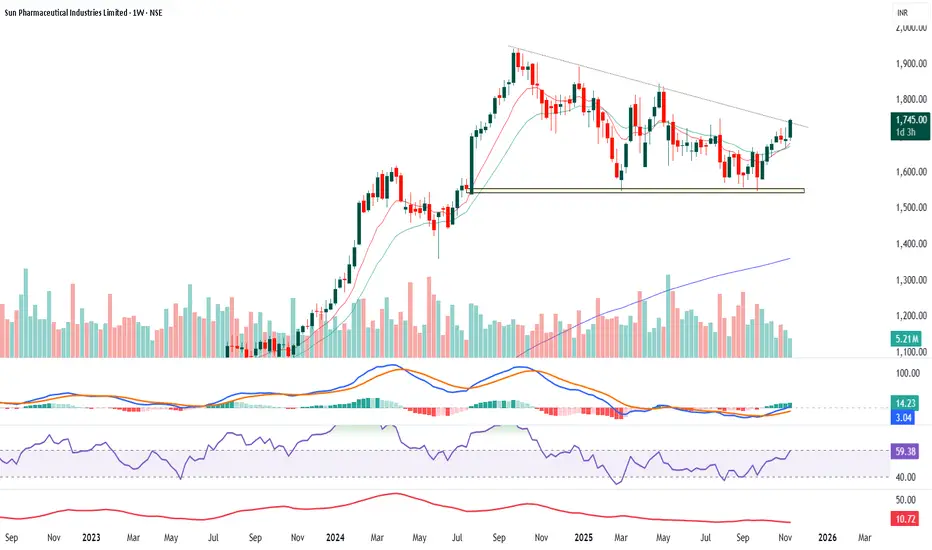
SUNPHARMA - Weekly- LONGA simple and clear analysis of the Sun Pharma weekly chart based on trend, volumes, momentum, RSI, ADX, and chart structure:
Trend: The stock has been in a broad consolidation for many months. It was making lower highs, forming a downward sloping trendline. Now the price is trying to break above that trendline. This shows the first sign that the downtrend may be ending and a fresh upward move may start. The long-term trend is still positive because the price has stayed above the major support zone around 1550–1600.
Chart pattern : The chart is showing a descending trendline with multiple touch points. The stock has bounced strongly from the support zone and is now testing the trendline. A clean breakout above this trendline will confirm a trend reversal.
Volumes: Volumes have been stable but not very strong. However, during recent green candles, volumes have slightly increased, which shows buying interest returning slowly. A breakout with higher volume will give more confidence.
Momentum (MACD)
The MACD has crossed above the signal line, which indicates bullish momentum building up. The histogram turning green also supports the idea that the momentum is improving.
RSI : RSI is around 59, which means the stock is gaining strength but is still not overbought. This is a healthy zone for an early-stage uptrend.
ADX : ADX is around 10, which indicates that the current trend strength is weak. It means the stock was in a range for a long time. As price breaks out and ADX starts rising, the new trend will get stronger.
Overall view : Sun Pharma is showing early signs of a trend reversal. Price is near a trendline breakout, momentum indicators have turned positive, RSI is rising, and the stock is holding a strong support zone. A confirmed breakout above the trendline with good volume can start a fresh upward move.
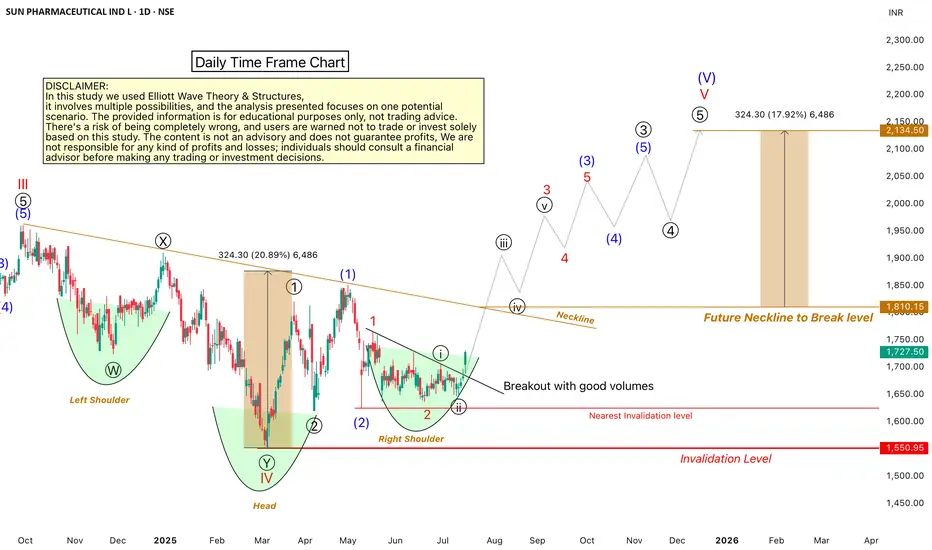
Sun Pharma: A Bullish OutlookHello Friends,
Welcome to RK_Chaarts,
Let's analyze the Sun Pharmaceuticals chart using technical analysis, specifically the Elliott Wave Theory. According to this theory, the September 2024 top marked the end of Wave III cycle degree in red, and the March 2025 bottom marked the end of Wave IV cycle degree in red Now, Wave V of cycle degree in red has begun, which will move upward.
Within Wave V, we should have five sub-divisions of Primary degree in black, with Wave ((1)) & Wave ((2)) already completed. Wave ((3)) has started, with five further sub-divisions of one lower degree intermediate degree, We've marked these in blue, with Wave (1) and Wave (2) completed, and Wave (3) started. Within Wave (3), we have minor degree waves in red, with Wave 1 and Wave 2 completed, and Wave 3 breaking out today with good intensity of volumes.
We can see that the wave counts are super bullish, and so is the RSI, which is above 60. The MACD is also positive, and the price is above the 50-day and 200-day EMAs on the daily and weekly time frames. There's no moving average hurdle, which is another super bullish sign.
We can also see a higher high and higher low formation, which is a bullish sign according to Dow Theory. Additionally, an inverted head and shoulders pattern is forming, with the right shoulder being made. When it breaks out above the neckline, it will give us a target, which aligns with the Elliott Wave Target projection.
All these indicators – technical analysis, price action, and Elliott Wave – point to a bullish trend. However, there's an invalidation level at 1550; if the price falls below this level, our wave counts will be invalidated.
We're projecting targets between 2000-2200 based on Elliott Wave theory projections. Please note that this analysis is for educational purposes only and should not be considered as investment advice.
This post is shared purely for educational purpose & it’s Not a trading advice.
I am not Sebi registered analyst.
My studies are for educational purpose only.
Please Consult your financial advisor before trading or investing.
I am not responsible for any kinds of your profits and your losses.
Most investors treat trading as a hobby because they have a full-time job doing something else.
However, If you treat trading like a business, it will pay you like a business.
If you treat like a hobby, hobbies don't pay, they cost you...!
Hope this post is helpful to community
Thanks
RK💕
Disclaimer and Risk Warning.
The analysis and discussion provided on in.tradingview.com is intended for educational purposes only and should not be relied upon for trading decisions. RK_Chaarts is not an investment adviser and the information provided here should not be taken as professional investment advice. Before buying or selling any investments, securities, or precious metals, it is recommended that you conduct your own due diligence. RK_Chaarts does not share in your profits and will not take responsibility for any losses you may incur. So Please Consult your financial advisor before trading or investing.
Sunpharma set up move up another 80-100 point soonSunpharma looks highly bullish with three major technical logic.
its trading above the price with highest volume transaction
its reverse from the fib retracement support
before making the big bullish candle there was a insider bar.
Sl would be around 1700 with target 1900-1950

SPARC | LONG TERM INVESTMENT Hi Traders,
This is SPARC Monthly Chart.
This Best time to invest for long term with small
SL which is 27 Rupees.
I dont follow any fundamental i use only technical analysis
Note - This is only for education purpose

SUNPHARMA ready to move up SUNPHARMA after a good consolidation looks for a trend resumption up after spending good time near moving average on the weekly. Expect price to up once it breaches 1540 to test the highs once again and move further up to create new ATHs

SUNPHARMA Prediction for Swing Trading SUNPHARMA Prediction for Swing/ Posional Trading
Breakout at entry (1162) level. Entry can be retest in future.
Sls- according to you RRR.
Targets- 1180,1200,1215,1235,1255,1275,1275,1315,1350,… (more will be updated later if need )
According to your “STOMACH” book your profit. Always maintain your risk management.
Watch Carefully – The Chart Explains For Itself.
Disclaimer:
I am not a SEBI Registered Analyst. Anything posted here is my own analysis and views. This is created for educational purposes only. Always consult your Financial Advisor before taking any decision or trade.
Happy trading.
About SUNPHARMA –
Sun Pharmaceutical Industries Ltd. engages in manufacturing, developing, and marketing of pharmaceuticals products. It offers tablets, capsules, injectable, inhalers, ointments, creams, and liquids. The company was founded by Dilip Shantilal Shanghvi in 1983 and is headquartered in Mumbai, India.

Swing Trade Opportunity in SUNPHARMARefer the chart for Entry,Target and SL.
NOTE: This trade is only for Equity Swing buy and not to be considered for options trading.
Please do follow Position Sizing and Risk Reward Ratio while planning any trades.
Note: This information is for education purpose only and please do your own research and consult your financial advisor prior to taking any action.
TO CONNECT WITH ME CHECK OUT MY BIO.
If you like this Idea, Please do like my ideas and share it with your friends. check my bio.
Please boost my ideas and send cheers as it acts as a motivation to keep posting my analysis.

Sunpharma Price ActionBuy Sunpharma If Any Weekly Close Above 1105
SL - 1063 ( Weekly Closing Basis )
Target - Open

Sun Pharma - 5 Point VCP setup to conquer 1070+Here are the key things to see in this setup - and why its picture perfect
Volatility compression before launch from 1000 - classic Minervini style VCP
Higher volumes on the push off from 1000
Momentum on daily turning positive
Earning coming up- obviously people in the know are in
Relentless buying above 1020 - absolutely no pull backs
Go long with caution as this has taken off. But a gorgeous setups like this are rare indeed - even if you dont buy, keep track of it.
Dont chase - buy pullbacks to the 21 ema only

Swing Trading Opportunity in Sun PharmaOn the daily timeframe chart of Sun Pharmaceutical, the price is approaching a resistance zone that has been tested multiple times. As this resistance has been tested multiple times, it may be considered a weak resistance. If the price gives a strong breakout above this resistance zone, it could present a great opportunity to take a swing trade.
For entry, we can go long after a breakout of a strong bullish candle above the resistance zone. It is advisable to initially enter with half quantity, as most breakouts tend to fail. After the breakout, when the price pulls back to the flip zone to take support and then starts moving in the direction of the breakout, we can add the other half quantity. Sometimes, the price doesn't pull back, which is why we enter the trade with half quantity after the breakout candle closes.
Regarding the stop loss, we can keep it below the resistance zone with some buffer.
We can set the target near the all-time high, as it may provide a significant resistance level and a potential area of profit-taking for traders. However, it is important to note that we should also monitor the price action closely and adjust our target accordingly if we see any signs of weakness or reversal in the trend.
If you enjoyed this content, please consider giving it a like and following me for more updates on market analysis and trading strategies. Your support is greatly appreciated!

Head and Shoulder in Sun Pharma (09/05/23)Perfect Head and shoulder break down can be there in the Sun Pharma stock. It is trading around the neck line.
Sun Pharma is in the sell zone, as the market has retest the recent 50% fib levels.
This stock never fails to respect the fibonacci levels.
It has been consolidating and on the daily charts it has formed a gravestone doji. Stock is near it 200 DMA and if it breaks down below the zone the moving average will also be passed.
Stop loss and target levels are provided in the chart itself.
Wait for the price action near the price levels before entering the markets.

SUNPHARMA - Pullback in long term uptrend now complete
Consolidation below highs over. Turning back on the daily charts as well as weekly charts
Bull trend on weekly charts started in 2020 - and the past 2 months were a longer term pull back in this bull trend
Stop Loss - 950 which is the median of the level at which consolidation started
Price Target - 1050 which was the previous high
Low Risk / Higher Probability Trade - Sell 1000 - 950 put spread and collect theta. IV at 24% is decently high for this stock
Higher Risk Trade - Buy 1000 - 1050 call spreads and close them when the stock gets to 1030 or so
Disclaimer & imp rules
* These are merely ideas and not a recommendation to take a trade
* Trade small size & keep a wide stop loss (atleast 1.5 ATR). Dont fall into the trap of tight stop losses & big positions
* Be patient when in the trade - the stock doesnt know you or care about your feelings.
* Be ruthless with cutting trades that hit your stop
* Be patient & wait for trades to come to you. Do not chase stocks - that only ends in disaster

MULTIPLE BULLISH PATTERNS IN SUNPHARMAOn Daily TF Bullish Divergence in RSI
Bullish Piercing Candle on daily TF
NR 7 pattern in Daily TF
Sun Pharma on Breakout Retest Zone

SUNPHARMA FORMS CUP AND HANDLEIn daily TF trendline broken
at retest zone of breakout
Cup and Handle in 15min

Sun Pharma Swing TradeSun Pharma is near Support Zone on daily chart. It is Good Opportunity to take Swing Trade
Entry
We can go long on next candle open.
Target
We can keep target near the next resistance zone as marked on chart.
Stoploss
We can keep the stoploss below the support zone.
Please like and follow me.

SUNPHARMA | Near 7Yr Resistance| Rocket Abv 1080 | 70% UpsideNSE:SUNPHARMA
7 month Consolidation between 800 - 940 & recently Breakout from Ascending Triangle
Price approaching 7 Year Resistance zone of 1070 - 1080.
Breakout above the resistance zone will make Sunpharma a Rocket.
Short Term Target : 1070
Long Term Target : 1542 - 1831
Upside : 50%-70%
SL : 880
Rising in Channel since March 2020 and Taking support from 20 & 50 Week EMA
RSI is consistently in Bullish Zone

SUNPHARMA - Ichimoku Bullish Breakout Stock Name - Sun Pharmaceuticals Industries Limited
Ichimoku Cloud Setup :
1). Today's close is above the Conversion Line
2). Future Kumo is Turning Bullish
3). Chikou span is slanting upwards
All these parameters are showing bullishness at Current Market Price
and more bullishness AFTER crossing 1015
#This is not Buy and Sell recommendation to any one. This is for education purpose and a helping hand to learn trading in Market.
# Cloud Trading
# Ichimoku Cloud
# Ichimoku Followers
I hope you all like my analysis.
Please do share your thoughts into comment section.
Please give a like, it motivates me to do analysis.

SUN PHARMA | BIG UPSIDE ABOVE 970Sun Pharma in bullish momentum and big upside targets will open if sustains above 970.
To motivate us, Please like the idea If you agree with the analysis.
Happy Trading!
InvestPro India Team

Sunpharma On HnS Patternlooking like after a long consolidation the scrip is papering to hit 1100. Keep the stock in radar and trade well.

Sunpharma might form a new high (26/09/22).Sunpharma on the weekly time frame has given a nice bullish engulfing candle and a nice 6% return this week.
The market has given a negative return but this stock has remained in green.
There is possibility of another up move in the coming week and the stock may form new 52 week high.
It is following the market movement. It has broken the resistance level of 900 and retest the levels.
Three points confirmation for a trade
1. Crossed 20 ema on the daily time frame.
2. Closing above the resistance level, high volume break out and closing above 200 ema on weekly time frame.
3. Candlestick pattern :- Bullish engulfing pattern.
If the stock breaks and closes above the levels of 925 on the daily time frame, a trade can be initiated.
Targets :- 940-45, 950
Wait for the stock price to cross the level. Watch for the price action near the levels before entering the trade.
A swing or intraday trades can be taken in the stock.

Sunpharma, pole & flag patternThe scrip is in a flag on a pole patten. if we see bounce from this level we may see good up-move.
keep In radar

Sun Pharma preparing for blast About to complete Cup & handle
Reversing after 50% retracement of previous rally.
HH pattern on Weekly chart
Cup Pattern on Monthly chart
Buying Zone - 870-880, SL 860 on daily closing basis
