Oil Supply and Demand Balances1. Understanding Oil Supply
Oil supply refers to the total quantity of crude oil and petroleum products available for consumption at a given time. It can be categorized into several sources:
a) Crude Oil Production:
Crude oil production is the primary component of oil supply and is influenced by geological availability, technological capabilities, investment in exploration, and political factors. Major oil-producing countries such as Saudi Arabia, the United States, Russia, and members of the Organization of Petroleum Exporting Countries (OPEC) play a pivotal role in global production levels.
b) Inventories and Stockpiles:
Strategic and commercial oil reserves contribute to supply. Strategic reserves are maintained by governments to stabilize domestic markets in times of disruption, while commercial stockpiles are held by oil companies to meet demand fluctuations. Changes in inventory levels can signal either oversupply or shortages, impacting market prices.
c) Refinery Output:
Oil supply also depends on the capacity of refineries to process crude oil into usable products such as gasoline, diesel, jet fuel, and heating oil. Refinery utilization rates, maintenance schedules, and technological improvements can affect the amount of refined products available in the market.
d) Geopolitical Factors:
Supply is highly sensitive to geopolitical events. Conflicts in oil-producing regions, sanctions, or trade restrictions can constrain supply, while agreements among producers to cut or increase output (such as OPEC+ decisions) directly influence global supply levels.
e) Technological Advances and Unconventional Sources:
The development of unconventional sources, such as shale oil and oil sands, has significantly expanded supply options. Advances in hydraulic fracturing and horizontal drilling, particularly in the U.S., have shifted the global supply landscape by increasing production flexibility.
2. Understanding Oil Demand
Oil demand represents the quantity of crude oil and petroleum products that consumers are willing and able to purchase at prevailing prices. It is shaped by multiple factors:
a) Economic Activity:
Oil is a critical input for industrial production, transportation, and power generation. Economic growth drives higher energy consumption, especially in emerging economies such as China and India, which have rapidly growing industrial sectors and expanding transportation networks.
b) Transportation Sector:
The transportation sector accounts for the largest portion of oil demand. Demand for gasoline, diesel, and jet fuel is highly correlated with vehicle ownership, freight movement, and air travel. Shifts toward electric vehicles and public transportation can gradually reduce oil demand growth.
c) Seasonal Variations:
Oil demand fluctuates seasonally. For example, gasoline consumption typically rises during the summer driving season, while heating oil demand peaks in winter in colder regions. These seasonal patterns create temporary imbalances in supply and demand.
d) Energy Policy and Substitutes:
Government policies, such as fuel efficiency standards, carbon taxes, and subsidies for renewable energy, can affect oil demand. Increased adoption of alternative energy sources, biofuels, and electric mobility reduces reliance on oil and shifts the demand curve downward.
e) Population Growth and Urbanization:
Long-term oil demand trends are influenced by population growth and urbanization. Growing populations increase energy consumption, while urbanization often leads to higher transportation fuel usage, expanding the overall demand for oil.
3. Balancing Supply and Demand
The balance between oil supply and demand is crucial for maintaining price stability. When supply exceeds demand, inventories build up, leading to falling prices. Conversely, when demand outstrips supply, inventories decline, creating upward pressure on prices. This balance can be analyzed in several ways:
a) Global Oil Market Equilibrium:
Oil markets aim to reach an equilibrium where the quantity supplied matches the quantity demanded at a certain price. This equilibrium is rarely static due to continuous changes in production, consumption patterns, and external shocks.
b) Short-term vs Long-term Balances:
Short-term balances are influenced by seasonal fluctuations, weather events, refinery outages, and geopolitical crises. For instance, hurricanes in the Gulf of Mexico can temporarily disrupt U.S. production, tightening supply and pushing prices higher.
Long-term balances are determined by structural factors such as new oil field developments, technological innovation, energy transitions, and long-term economic growth trends.
c) Market Signals:
Oil prices serve as a signal for both producers and consumers. High prices incentivize increased production and energy efficiency, while low prices can reduce exploration investment and promote consumption. Futures markets also reflect expectations about future supply-demand balances.
4. Factors Disrupting the Balance
Oil supply-demand balances are highly sensitive and prone to disruption. Key disruptive factors include:
Geopolitical Tensions: Wars, sanctions, and political instability in oil-producing regions can reduce supply unpredictably.
Natural Disasters: Hurricanes, earthquakes, and other natural events can damage infrastructure, affecting both production and transportation.
Technological Changes: Breakthroughs in extraction or renewable energy can shift the balance. For example, the shale revolution dramatically increased U.S. oil production.
Economic Shocks: Global recessions reduce industrial activity and transportation, causing oil demand to fall sharply.
Policy Shifts: Regulatory changes, carbon pricing, and subsidies for alternative energy can either suppress or stimulate oil consumption.
5. Measurement of Supply-Demand Balances
Organizations such as the International Energy Agency (IEA), U.S. Energy Information Administration (EIA), and OPEC regularly monitor oil supply-demand balances. Key metrics include:
Supply Figures: Crude oil production, refinery output, and stock changes.
Demand Estimates: Consumption data across sectors and regions, including transportation, industrial, residential, and power generation.
Inventory Levels: Changes in crude and product stocks, signaling tightness or oversupply in the market.
Market Indicators: Futures prices, backwardation/contango structures, and spreads between crude grades.
These metrics allow analysts to forecast potential shortages or surpluses and anticipate price trends.
6. Implications for the Oil Market
The supply-demand balance has profound implications:
Price Volatility: Imbalances lead to sharp fluctuations in oil prices, affecting energy costs globally.
Investment Decisions: Producers rely on supply-demand forecasts to plan new exploration, production, and refining capacity.
Policy Formulation: Governments monitor the balance to ensure energy security, manage strategic reserves, and design energy policies.
Global Economic Impact: Oil prices influence inflation, trade balances, and economic growth worldwide. Surplus supply tends to lower prices, benefiting consumers, while shortages raise prices and strain economies.
7. Future Trends in Supply-Demand Balances
Several emerging trends are reshaping oil supply-demand dynamics:
Energy Transition: Shift toward renewables, electric vehicles, and energy efficiency may reduce long-term oil demand growth.
Peak Oil Demand: Some analysts project a peak in global oil demand in the next few decades, driven by technological innovation and policy shifts.
Geopolitical Realignments: Changes in OPEC+ strategies and new producers entering the market will influence future supply levels.
Climate Policies: Decarbonization commitments and emission reduction targets are likely to constrain fossil fuel consumption.
Conclusion
Oil supply and demand balances form the foundation of global energy markets. Supply is shaped by production levels, inventories, refinery capacity, technology, and geopolitics, while demand is influenced by economic activity, transportation, policies, population growth, and energy alternatives. Maintaining equilibrium is critical for price stability and economic planning. Disruptions in either supply or demand can lead to volatility, affecting markets worldwide. As the world moves toward cleaner energy sources, the dynamics of oil supply-demand balances will continue to evolve, making careful monitoring and analysis increasingly vital for stakeholders across the energy sector.
Supplyanddemmand

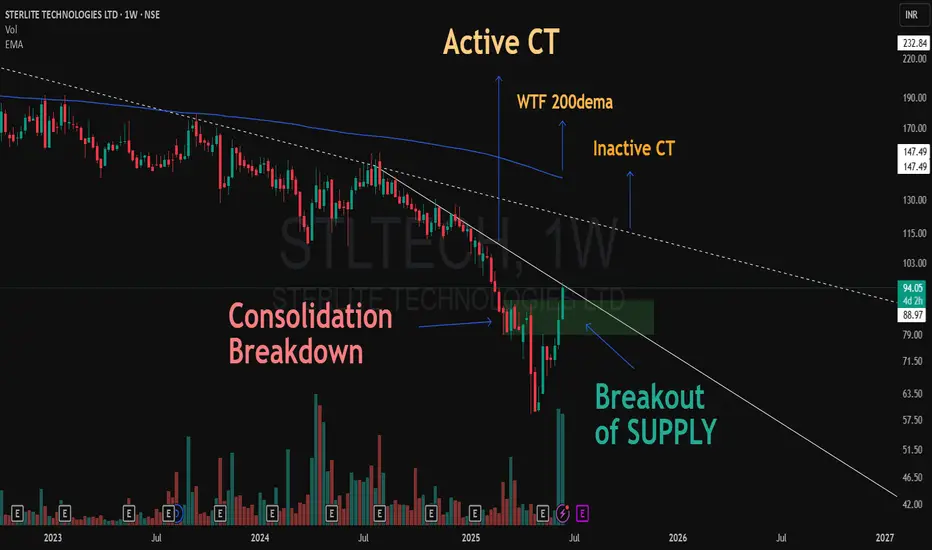
From Breakdown to Breakout: A V-Shaped Surprise!This chart of Sterlite Technologies (W1) tells a compelling price action story:
📉 The stock initially consolidated at a demand zone, only to break down sharply, flipping that zone into a fresh supply area.
💥 What followed was a strong V-shaped recovery, accompanied by significant volume expansion.
🚀 The reclaimed supply zone was decisively taken out, leading price right into the Active Counter Trendline (CT).
🔁 This Active CT now stands as a key structure; the stock needs to form a higher low near the reclaimed demand zone for structural strength.
⚠️ Ahead, we have two higher-timeframe resistances in sight:
📏 An Inactive Weekly CT (dotted)
📡 The WTF 200 DEMA, a major trend filter
While this is not a call or forecast, the shift in structure, volume, and reclaiming of supply tells a story of possible trend transition — something worth keeping on the radar.
HOW-TO: Use Demand and Supply Zones Pro [Afnan] As Screener In this video, I walks you through an exciting update to the Demand and Supply Zones Pro Indicator—integration with TradingView’s Pine Screener. This powerful tool allows traders to scan stocks based on demand and supply zones, helping to streamline your trading process and increase your efficiency.
Key Highlights:
Learn how to set up the Pine Screener for scanning stocks from your watchlist based on demand and supply zones.
A step-by-step guide to creating and using a Nifty 200 Watchlist.
Setting up Demand and Supply Zones Pro with custom timeframe and alert configurations.
How the screener analyzes stocks, focusing on demand and supply zone proximity and key price levels.
Understanding the columns in the Pine Screener and how to interpret them for your trades.
This screener is available exclusively to Premium and higher TradingView plans, so ensure your account is upgraded to take advantage of this feature.

MAKE OR BREAK LEVELS IN BANKNIFTY - 12TH SEPTEMBER NSE:BANKNIFTY ANALYSIS FOR TOMORROW 🔺
❇️ IMPORTANT LEVELS 🚀
❇️ Support: 50950-50780-50580.
❇️ Resistance : 501380-51450-51605-51725.
👉🏻 PURPLE LINE : 51165 is a key level, above buying, Below selling.
👉🏻 @thetradeforecast 🇮🇳


Swing Trade opportunity in AFFLESwing Trade opportunity in AFFLE.
Entry - 920
Target - 1020
DISCLAIMER: I am not SEBI registered and the ideas posted are only for educational purpose. Always trade with proper STOPLOSS.

LTIMINDTREE - AnalysisThe key levels for LTIMINDTREE are as follows.
The move is already in progress.
Buy - 4680
Target - 4830

INFY - AnalysisThe key levels for INFY are as follows.
The move is ready to take off.
Buy - 1247
Target - 1365

RELIANCE - AnalysisThe key levels for RELIANCE are as follows.
The move is Just started.
Buy - 2482
Target - 2600

LT - AnalysisThe key levels for LT are as follows.
The move is just started.
Buy - 2227
Target - 2266

IS #JUSTDIAL READY FOR U TURN??Trade Wisely. We Can Just Predict.
Disclaimer: I am not a SEBI registered advisor , so before entering on my view please ask your SEBI Registered Advisor . Profit is your and loss is your.
If you love my analysis Like And Share wherever you want..

WILL #INSECTICIDESINDIA BOUNCE FROM LINE OF CONTROL??Trade Wisely. We Can Just Predict.
Disclaimer: I am not a SEBI registered advisor , so before entering on my view please ask your SEBI Registered Advisor . Profit is your and loss is your.

WILL #INDUSINDBANK MAKE OR BREAK CRUCIAL MOVING AVERAGE ZONES??Trade Wisely. We Can Just Predict.
Disclaimer: I am not a SEBI registered advisor , so before entering on my view please ask your SEBI Registered Advisor . Profit is your and loss is your.
If you love my analysis Like And Share wherever you want..

WILL #CIPLA BOUNCE FROM CRUCIAL ZONE??Trade Wisely. We Can Just Predict.
Disclaimer: I am not a SEBI registered advisor , so before entering on my view please ask your SEBI Registered Advisor . Profit is your and loss is your.
If you love my analysis Like And Share wherever you want..

WILL LAURUSLABS BREAK ITS JINK OF DOWNTREND??Trade Wisely. We Can Just Predict.
Disclaimer: I am not a SEBI registered advisor , so before entering on my view please ask your SEBI Registered Advisor . Profit is your and loss is your.

WILL BSE RESPECT ITS PREVIOUS HIGH ZONE??Trade Wisely. We Can Just Predict.
Disclaimer: I am not a SEBI registered advisor , so before entering on my view please ask your SEBI Registered Advisor . Profit is your and loss is your.

WILL #LODHA COME OUT OF OVERSOLD ZONE?? Trade Wisely. We Can Just Predict.
Disclaimer: I am not a SEBI registered advisor , so before entering on my view please ask your SEBI Registered Advisor . Profit is your and loss is your.

#GMRINFRA MONTHLY STRUCTURETrade Or Invest Wisely.
We Can Just Predict.
Disclaimer: I am not a SEBI registered advisor, so before entering on my view please ask your SEBI registered advisor. Profit is your and loss is yours.
Please like and share if you agree with the idea.

IRCTC: Cup and handle pattern BREAKOUT
Monopoly in the sector.
Strong Fundamentals with good ROE.
Cup & Handle formation is complete.
The price is above 50 and 200 MA.
Handle breakout is seen, however, there is an immediate STRONG SUPPLY ZONE (acting as resistance) just above the Handle region.
This STRONG SUPPLY zone has been broken today with a gap-up opening indicating bullish momentum.
Stoploss has been marked in Orange.
Two Target Price/Take Profit level has been marked in Red lines.

KIRLOSENG | Channel breakout - Looks potential for 30%KIRLOSENG | Channel breakout - Looks potential for 30%
CMP : 177 (Dip : 170)
SL : 155
Target : 220
1:4 risk reward setup

Sigachi is ready for a ride?Sigachi has been trading near its resistance level, with a high volume for the day. If it closes above this level, in the next few sessions there is a good chance for it to reach 330 levels.
DYOR

DIXON | Comfortable breakout - Looks potential for 20%DIXON | Comfortable breakout - Looks potential for 20%
CMP : 4630
SL : 4350
Target : 5700
Almost 1:4 risk reward setup

STERTOOLS | Simple channel breakout - Looks potential for 60%STERTOOLS | Simple channel breakout - Looks potential for 60%
CMP : 269 (Dip : 250)
SL : 225
Target : 350, 440
1:5 risk reward setup for first target
