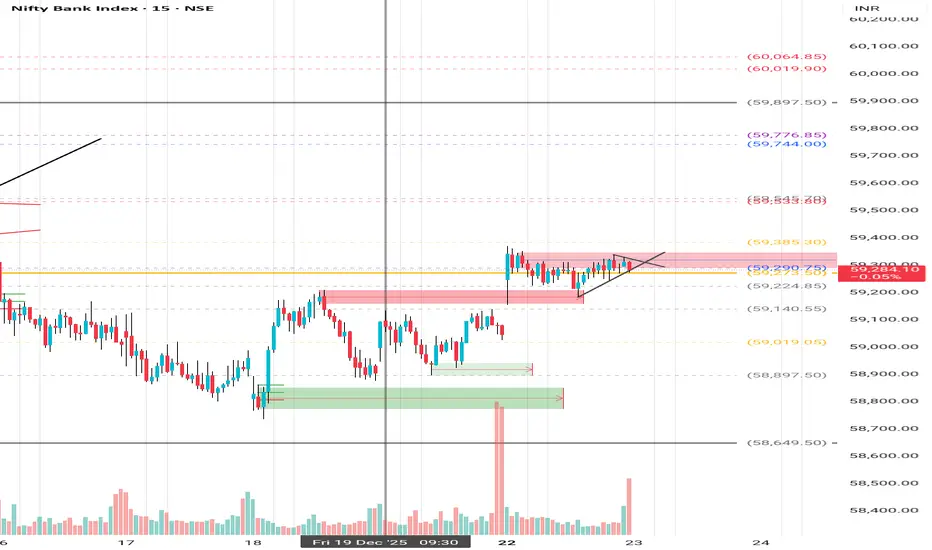
Bank Nifty - 23rd December Levels with TrendLines Bank Nifty – 23rd December Levels with Trendlines
Yesterday, only supply was created.
On Friday, that supply turned into demand.
If the market opens with a gap-up, then 23rd December supply will act as demand.
Check my Fibonacci levels – they are the most important for understanding the overall monthly direction.
Supplyandemandzones
UltraTech Cement: Bullish Setup at Major Demand ConfluenceWe are analyzing UltraTech Cement across multiple timeframes as it approaches a high-probability reversal area. Here is the breakdown:
1️⃣ Quarterly Timeframe (Location)
Status: Price is currently approaching a Quarterly Demand Zone.
View: We are treating this as a key "Location" for our trade setup. Since the price is correcting from its Lifetime High , this zone is significant enough to absorb incoming selling pressure and hold the price.
2️⃣ Monthly Timeframe (Trend Origin)
Status: Price is testing the Monthly Demand Zone.
Confluence: This zone perfectly coincides (overlaps) with the Quarterly Demand Zone.
Significance: This acts as a strong support because the massive rally that led to the previous Lifetime High originated right from this level.
3️⃣ Weekly Timeframe (The Setup)
Status: Price is approaching a refined Weekly Demand Zone.
Strength: This is a high-probability zone because it has triple confluence: it coincides with both the Monthly and Quarterly zones.
Support: There is also a Monthly EMA resting in this area, adding extra strength to the zone.
Outlook: If price enters this zone, we expect a strong upmove. There are no major higher-timeframe supply zones overhead to block the momentum.
🛡️ Plan B: The Safety Net
Secondary Zone: In the unlikely event that our primary weekly zone breaks, we are not out of the fight.
Fresh & Untested: Just below the current level, there is another fresh demand zone that has never been tested before.
Opportunity: Because it is "fresh," there are likely unfilled pending buy orders sitting there, ready to trigger a strong reaction and push prices back up.
🎯 Verdict: A solid long setup forming at a high-value location with momentum expected to resume toward highs.

CERA – Demand Zone Confluence Supporting Bullish OutlookCERA has exhibited a notable price reaction from its Quarterly Demand Zone 📊, where price absorbed existing buy orders and initiated an upward movement 🚀. This reaction area coincides with the Yearly Demand Zone 🧭, thereby forming a strong confluence zone 🔗 that reinforces its structural significance.
On the Monthly timeframe 📅 , the active Demand Zone overlaps both the Monthly and Yearly Demand Zones . Such multi‑timeframe alignment ⚙️ typically represents a high‑probability support region 💪. Following the initial reaction from this area, price demonstrated a sustained upward move 📈 and established a new, untested Monthly Demand Zone 🟩.
Currently, the price is retracing toward this newly‑formed Monthly Demand Zone 🔄. The retracement is particularly significant because it occurs without any observable reaction from a higher‑timeframe supply zone 🚫🏗️. This suggests that the zone’s underlying demand remains intact 💼, and that the market is approaching an area of potential accumulation 🏦.
Additionally, the Weekly chart 📅 reveals that the current zone coincides with a Monthly Demand Zone 🧱, providing further confirmation of institutional-level support 🏛️. Overall, the technical setup indicates a favorable environment for a potential bullish reversal or continuation from this demand area 🔥📈.
📌 Conclusion
CERA is currently positioned within a multi‑layered structural support zone 🧱 that reflects strong institutional interest and demand alignment across timeframes. The fresh Monthly Demand Zone, combined with Yearly and Quarterly confluence, strengthens the bullish bias.
Unless price invalidates the zone through a sharp breakdown with high volume, the technical structure remains biased to the upside 🚀, favoring long accumulation setups and positioning this level as a potential launchpad for the next impulsive move 💫

Nifty 50 Hits Major Supply Zone After Trendline & VCP Breakout!Today, we're diving deep into the Nifty 50 chart, which is painting a very interesting picture. After a significant downturn, the bulls have been patiently and persistently fighting back. We've seen the index respect several supply zones in the past, leading to temporary declines. However, the character of the market seems to be shifting, and a major breakout has just occurred that we need to talk about.
🚀 A Tale of Two Patterns: Triangles and VCPs
If you look closely at the price action, a story unfolds. For months, Nifty was constrained by a sloping trendline, getting rejected from it on two separate occasions. At the same time, the price was carving out a series of higher lows. This convergence of a flat top (the trendline resistance) and rising bottoms formed a classic ascending triangle pattern—a sign of building bullish pressure.
What makes this setup even more compelling is the subtle pattern within the pattern: a Volatility Contraction Pattern (VCP). Notice how after each minor decline, the pullbacks became shallower. This "drying up" of selling pressure is a textbook sign that sellers are losing control and the big players are accumulating positions. The formation of this VCP right before the breakout was a strong hint that the subsequent move could be powerful and decisive.
Yesterday, we witnessed the culmination of this battle. The price broke out of the triangle and shattered the downward-sloping trendline with significant momentum, slicing through previously tested supply zones. This is a clear victory for the bulls in the short to medium term.
What's Next? Navigating the Path Ahead 🎯
Now for the million-dollar question: where do we go from here? The breakout is strong, but the path ahead isn't without its obstacles.
The Immediate Hurdle: Price is currently pushing into a fresh supply zone . This is the first significant test for the bulls post-breakout. We should anticipate some friction here as sellers who were waiting at these levels might try to defend their territory. This could lead to a bit of consolidation or a minor pullback, which is perfectly healthy.
The Ultimate Test: If the momentum continues and buyers overwhelm the sellers at the current zone, the next major target comes into view. This upper supply zone is particularly critical because it coincides with the All-Time High (ATH). The ATH is not just a technical level; it's a major psychological barrier where many traders may look to book profits. A rejection from this all-important zone is a high probability, given its significance.
In the upcoming sessions, we'll be watching closely to see how the price behaves at these key levels. The strength of the current momentum suggests that the immediate supply zone could be overcome, but the real test awaits at the peak.
Lastly, Thank you for your support, your likes & comments. Feel free to ask if you have questions.
The goal of a successful trader is to make the best trades. Money is secondary.
Disclaimer: Please note that this analysis is purely for educational purposes and should not be considered as a trading or investment recommendation. I am not a SEBI registered Analyst. Always conduct your own research and consult with a financial advisor before making any investment decisions.

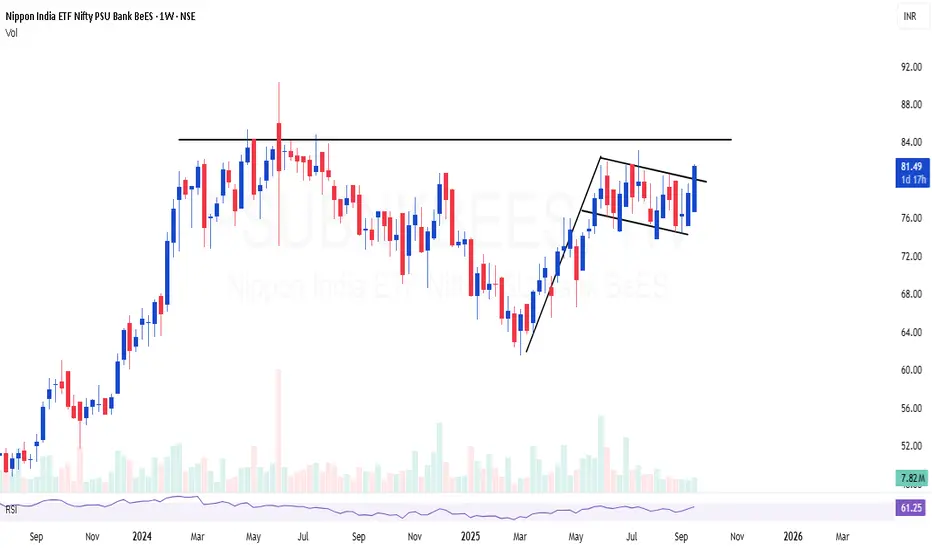
PSUBNKBEES | Excellent consolidation and flag formationPSUBNKBEES | Excellent consolidation and flag formation
Relatively safe bet on PSU Bank index, looks good for 30-40%
WCIL: Bullish Momentum After Demand Zone ReboundFollowing a rebound from a key demand zone in April, the price action of WCIL has entered a bullish trend, which is visually supported by an upward-sloping trendline on the chart. This trendline reflects a series of higher lows and higher highs, indicating sustained buying interest and positive momentum.
Between June and mid-August, the stock entered a consolidation phase, moving sideways within a defined range. Despite the pause in upward movement, the price continued to form higher lows and higher highs, which can be interpreted as a sign of accumulation rather than distribution.
Last week, the stock retraced to a previous higher high zone and managed to rebound once again, reinforcing the continuation of the bullish structure. This behaviour suggests that buyers are defending key levels and maintaining control of the trend.
From a momentum standpoint, the RSI on the daily chart is currently at 70, indicating that the stock is in the overbought zone. However, RSI readings in this range during strong uptrends can also suggest continued strength, especially if supported by volume.
Speaking of volume, there has been a noticeable increase in trading activity during the recent uptrend, which adds further confirmation to the bullish sentiment observed on the chart.
Based on this technical structure, the next potential long-term resistance level is identified near ₹171 , while a technical stop-loss level could be considered at a daily close below ₹103 , which aligns with a key support zone and trendline structure.
Disclaimer: This analysis is intended solely for educational and informational purposes. It does not constitute investment advice or a recommendation to buy, sell, or hold any financial instrument. Market conditions are dynamic, and trading decisions should be made based on individual research, risk tolerance, and consultation with a licensed financial advisor.

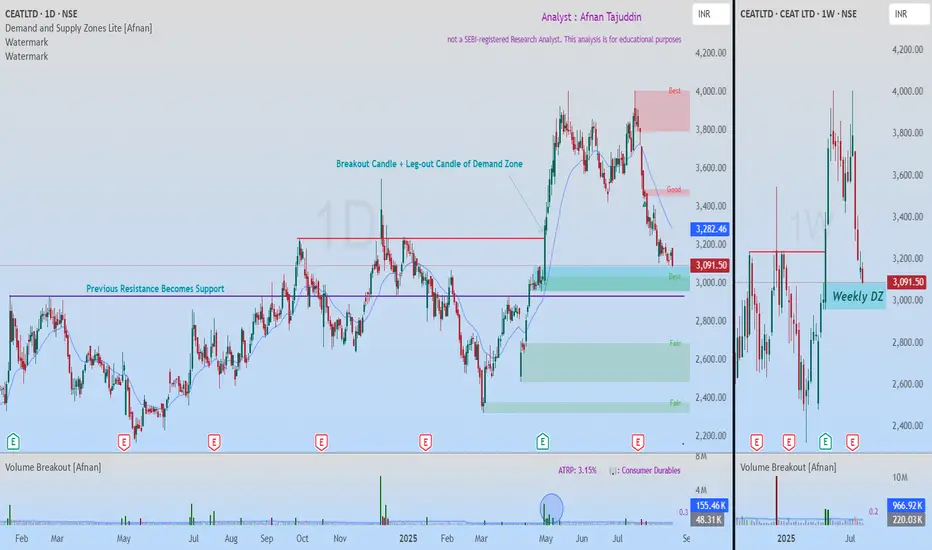
Smart Money Footprint Visible: Ceat Testing Powerful Demand ZoneBack on 24th July , I shared an idea on Ceat. That call didn’t play out and the Stop Loss (SL) got hit . No surprises there—SLs are simply the cost of doing business in this market. hitting SL is part of trading . The key is discipline – once SL is hit, we must exit without hesitation.
Now, Ceat seems to be offering us another opportunity . Let’s break it down.
📊 Why This Demand Zone Stands Out
The stock is approaching a very strong demand zone visible clearly on the weekly & Daily timeframe .
The leg-out candle that created this demand zone was powerful – it broke past previous resistance with a strong bullish move .
Follow-through from that breakout candle even took the stock to all-time highs . This tells us it’s not just an ordinary zone but one with institutional footprints.
Institutions often leave behind pending buy orders in such zones, or they may look to accumulate more here to defend their earlier positions.
This level first acted as resistance , then flipped into support —a classic price-action rotation.
📉 Volume Behavior 📉
On the breakout candle, volume was massive. But now, as price is pulling back, we can see volume exhaustion . To me, that signals a lack of real selling pressure. When supply dries up, it leaves the door open for demand to kick back in.
🔎 Confluences Adding Strength 🔎
Weekly demand zone lining up with a daily demand zone .
Traditional support level overlapping at the same price area.
Volume analysis confirming lack of strong selling.
🎯 Trading Plan 🎯
SL should be placed just below the support level to manage risk.
First target should be the nearest supply zone .
Till first target, the Risk-to-Reward (RR) ratio is about 1:3 , which makes it attractive.
If SL gets hit, simply exit the trade . No second thoughts.
What I find compelling here is the overlap: weekly demand, daily demand, and a long-tested support line all converging. That kind of alignment doesn’t come around every day. The probability of a bounce looks strong—but at the end of the day, risk management is what separates setups from disasters .
“Trading is not about being right every time. It’s about managing risk smartly and surviving long enough to catch the big moves.”
💡 The market will always offer another opportunity—our job is to stay disciplined, manage risk, and be ready when it comes. 🚀📈
⚠️ This analysis is purely for educational purposes only and is not a trading or investment recommendation . I am not a SEBI registered analyst .
TEXRAIL: Breakout FocusTEXRAIL has recently exhibited a notable technical development on the daily chart. On Friday, 16 May , the stock completed a breakout from an inverted head and shoulders pattern, a formation often associated with potential trend reversals. The breakout occurred with a decisive close above the neckline, which had previously acted as a key level of resistance and had been tested multiple times, reinforcing its technical significance.
Following the breakout, the price action has respected the neckline as a new support level, with multiple successful retests and rebounds observed. As of today’s session, TEXRAIL has once again rebounded from a brief consolidation phase, accompanied by a substantial increase in trading volume—approximately 18M shares , significantly above its recent average. This surge in volume may indicate renewed interest and participation from market participants.
Momentum indicators are also aligning with the bullish structure. The Relative Strength Index (RSI) is currently approaching the 70 level , suggesting strong upward momentum, though it is nearing overbought territory. Additionally, the MACD histogram is showing signs of potential short-term consolidation or profit-taking, particularly as the price approaches a previously identified supply zone.
Looking ahead, the chart outlines three potential resistance levels that may act as intermediate targets or areas of interest for traders monitoring the trend. These levels are derived from historical price action and volume profile analysis.
📊 Please refer to the accompanying chart for a visual breakdown of the pattern, volume dynamics, and resistance zones.
Disclaimer:
The information provided in this analysis is intended solely for educational and informational purposes. It does not constitute investment advice, a recommendation, or an offer to buy or sell any securities. Always conduct your own research or consult with a qualified financial advisor before making any investment decisions.

Nifty Update: Key Supply Zone Test Ahead – Time to Book Partial On 27th February, I shared a detailed analysis explaining why Nifty was likely to take support from the Monthly Demand Zone .
At that time, the entire market was extremely bearish. FIIs were selling heavily, and most people believed that catching the bottom was impossible. But as demand and supply zone traders , we trusted the footprints of smart money—and as expected, Nifty took support exactly at that zone and reversed.
Today, Nifty is trading just below 5% of its all-time high . This shows the power of demand zones, which are not just random boxes but clear evidence of institutional activity.
Now, let's focus on the current market development .
📈 Nifty Nearing a Critical Supply Zone 📉
If you look at the chart, you'll see that Nifty is now approaching a Daily Supply Zone (Drop-Base-Drop) Which have strong follow-through, making this a strong resistance area .
In addition, I’ve marked a Weekly Supply Zone (Drop-Base-Rally) on the chart. Interestingly, the daily supply zone lies inside this weekly supply zone , creating a powerful confluence of resistance. This stacking of zones increases the probability of price facing rejection in this area.
📊 What Should Traders Do?
If you are holding profitable positions in stocks, this could be a good time to book partial profits .
Be prepared for a possible price rejection from the daily and weekly supply zone .
However, it’s not guaranteed that Nifty will fall from here. Price can also break through the zone, but as traders, capital protection comes first .
The most likely scenario is a small pullback , not a major fall. After the pullback, Nifty may resume its upward move.
Always focus on high-probability setups and manage your risk smartly.
📢 Conclusion:
Nifty is at a crucial supply zone cluster. A pullback is likely, so this could be a smart time to lock in some gains. Watch price action closely and adjust your strategy accordingly.
Lastly, Thank you for your support. Feel free to ask if you have questions.
“Trade what you see, not what you hear. The chart always whispers before the news screams.” 📊🔥
This analysis is purely for educational purposes and is not intended as a trading or investment recommendation. I am not a SEBI registered analyst.

Amazing swing trading idea in UPLI daily make educational content videos for swing / positional trading

Mastering the Intraday Sutra: An intraday trading strategyMastering the Intraday Sutra: A Professional Guide to Trading Indian Markets with Precision
(Adapting Globex Strategy-Inspired Concepts to India’s Unique Trading Hours)
Introduction
The Intraday Sutra strategy is a systematic approach designed for India’s equity/futures markets, inspired by the principles of identifying key price levels (similar to the Globex "high/low" concept) but tailored to India’s fixed trading hours (9:15 AM – 3:30 PM). This strategy leverages prior-day price action, supply-demand zones, and disciplined risk management to capitalize on intraday opportunities. Below, we break down its components for clarity and repeatability.
Strategy Overview
1. Core Instruments
Indices: All indices
Stocks: Nifty 50 constituents for alignment with index momentum
2. Ideal Time Frames
5-minute charts: For granular entry/exit precision.
15-minute charts: To filter noise and align with broader intraday trends.
Key Levels: Prior-Day High/Low & Supply-Demand Zones
1. Plotting Prior-Day High (PDH) and Prior-Day Low (PDL)
Purpose: These levels act as psychological benchmarks.
Method:
- Manually mark PDH/PDL on your chart.
- Use Trading View indicators (e.g., “Previous Day High-Low”) for automation.
2. Identifying Supply-Demand Zones
-Supply Zone:
- Formation: Rally → Base → Drop (RBD) or Drop → Base → Drop (DBD).
- Action: Potential sell zone; price often reverses downward here.
- Demand Zone:
- Formation: Drop → Base → Rally (DBR) or Rally → Base → Rally (RBR).
- Action: Potential buy zone; price often reverses upward here.
Zone Validation Rules:
1. Structure: The “base” (consolidation) must be ≤6 candles; the breakout must show ≥2 impulsive candles.
2. Freshness: Only trade untested zones (no prior price interaction).
3. Zone Merging: Combine overlapping zones or prioritize the one with the best risk-reward ratio.
Entry & Trade Triggers
1. Breakout Confirmation
Short Entry: Triggered when price breaks above prior-day high (PDH) and retests a fresh supply zone.
Long Entry: Triggered when price breaks below prior-day low (PDL) and retests a fresh demand zone.
2. Order Placement
Buy Limit Orders: Set at the demand zone’s proximal line
Sell Limit Orders: Set at the supply zone’s proximal line
Risk Management Framework
1. Stop Loss Placement
Long Trades: Below the demand zone (mechanical rule) or 5% of the Daily Average True Range (ATR) below the distal line of demand
Short Trades: Above the supply zone (mechanical rule) or 5% of Daily ATR above the distal line of supply
2. Position Sizing
Risk ≤1-2% of capital per trade to preserve longevity.
Trade Management & Profit Targets
1. Initial Target: 2:1 Risk-Reward (2R).
Example: If risking ₹1000, target ₹2000 profit.
2. Trailing Stop : Move stop loss to breakeven at 2R, then trail for 3R+ using price structure (e.g., swing lows/highs).
3. Priority: Focus on “A+ Setups” where zones align with higher timeframes (for example a 5 mins zone within a 15 mins zone or higher)
Critical Success Factors
1. Timing is Everything
Optimal Entry Window: 9:15 AM – 11:00 AM (peak liquidity, institutional participation).
Avoid Late Trades: Post-2:00 PM entries often lack momentum for robust risk-reward outcomes.
2. Confluence with Higher Timeframes
- Strengthen signals by aligning 5/15-minute zones with hourly/daily support/resistance/supply/demand zones
3. Event-Driven Volatility
Capitalize on gaps from overnight global news (e.g., US Fed, crude oil prices) or domestic catalysts (RBI policies, earnings).
Tools & Execution
Charting: Trading View for automated PDH/PDL and zone plotting
Mindset: Discipline to avoid overtrading and stick to fresh zones.
Example: The example taken here is on the Nifty 15 mins chart. See how the price broke the previous day's low and reacted nicely from a prior higher quality demand zone. These levels can act as trap levels trapping most of the retail traders and investors on the opposite side of the trade. The price gave a nice bounce from the demand zone and went on to rally to the opposing supply zone giving a greater than 3:1 R:R.
Conclusion
The Intraday Sutra strategy combines technical precision with rigorous risk management, offering a structured way to navigate India’s time-bound markets. By focusing on prior-day extremes, fresh supply-demand zones, and strategic timing, traders can systematically exploit intraday inefficiencies. Remember: Consistency beats complexity. Back test rigorously, refine your process, and let discipline drive profitability.
Final Note: Always validate this strategy in a simulated environment before deploying live capital. Use Trading View Bar Replay functionality to test your strategy.
Markets evolve—stay adaptive!

GHCL Analysis: Supply & Demand Zones Strategy with Breakouts In this video, we analyze the NSE:GHCL chart using the Demand and Supply Zones Lite Indicator.
Watch as I explain how to:
Identify Stage 1, Stage 2 , and consolidation phases.
Spot breakouts and understand the concept of a flush .
Use demand zones nested inside resistance-turned-support areas to plan high-probability trades.
This video is perfect for anyone looking to improve their technical analysis skills and learn how to trade using demand and supply zones.
Disclaimer: This video is for educational purposes only. Always conduct your own analysis before making trading decisions."

IT SECTOR OVERVIEW: Super Bullish!Observation & Overview:
1. The IT Index was beaten down in late 2022.
2. After 2023 it formed a bottom and prices started gaining strength.
3. 2024 price started forming Higher Highs & Higher Lows, touched the previous 2022 ATH and currently, taking support from the 50% of the swing and also bouncing from a D tf demand.
4. It is acting as a major support zone and good weekly candle rejection can be noticed.
5. Signs of buyers getting dominant and it should break the ATH soon.
6. I'm expecting a minimum 15% ROI from this sector turnaround.
7. Hopefully, with sector rotation this sector is going to gain momentum eventually.
- Stay tuned for further insights, updates and trade safely!
- If you liked the analysis, don't forget to leave a comment and boost the post. Happy trading!
Disclaimer: This is NOT a buy/sell recommendation. This post is meant for learning purposes only. Please, do your due diligence before investing.
Thanks & Regards,
Anubrata Ray

ASIAN PAINTS - POSITIONAL SWING TRADE IDEA IN CASHSYMBOL - ASIANPAINT
Asian Paints is the largest home decor company in India. The 80+ year old company has major brands like Asian Paints, Berger, Apco etc. under its umbrella. The co. is into wall paints, wall coverings, waterproofing, texture painting, wall stickers, mechanized tools, adhesives, modular kitchens, sanitaryware, lightings, soft furnishings, and uPVC windows.
Asian Paints is currently trading between two major supply and demand zones since a long time. CMP of Asian paints is 2700 & It is approaching demand zone on weekly basis.
I'm seeing a positional trade opportunity on buy side. I usually trade in futures but this time I'm taking this trade in cash as general elections are due in June which is a major event for market makers.
Current PE of Asian paints is 46 which makes it a value buy at CMP. I'm investing 50% allocation today at CMP 2700. I'll invest 50% more at 2580-2600 levels & will hold this position with 2500 as SL. Targets I'm expecting on long side will be 2950 - 3220 - 3410 & new ATH. I'm ready to hold this trade for 3 - 6 months.
Disclaimer - Do not consider this as a buy/sell recommendation. I'm sharing my analysis & my trading position. You can track it for educational purposes. Thanks!

Adani Energy - Heavy Supp & Ress with 4 yr long Fibonacci SetupAnalysed the Adani Energy solutions on a weekly chart
there is a 4 year long gap to be filled - Fibonacci setup.
However from last 1 year, the price has been seeing a heavy resistance and support at the entry zone, which somehow makes the entire Fibonacci setup little week.
The coming week or two, may still see a downfall and hot the support level of 975-970, if continued, it may hit a second resistance of 955-950.
at this stage, the trend is also hanging towards more sellers keen to liquidate their positions. Hence this may drive the price downwards towards its support.
Once the price sustain the support level, price may hit its first sub resistance of 1190. It may also continue to hit its second main resistance level of 1265
I shall keep updating the weekly analysis.

BITCOIN HEADED TO 50K ? - CRASH SOON ?Symbol - BTCUSD
CMP 60700
Bitcoin is testing the previous major liquidity area which is around 59300 - 61000. Earlier it was consolidating around 65K levels & was trading in a range. Now it is witnessing a huge profit booking and declining sharply towards the liquidity area. A retracement towards 62000 - 62500 is likely.
In any case, If it is breaking 59000 level and sustaining below it then it may directly head to 50-51K which is next major support.
A double top pattern is visible on larger time frame. Breakdown of this pattern will lead to trend change/reversal. Hence breakdown of the neckline & sustaining below it will activate this double top pattern & then it will definitely test 51K level & then may touch 45K levels too.
P.S. : I'm actively tracking BTCUSD to make long positions around this liquidity zone to play a retracement & then I'll be looking to short around 62K levels with small SL & will add more position on breakdown of liquidity zone/neckline.

DOLATALGO - STOCK GAVE A BREAKOUT & THEN RETRACED TO MA Hi All,
This idea is about Dolat Algotech Ltd
On the weekly chart stock gave a healthy breakout & then retraced to nearest 10 SMA Moving average for few weeks. Now it is ready to move with a gap up weekly opening. Good volumes indicate that price action will continue to move upside
Stock is trading at PE of 15 and is expected to give good results.
Continuous uptrend in sales/profit
About the company:
Dolat Algotech Ltd is a trading cum clearing member of NSE India and carries on the business of securities broking and securities trading.
Happy Investing,
Thanks,
Stock-n-Shine

NATCOPHARM - CUP AND HANDLE FORMATION (BO FROM SUPPLY ZONE)Hi All,
This idea is about Natco Pharma
Fundamentals
Market Cap - 21712 Cr
Stock PE - 15
ROE - 25.9%
ROCE - 30%
Promoter Holding - 49.7
Quick Ratio - 3.42
D/E - 0.06
NATCO Pharma Limited (NATCO) is a vertically integrated, research and development focused pharmaceutical company engaged in developing, manufacturing, and marketing complex products for niche therapeutic areas.
Technicals
Since May 21, NATCO has formed a complete CUP and HANDLE formation on weekly chart and has now sustained the breakout for over 2 weeks. The earlier supply zone is now acting as demand zone indicating positive price action.
This is for mid/long term investors only
Hope you enjoy the idea,
Happy Trading,
Thanks,
Stock-n-Shine

ALEMBICLTD - WEEKLY CHART WITH CUP AND HANDLE BREAKOUTHi All,
This idea is about Alembic Ltd
Alembic Limited is engaged in the businesses of Pharmaceuticals, Real Estate, and Power Assets.
Fundamentals:
Market Cap ₹ 3,087 Cr.
Current Price ₹ 120
High / Low ₹ 122 / 72.2
Stock P/E 11.5
Book Value ₹ 85.1
ROCE 4.86 %
ROE 12.6 %
Equity capital ₹ 51.4 Cr.
EPS ₹ 10.5
Promoter holding 70.9 %
Market Cap to Sales 19.6
Sales growth 23.8 %
Technicals
As can be seen in the weekly chart of Alembic Ltd, if the price crosses 123 resistance it has an upside of 13% before meeting TOP RESISTANCE. Beyond that the stock will venture into uncharted territory of making ATH
Trade should not be taken before the price close above MAJOR RESISTANCE
Cup and handle formation with trend line resistance
Happy Trading,
Thanks,
Stock-n-Shine

WILL BUY THE DIP SUPPORT BULLS & CAN BTC RECOVER TO 71K ?Earlier I discussed about double top pattern in making & captured the great free fall of more than 7,000 points.
Now, Bitcoin can be seen taking support at important levels. Bitcoin is experiencing times of high fear, high volatility and negative sentiment among the traders. From a psychological point of view, this could end in a bullish momentum as I have seen in the past that such high volatility usually lead to trend reversal.
For now, big buyers are actively holding back a possible fall amid transfers of the previously hacked crypto exchange to its debtors and BTC sell-offs by German authorities.
In April, the average cost of BTC mining among the largest public miners was $53,000, technically, the level of average cost of BTC mining plays the role of an intermediate bottom.
Judging by the growth of volumes and price entry into the area of the lower boundary of the "Flag or Megaphone" pattern, buyers appear on the market and at the moment stop the price fall, forming a sideways range of 53500-58500.
Accordingly, a breakdown of one of the boundaries may trigger an impulse to one side or the other, based on the technical nuances there is a probability that there will be an attempt to break the resistance.
Fundamentally, the environment is difficult due to news flow, but investors are waiting for the approval of ETH-ETF, which may bring back the bullish mood to the market (indirect impact on BTC). Technically, the emphasis is on the range. A break of 58500 will give bullish momentum, a break of 53500 may allow the price to decline to the 50500-51000 risk zone
We can only analyze and make a trading decision but only the time will tell whether is it headed to 71K or below 50K.

ANTONY WASTE - RISING WEDGE FOLLOWED BY FALLING WEDGE (BO)Hi All,
This idea is about Antony Waste Handling Cell Ltd
Fundamentals
Market Cap - 1419 Cr
Stock PE - 16.5
ROE - 16.3
ROCE - 13.9
Promoter Stake - 46.1
Quick Ratio - 1.3
D/E - 0.78
Antony Waste Handling Cell Ltd is engaged in the business of mechanical power sweeping of roads, collection and transportation of waste, waste to energy project and undertake the designing, construction, operation and maintenance of the integrated waste management facility in Kanjurmarg, Mumbai.
Technicals
Since June 23, the price action followed a rising wedge & then the pattern changed to falling wedge since Feb 24. With the Daily price action it seems to be coming out of falling wedge formation & developing a new pattern
Immediate targets are marked as T1 and T2. Would suggest the price to rise atleast 3% post closing to confirm the continuation.
Happy Trading,
Thanks,
Stock-n-Shine

SENCO - POST 20% CORRECTION, PA MIGHT REVERSE FRM BOTTOM CHANNELHi All,
This idea is about Senco Gold Ltd
The stock has corrected over 20% in this month alone & now have reached the lower channel of rising wedge formation. Volumes have dried up indicating the supply may have exhausted & Price action might soon reverse from this point
Stock can be bought if it gives a closing above 980 for further targets of T1 1010, T2 1070, T3 1150.
If the stock shows further downside then the support levels are S1 916, S2 864
The correction is due to poor quaterly results owing to heat wave, elections, and fewer wedding days although the sales was up 9% YoY
Fundamentals
Market Cap
₹ 7,398 Cr.
Current Price
₹ 952
High / Low
₹ 1,177 / 365
Stock P/E
39.2
Book Value
₹ 177
Dividend Yield
0.11 %
ROCE
13.4 %
ROE
16.2 %
Face Value
₹ 10.0
Equity capital
₹ 77.7 Cr.
No. Eq. Shares
7.77
EPS
₹ 24.3
Promoter holding
68.4 %
Change in Prom Hold
-0.01 %
Chg in Prom Hold 3Yr
%
Pledged percentage
0.00 %
Market Cap to Sales
1.41
Sales growth
28.3 %
PEG Ratio
1.92
EVEBITDA
20.3
Quick ratio
0.40
Trade receivables
₹ 64.4 Cr.
Sales
₹ 5,230 Cr.
Debt to equity
1.28
Price to book value
5.37
Free Cash Flow
₹ -324 Cr.
CMP / FCF
-42.4
Happy Trading,
Thanks,
Stock-n-Shine

RKEC - DOUBLE BOTTOM FORMATION WITH A BREAKOUTHi All,
THis idea is about RKEC Projects Ltd
Fundamentals
Mkt Cap - 308 Cr
Stock PE - 15
ROE - 12.5%
ROCE - 15.5%
Mkt Cap/Sale < 1
D/E - 0.83
Quick Ratio - 1.09
RKEC Projects Ltd is in the business of Civil and Defence Construction
Technical Analysis
As the chart depicts, the price went for a double bottom formation and give a contraction of more than 70% while forming both bottoms.
It has given a successful breakout and first resistance has been marked. This trade can continue till next results as it could give a surprise being in a sector which is having strong tail winds.
Happy Trading,
Thanks,
Stock-n-Shine
