BANKNIFTY (05-12-2025)
Please note this levels are for intraday trading only.
Soch Samajh ke 🐉
Technical Analysis of BankNifty
Support_and_resistance

Adani Enterprises Shares Jump After Fundraising - Chart AnalysisAdani Enterprises Limited – Technical Chart Analysis and Stock Update (November 2025)
Adani Enterprises shares surged by more than six percent today as investor sentiment turned positive following the company’s announcement of a massive Rs 24,930 crore rights issue.
This move marks the company’s biggest fundraising effort since its cancelled follow-on public offering (FPO) in 2023.
Over the last five years, Adani Enterprises has delivered a remarkable gain of more than 540 percent, reflecting strong growth across its infrastructure, energy, and renewable business segments.
The company continues to attract long-term investors due to its aggressive expansion strategy and focus on large-scale projects.
Technical View:
On the daily chart, Adani Enterprises is currently trading near Rs 2,484, showing a sharp upward recovery from its recent lows. The stock recently took support from the **Trend Line Support Zone** around Rs 2,350 – Rs 2,400 and has rebounded strongly with healthy volume.
The chart indicates a consolidation pattern between Support-1 (Rs 1,935 – Rs 2,013) and Resistance-1 (Rs 2,692 – Rs 2,769). A sustained move above Rs 2,770 could trigger further upside momentum toward the first target of Rs 2,990, as mentioned in the chart.
If the breakout above Resistance-1 is successful, the next key zones to watch will be Resistance-2 (Rs 3,252 – Rs 3,335) and Major Resistance (Rs 3,759 – Rs 3,914). These levels may act as potential profit-booking areas or supply zones in the short term.
On the downside, Support-1 remains a crucial base for the stock. Any closing below Rs 1,935 could invite weakness and may push the price toward the Major Support Zone near Rs 1,042 – Rs 1,159.
Pattern Observation:
Earlier this year, Adani Enterprises formed an upward channel pattern and later experienced a channel breakdown, leading to a corrective phase. However, the recent rebound from the lower trend line and today’s strong price action suggest renewed buying interest at lower levels.
The range between Support-1 and Resistance-1 currently acts as a consolidation zone , and a breakout from this zone could decide the next directional move for the stock.
Summary:
Current Market Price: Around Rs 2,484
Immediate Support: Rs 2,013 – Rs 1,935
Immediate Resistance: Rs 2,692 – Rs 2,769
Next Target (on breakout): Rs 2,990
Medium-Term Resistances: Rs 3,252 – Rs 3,914
Major Support: Rs 1,042 – Rs 1,159
Bias: Positive above Rs 2,770; neutral within the consolidation zone
Conclusion:
Adani Enterprises remains in focus after announcing its large-scale rights issue, signaling strong capital expansion plans.
From a technical perspective, the stock is trading near an important support trend line, and momentum indicators suggest potential strength if it sustains above Rs 2,770.
A breakout could open the path for a short-term rally, while strong supports below Rs 2,000 provide cushion for investors.

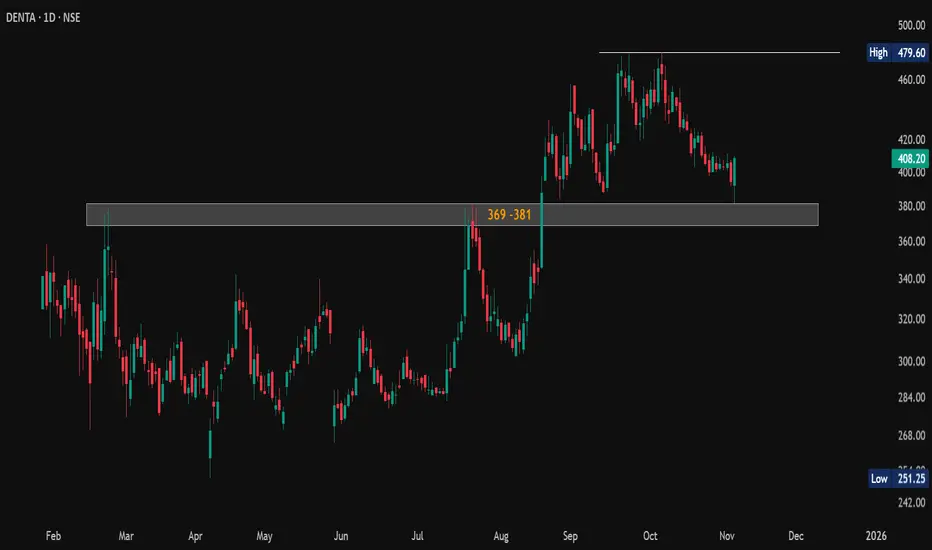
#DENTA Rebounds Strongly from Key Support!#DENTA (Denta Water & Infra Solutions Ltd.)
🔥 Strong bounce from key demand zone 369–381.
📉 Next support: 345–357 (WCB below 345 weakens setup).
📈 Previous resistance now acting as solid support.
💪 Trend intact above 345 (WCB).
🎯 Next resistance: 479–480.
Structure remains bullish — buy-on-dips setup in play! ⚡
#BreakoutRetest #PriceAction #Investing #TradingSetup #ChartAnalysis
📌 Disclaimer: This analysis is shared for educational purposes only. It is not a buy/sell recommendation. Please do your own research before making any trading decisions.
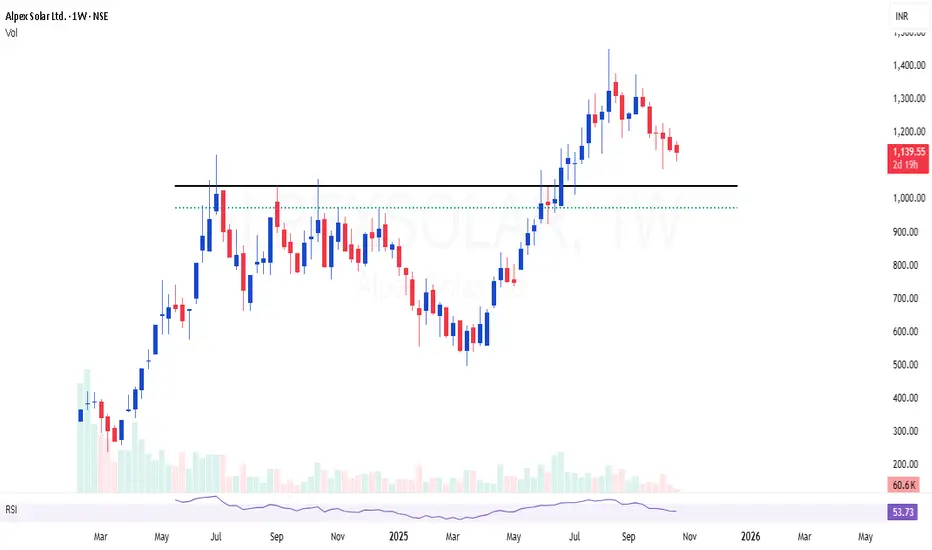
ALPEXSOLAR | Strong breakout and ready for next leg of rallyALPEXSOLAR | Strong breakout and ready for next leg of rally, Cash flow increasing
CMP : 1140
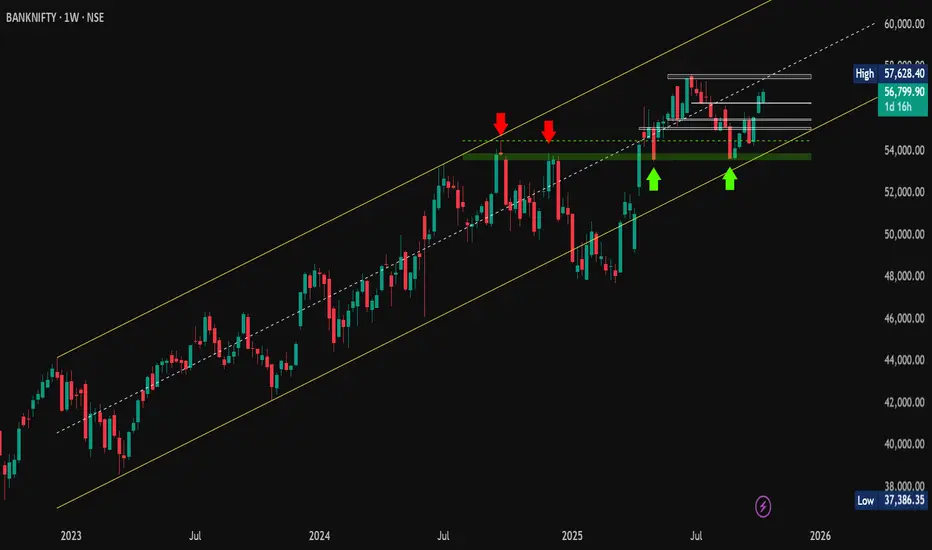
#BankNifty Update: Ready for a Breakout to New All-Time HighsAs per the updates shared on March 17 and May 15, 2025 , #BankNifty continued to hold firmly above the 100-week SMA , confirming its position in the #TrendReversalZone . The index decisively broke above previous swing highs and surged to a new all-time high of 57,628 .
Following this, it has once again retested the breakout zone (green zone) , a classic resistance-turned-support area, and is now bouncing higher. This successful retest, signals strength for the next leg up.
Looking ahead, #BankNifty appears ready to surpass its previous ATH, with key support zones at 56,250 – 56,283 and 55,527 – 55,459 . As long as the green zone levels hold, the bullish structure remains intact, with potential upside targets at 58,900 and 62,400 .
📌 Disclaimer: This analysis is shared for educational purposes only. It is not a buy/sell recommendation. Please do your own research before making any trading decisions.
#BankNifty | #BullishTrend | #AllTimeHigh | #TechnicalAnalysis | #PriceAction
GBPCHF – Could This Be the Start of a Bullish Comeback?Looking at GBPCHF right now, it feels like the market is finally speaking my language.
After an extended downtrend, price has landed on a major support zone visible on the higher timeframes — a zone that’s been tested and respected multiple times before. We're now seeing early signs of rejection from that area, and I’m eyeing a potential move back up toward 1.1000.
What makes this setup stand out isn’t just the technicals — it’s the patience behind the play. I waited for the sell-off to complete, for price to return to a proven zone, and now I’m watching for signs of strength to kick in. This type of setup? I’ve seen it play out time and time again in my previous chart work.
Drop your thoughts in the comments — do you see the same potential, or are you taking a different side of the trade?

BTCUSD-Eyes 120000 after Liquidity Sweep & Support RetestPrice action on the 15-min chart shows Bitcoin forming a potential bullish continuation after a liquidity sweep below short-term support. Here’s what stands out:
🔹 Triple Tap Support: Price respected a key zone multiple times, hinting at strong buyer interest.
🔹 Post-Sweep Reaction: Sharp recovery followed by consolidation suggests demand re-entered the market.
🔹 SignalPro Context: Leola Lens™ SignalPro highlighted key zones (yellow + orange), offering caution and trend context.
🔹 Projected Path: With price stabilizing above the reclaimed zone, potential upside target aligns with the 120000 region.
📌 Educational Note:
This setup highlights how liquidity collection below support and subsequent recovery can offer clues to short-term directional intent. Always manage risk based on volatility and session context.

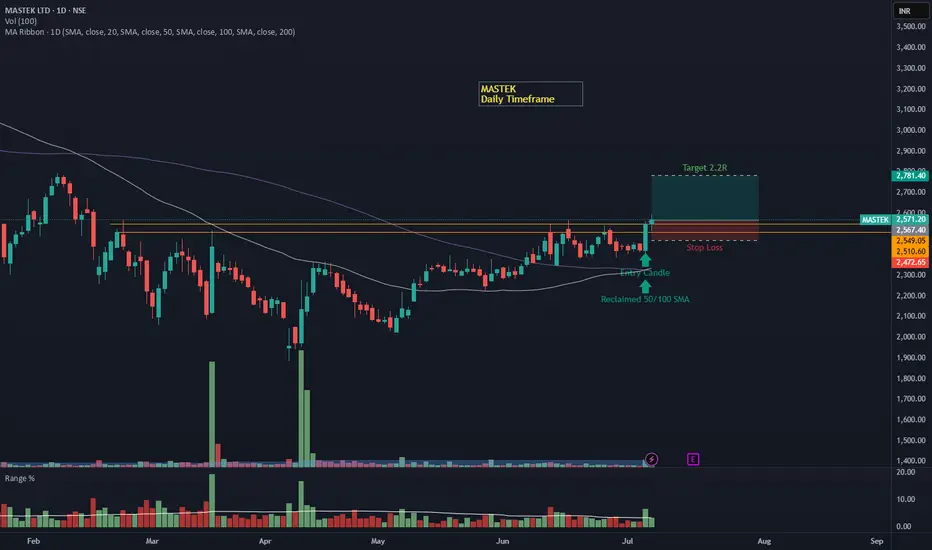
MASTEK – Daily Timeframe Breakout Idea (Resistance Zone Break)MASTEK has broken above a key resistance zone on the daily timeframe, backed by a strong bullish candle and a significant volume surge.
📌 Breakout Context:
The stock consolidated near the ₹2460–2480 zone for several sessions, forming a horizontal resistance zone.
On July 4th, the price broke out with strong bullish momentum, closing above the resistance with a wide-range green candle and a volume spike.
The breakout candle also closed above both 50- and 100-day Simple Moving Averages, confirming a bullish bias.
💡 Trade Setup:
Entry: ₹2550–2570 (near breakout)
Stop Loss: Below the breakout zone at ₹2472
Target: ₹2780+ (2.2R setup)
Risk-Reward: ~1:2.2 (ideal for swing trades)
🎯 Why This Setup Stands Out:
Volume on the breakout day is notably higher than average, confirming institutional interest.
Clean horizontal breakout from a multi-week range.
SMA structure is bullish, with the price reclaiming key MAs.
⚠️ Disclaimer: This post is for educational purposes only and not financial advice. Always consult your financial advisor before making trading decisions.
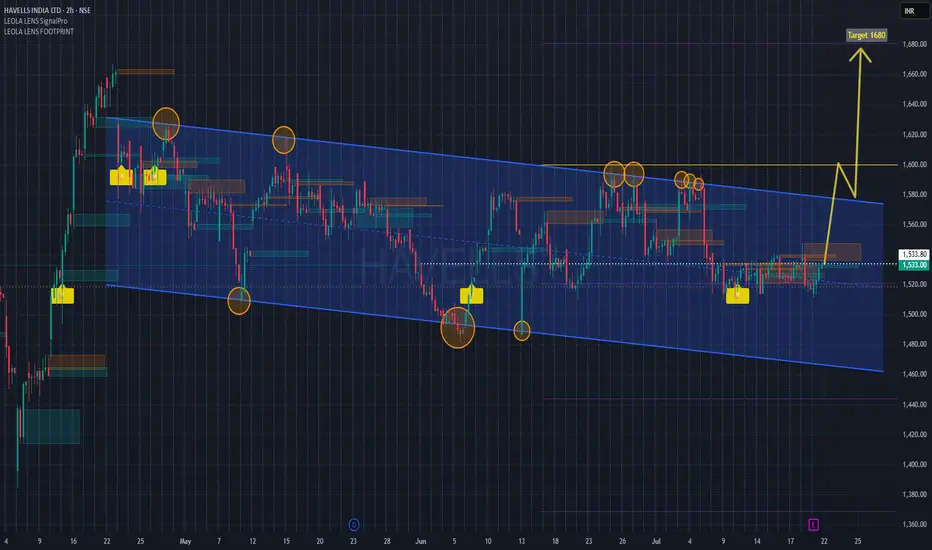
HAVELLS Channel Breakout Setup with Earnings Ahead Havells is approaching a crucial resistance trendline within a well-defined downward sloping channel. Price currently tests mid-channel and historical supply zones, with multiple Leola Lens SignalPro yellow caution labels plotted—historically seen before directional reversals.
📌 Structure Highlights:
Clear channel formation since April
Multiple resistance rejections near 1580 zone
Buy interest seen near lower boundary with SignalPro confirmation
Breakout projection suggests target zone near 1680, aligning with prior volume gap
📅 Earnings event likely to be a catalyst. Monitor price behavior post-results for potential breakout confirmation above 1580.
🧠 Leola Lens™ SignalPro Notes:
Yellow caution labels have repeatedly appeared near key turning points within the channel, suggesting possible trend transition zones. These zones highlight moments of institutional activity, where smart money behavior often shifts.
The yellow caution markers indicate potential trend change zones, based on historical conditions where price has shown institutional interest or liquidity shifts. These zones are not direct buy/sell signals, but highlight areas to monitor closely for structural confirmation.
🧠 This chart is intended for educational and structural analysis only. No financial advice.
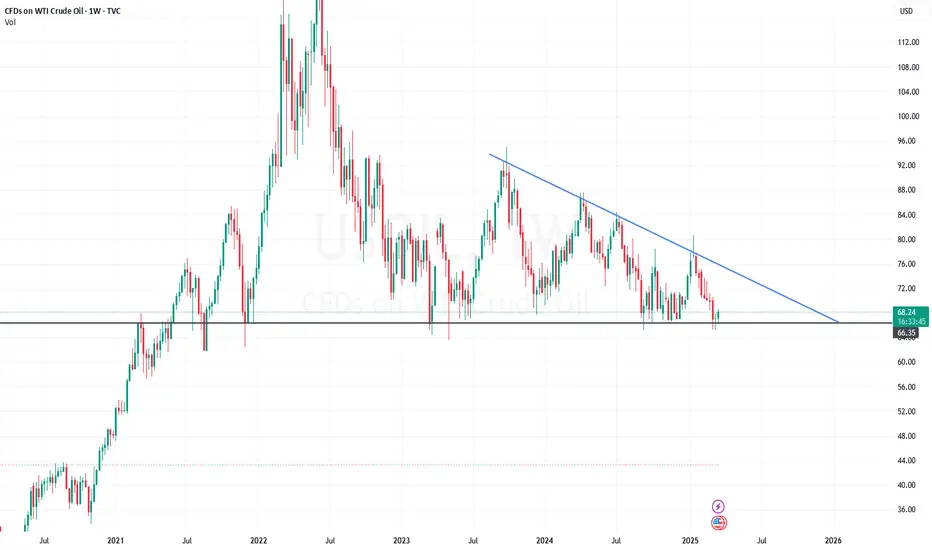
US OIL ALERTSo, I've been checking out the oil market, and it seems like US oil seems to have good support right now, with solid support below $66 and resistance around $75. It could be a good time to buy if you trade with a minimal stop loss. Check out the chart and see if it fits your risk appetite!
BLISSGVS Long Idea...BLISSGVS is consolidating in monthly chart. Taking trade after monthly confirmation (close above resistance) is good for safe trader
Personally I'm following it in daily charts to get a good early entry with some risk.
Lets see how it turns.
NOTE: NO idea of comapny Fundamentals. Just a technical take. Should plan trade with proper risk management.

HINDALCO 10R probable trade set upThe short-term price action for Hindalco appears to be positive, with some bullish indicators:
The stock is trading above its 20-day Simple Moving Average (SMA) of 657.
The price is in the upper range of the Bollinger Bands, suggesting strong momentum.
The MACD has generated a buy signal, although it is initial and weak.
The CCI (Commodity Channel Index) has generated a strong buy signal.
However, there are also some cautionary signs:
The RSI is generating a sell signal in the short term.
Volume-based indicators are showing selling momentum.
Medium-term Outlook
The medium-term analysis reveals a more complex picture:
The stock is trading slightly above the 200-day Moving Average, around 6521.
The zone between 652-620 is considered a crucial demand area.
The RSI on the daily timeframe shows early signs of reversal, suggesting potential bullish momentum.
Key Levels to Watch
Resistance: A critical resistance level is identified near 715. Breaking above this level could negate the existing negative trend and confirm a reversal.
Support: The 652-620 range is an important support zone. Maintaining a position above this range is crucial to prevent further selling pressure1.
Options Data
The Put-Call Ratio (PCR) for various strike prices indicates:
For the 630 strike, the PCR is 3.58, suggesting more put options are being traded relative to call options.
Higher strike prices (710, 720, 750) show lower PCR values, indicating less bearish sentiment for those levels.

DBL long Idea.........Dilip Buildcon Ltd (DBL) looks good for me.
it broke downtrend trendline.
T1 & T2 are given in charts.
Daily Support can be considered as 50% exit, SL can be considered 100% exit.
Note: No idea about Fundamentals

RKFORGE - CLEAN BREAKOUT WITH VERY CLOSE 50/200 SMAA very positive breakout where all the moving averages converge & then expand.
1 Yr Breakout with strong sectoral tailwinds as all forging stocks doing well
Strong upsurge in Volume indicates sustained price action upside from the present levels
Supply and demand zones clearly marked in the chart with no extra indicators to cause any confusion.

HUHTAMAKI - 10 YEAR CLEAN BREAKOUT (WEEKLY CHART)Hi All,
This is about Huhtamaki India Ltd
Fundamentals:
Market Cap - 2959 Cr
Stock PE - 27
ROCE - 12.5%
ROE - 13%
Promoter Holding - 67%
EPS - 53
PEG - 0.83
Quick Ratio - 1.56
Debt to Equity - 0.22
Technicals:
10 year breakout on weekly chart with good volume support. Expanding moving averages after a tight consolidation
Should wait for today's closing before taking the trade
Hope you will enjoy the trade,
Happy Trading!
Thanks,
Stock-n-Shine

Key Technical Levels and Analysis for the Next few DaysI am sharing my analysis of key levels for these stocks. Please note that they may not be accurate, as I am still learning.

Key Technical Levels and Analysis for the Next few DaysI am sharing my analysis of key levels for these stocks. Please note that they may not be accurate, as I am still learning.

"RITES: A Fantastic Breakout with a Healthy Rounding Bottom.Technical Analysis:
RITES has been consolidating in a robust rounding bottom pattern, a structure widely recognized as a sign of healthy consolidation. The stock has spent approximately 4 months forming this pattern, indicating a strong foundation for a potential breakout.
Rounding Bottom Structure:
A rounding bottom is a bullish reversal pattern that signifies a transition from a downtrend to an uptrend. This pattern is characterized by a gradual price decline followed by a rounded bottom formation before the breakout. The fact that RITES has spent considerable time forming this structure suggests a solid foundation for a potential upswing.
Breakout Potential:
As of the current chart, RITES appears to be on the verge of breaking out from the rounding bottom pattern. A breakout above the resistance level could trigger a significant move to the upside. This breakout offers an excellent opportunity for swing traders looking to capitalize on potential upward momentum.
Key Points:
1. Rounding Bottom Formation: Indicates a healthy consolidation period.
2. Consolidation Period: The stock has spent around 4 months consolidating, strengthening the
pattern.
3. Breakout Signal: A breakout above the resistance level presents a potential entry point for
swing traders.
Trading involves risk, and it's crucial to conduct thorough research and risk management before making any trading decisions.
Note: This post is for educational purposes and not financial advice. Do your own research before making any investment decisions.

Swing trade opportunity in TCPLPACKSwing trade opportunity in TCPLPACK
Entry - 1333
Targets - 1478, 1595, & 1760
DISCLAIMER: I am not SEBI registered and the ideas posted are only for educational purpose. Always trade with proper STOPLOSS.

Swing Trading Opportunity in Sun PharmaOn the daily timeframe chart of Sun Pharmaceutical, the price is approaching a resistance zone that has been tested multiple times. As this resistance has been tested multiple times, it may be considered a weak resistance. If the price gives a strong breakout above this resistance zone, it could present a great opportunity to take a swing trade.
For entry, we can go long after a breakout of a strong bullish candle above the resistance zone. It is advisable to initially enter with half quantity, as most breakouts tend to fail. After the breakout, when the price pulls back to the flip zone to take support and then starts moving in the direction of the breakout, we can add the other half quantity. Sometimes, the price doesn't pull back, which is why we enter the trade with half quantity after the breakout candle closes.
Regarding the stop loss, we can keep it below the resistance zone with some buffer.
We can set the target near the all-time high, as it may provide a significant resistance level and a potential area of profit-taking for traders. However, it is important to note that we should also monitor the price action closely and adjust our target accordingly if we see any signs of weakness or reversal in the trend.
If you enjoyed this content, please consider giving it a like and following me for more updates on market analysis and trading strategies. Your support is greatly appreciated!

Swing trade opportunity in NOVARTINDSwing trade opportunity in NOVARTIND
Entry - 587.50
Targets - 640
DISCLAIMER: I am not SEBI registered and the ideas posted are only for educational purpose. Always trade with proper STOPLOSS.
NLong

ALKEM | Trendline breakout + Channel support | 25-30%ALKEM | Trendline breakout + Channel support - Trying to capture a 25-30%
CMP : 3155
SL : 2900
Target : 4000
1:3 risk reward setup

