NYKAA - Breakout from DTFNYKAA has resistance weakening on the Daily charts and has given a breakout with good volume.
The target of this pattern signals an upside potential of 10% from the current price level in the medium term.
The stock is trading above its 50- and 100-day simple moving averages (SMAs). The range is more than >1.2X, and the Volume is also >2X the average.
CMP- Rs. 108
Target Price- Rs228 ( 10% upside)
SL -202
Disclaimer: This is not a buy/sell recommendation. For educational purpose only. Kindly consult your financial advisor before entering a trade.
Supportandresistence

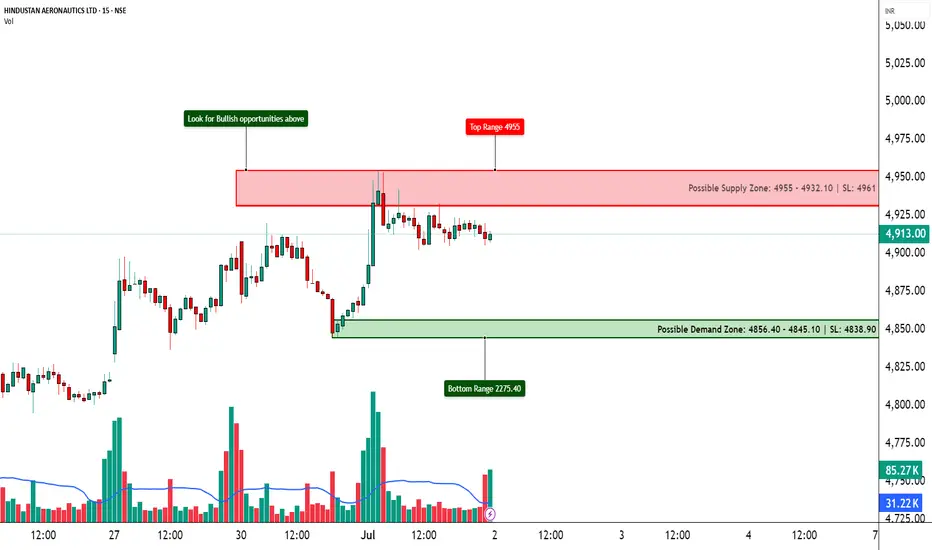
HAL – Ready for a Lift-Off?📈 HAL – Ready for a Lift-Off?
🔍 Bullish Action Heating Up | Option Chain + Price Action Analysis
Chart Type: 15-min / 1H / Daily
Indicators: STWP Zones, Volume, Demand-Supply, OI Analysis
🔹 What’s Catching Our Eye?
✅ Strong Long Build-Up at 5000, 5100 & 4950 Calls – Signs of institutional interest
✅ Short Covering at 4900 & 5200 CE – Shorts getting out = bullish continuation likely
✅ Highest OI at 5000 CE with +7.53% OI change = psychological breakout zone
✅ Spot Price at ₹4912 approaching key round-level resistance
✅ IV stable around 29.4%–29.7% → Room for volatility expansion if breakout happens
📊 What We’re Watching for:
📍 Breakout Zone: 4950–5000
📍 Targets: 5050 → 5100 → 5200
📍 Invalidation Below: 4850
📍 Momentum Confirmation: Sustained price close above 5000 with volume + OI surge
📍 Option Chain Bias: 5000 CE leading in build-up, supporting bullish sentiment
📌 Trade Plan (Educational Purpose Only):
🔹 Bullish: Buy above 4950 breakout with SL below 4850
🔹 Options: Consider 5000 or 5100 CE depending on your risk-reward
🔹 BTST/Positional Type: If price sustains above 4950–5000 with aggressive volumes
⚠️ Disclaimer:
This post is for educational and learning purposes only.
It does not constitute buy/sell advice or investment recommendation.
Always consult your financial advisor before taking any positions.
STWP is not liable for any financial decisions based on this content.
📚 “Smart money seems to be fueling the engines here.”
💬 Is HAL cleared for take-off above 5000? Or is it facing turbulence ahead?
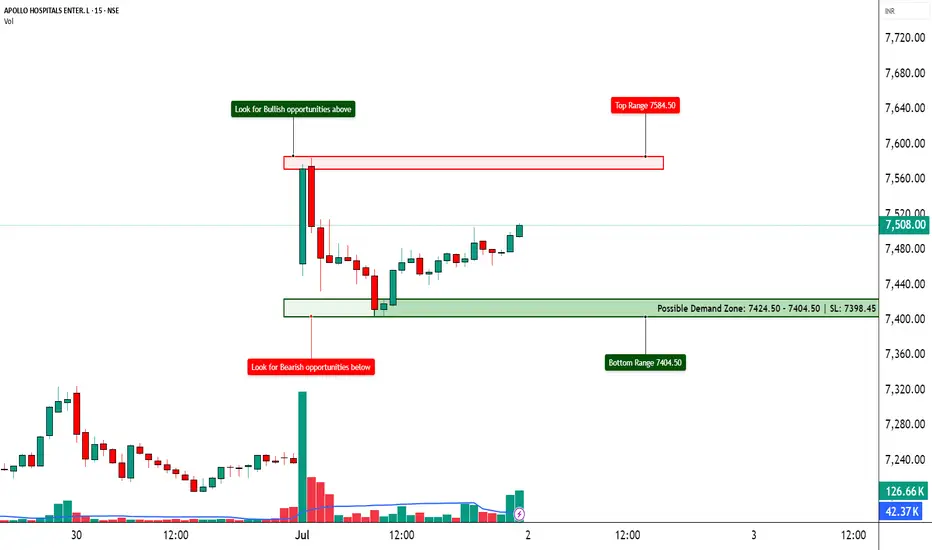
APOLLOHOSP – Preparing for the Next Breakout ?📈 APOLLOHOSP – Preparing for the Next Breakout?
🔍 Bullish Setup Unfolding | Option Chain + Price Action Analysis
Chart Type: 15-min / 1H / Daily
Indicators: STWP Zones, Volume, Demand-Supply, Price Action
🔹 What’s Catching Our Eye?
✅ Strong Long Build-Up across 7500–8000 Calls
✅ Heavy Put Writing at 7500, 7400, and even 7000
✅ Volatility Expansion + Rising OI = Possible Range Expansion Move
✅ Clean Demand Zone at 7400–7450 with a Morning Star Bounce (if visible)
✅ ATM Call (7500 CE) up 124% with +38% OI – Institutions possibly preparing for an up move!
📊 What We’re Watching for:
📍 Trigger Level: 7520–7550 Breakout
📍 Targets: 7600 → 7700 → 7800
📍 Invalidation Below: 7420
📍 Momentum Confirmation: Price closing above 7550 with volume spike
📍 Option Chain Support: 7000–7400 (Heavy PE writing)
📌 Trade Plan (Educational Purpose Only):
🔹 Bullish: Buy on breakout above 7550 with SL below 7440
🔹 Options: Consider 7600 or 7700 CE based on risk profile
🔹 BTST Type: If price holds 7500–7520 till close
⚠️ Disclaimer:
This post is for educational and learning purposes only.
It does not constitute buy/sell advice or investment recommendation.
Always consult your financial advisor before taking any positions.
STWP is not liable for any financial decisions based on this content.
📚 "Let Data Drive the Trade – Not Emotion!"
💬 What's your take on ApolloHosp? Bullish ride or trap zone?
Nifty on Radar, View for 25-JuneToday we got the same move as we discussed on yesterday. Now the price has broken the support of 126 but we have a hammer candle. For tomorrow the volatility could be high.
Disclaimer: This is my pre market analysis and my trading journal. Not a suggestion to buy or sell.

BANKNIFTY LEVELS 08/05/2023 BANKNIFTY ANALYSIS WITH LOGIC:
1. Considering this week levels if there's gap up in price on today intraday session, price should get reversal from 43070 level then we will short up to 42430 level with strong movement.
2. If there's gap down in price below 42430 level if there's any reversal at 42430 level with strong bearish 15m candle, then only we will short our positions up to 41960 level as our first target.
3. If price continues to move downwards, we continue to trail our positions till the level of 41140 as of second target.
4. If there's flat opening no trades shall be taken during first half intraday session.
Have a safe and profitable trading :)

Federal Bank - Support and ResistanceThe analysis is done on daily TF hence
price may take few days to few weeks
in order to reach the targets.
Trade setup is explained in image itself.
The above analysis is purely for
educational purpose. Traders must
do their own study & follow risk
management before entering into any
trade.
Checkout my other ideas to understand
how one can earn from stock markets
with simple trade setups. Feel Free
to comment below this or connect
with me for any query or suggestion
regarding this stock or Price Action
Analysis.

#Nifty 15Min #supportandresistence for 09/11/2022 #NIFTYFUTUREHi All, here I shared my view on #niftyfuture level for 09/11/2022 support and resistence . for educational purpose only, not for trade recommended.

MINDTREE MIGHT BREAK ITS RESISTANCE...ok so this one i thoroughly believe can be accurate and the price will eventually breakout, i just dont know when. it might take a while cause the price is already near the resistance and it might face it and drop down again, but we shall see...
Happy Trading !!!

GUJARAT ALKALIES breakout after 4 yearsGujarat Alkalies seen good volume activity and
breakout with volume from cup and handle pattern after 4 years
sustaining above 800 level will move towards 1200---1400 levels in short term
views are educational
