Canara Bank cmp 154.87 seen by the Monthly Chart view since listCanara Bank cmp 154.87 seen by the Monthly Chart view since listed
- Support Zone 129 to 142 Price Band
- Resistance Zone 155 to ATH 164.22 Price Band
- Bullish Cup and Handle Breakout done above Support Zone
- Stock Price ready for New ATH beyond current ATH 164.22 level
- Double Bullish patterns of Rounding Bottom inclusive of Cup and Handle
- Basis both Technical Chart patterns, the logical target price comes to +/- 300
Supportresistancelevels

Sai Life Sciences cmp 921.70 by the Daily Chart view since listeSai Life Sciences cmp 921.70 by the Daily Chart view since listed
- Support Zone 865 to 895 Price Band
- Resistance Zone 923 to ATH 943 Price Band
- Volumes are regularly spiking well above the average traded quantity
- Darvas Bos Setup seems like repeated basis the current technical chart setup
- Rising Price Channels are in good sync to each other at ending and fresh new start
- Considerate Bullish Rounding Bottoms and/or Rising VCP pattern, as one may interpret
- Darvas Box Setup : Stock trending within 845 to ATH 943 price band since ATH on 25-Aug-2025

IDBI Bank cmp 114.73 by Monthly Chart view - UpdateIDBI Bank cmp 114.73 by Monthly Chart view
* Support Zone 74 to 94 Price Band
* Resistance Zone 112 to 128 Price Band
* Bullish Head & Shoulders by Resistance Zone Neckline
* Stock headed for probable major breakout above 11 ½ years old price level of 116.40 done in June 2014

Bajaj Finance cmp 990.45 by Daily Chart viewBajaj Finance cmp 990.45 by Daily Chart view
- Support Zone 955 to 980 Price Band
- Resistance Zone 1005 to 1030 Price Band
- Bearish Head & Shoulders by neckline just above Support Zone
- IF ..... Support Zone brake then basis Bearish H&S downfall expected
- Support Zone tested, hoping it sustains, expect upside reversal by past data

RACL Geartech cmp 1169.20 by Daily Chart view since listedRACL Geartech cmp 1169.20 by Daily Chart view since listed
- Support Zone 1050 to 1125 Price Band
- Resistance Zone 1195 to 1245 >>> ATH 1347.80
- Volumes have spiked very heavily over past 2 days
- Strong Bullish Bottom formed around the Support Zone
- Resistance Zone Breakout attempts in the making process
- Falling and Rising Price Channels repeated since day of listing
- Majority of the Technical Indicators showing positive momentum

Medplus Health Services cmp 814.85 by Weekly Chart view since liMedplus Health Services cmp 814.85 by Weekly Chart view since listed
- Support Zone 720 to 780 Price Band
- Resistance Zone 865 to 915 Price Band
- Next Resistance Zone 975 to 1045 Price Band
- Stock Price unable to Break 2nd Resistance Zone
- Support Zone well tested retested on Daily Chart view
- Volumes need improvement been below the avg traded qty
- Bullish Rounding Bottoms retraced at 2nd Resistance Zone neckline

Nifty 50 spot 26042.30 by Daily Chart view - Weekly UpdateNifty 50 spot 26042.30 by Daily Chart view - Weekly Update
- Nifty has closed fairly above the Support Zone
- Support Zone steadfast at 25710 to 26010 for Nifty Index
- Resistance Zone grounded at 26200 to ATH 26325.80 for Nifty Index
- Volumes have fallen well below the average traded quantity thru the week
- Falling Resistance Trendline and the Resistance Zone rejection remain intact

Bank Nifty spot 59011.35 by Daily Chart view - Weekly UpdateBank Nifty spot 59011.35 by Daily Chart view - Weekly Update
- Bank Nifty has yet again closed within Support Zone range
- Support Zone been sustained at 58850 to 59375 for Bank Nifty
- Resistance Zone stands ground at 59825 to ATH 60114.30 for Bank Nifty
- Volumes have fallen well below the average traded quantity thru this week
- Falling Resistance Trendline still hovering on as Bank Nifty closed below trendline

RACL Geartech cmp 1185.10 by Weekly Chart viewRACL Geartech cmp 1185.10 by Weekly Chart view
- Support Zone 1005 to 1115 Price Band
- Resistance Zone 1265 to 1350 Price Band
- Rising Support Trendline seems taking positive trend
- Volumes more by selling post Resistance Zone rejection
- Bullish Cup & Handle inside probable Cup & Handle (hopefully)
- Support Zone Breakout attempts are seen in the making process

Blackbuck cmp 670.70 by Daily Chart viewBlackbuck cmp 670.70 by Daily Chart view
- Support Zone 625 to 643 Price Band
- Resistance Zone 670 to 694 Price Band
- Volumes in good sync with avg traded quantity
- Falling Resistance Trendline Breakout seem attempted
- Both of the Rising Support Trendline are well respected
- Bullish Rounding Bottoms under Resistance Zone neckline

NSDL cmp 1081.40 by Daily Chart viewNSDL cmp 1081.40 by Daily Chart view
- Support Zone 1040 to 1085 Price Band
- Resistance Zone 1135 to 1185 Price Band
- Bullish Triple Bottom at 1037 to 1049 Price Band
- Volumes flattish and under average traded quantity
- Price trending within Support Zone thru December 2025
- Falling Resistance Trendline Breakout seems taking process

Godawari Power GPIL cmp 250.50 by Daily Chart viewGodawari Power GPIL cmp 250.50 by Daily Chart view
* Support Zone 224 to 236 Price Band
* Resistance Zone 249 to 263 Price Band
* Support Zone tested retested since a month
* Volumes building up for Resistance Zone Breakout

CRISIL cmp 4322.10 by Weekly Chart viewCRISIL cmp 4322.10 by Weekly Chart view
- Support Zone 3960 to 4300 Price Band
- Resistance Zone 4600 to 4940 Price Band
- Support Zone tested retested for 3rd week now
- Rising Support Trendline seems to be well respected
- Volumes are keeping well above average traded quantity
- Continued Selling but Buying keeps Price above Support Band
- Price reversal from Support Zone maybe in making by Chart Status

Kross cmp 176.22 by Daily Chart view since listedKross cmp 176.22 by Daily Chart view since listed
- Support Zone 156 to 166 Price Band
- Resistance Zone 180 to 192 Price Band
- Volume attempting sync with avg traded qty
- Bullish Double Bottom "W" with Support Zone base
- Falling Resistance Trendline Breakout has well sustained
- Resistance Zone neckline acting as good hurdle for Breakout
- Majority of the Technical Indicators seen trending fairly positive

Kirloskar Brothers cmp 1647.20 by Daily Chart viewKirloskar Brothers cmp 1647.20 by Daily Chart view
- Support Zone 1510 to 1610 Price Band
- Resistance Zone 1760 to 1860 Price Band
- Support Zone tested retested over past 2 weeks
- Support Zone sustained thou price dipped below 3 times
- Volumes synced with avg traded qty with heavy spikes too
- Rising Support Trendline since May 2024 seems well respected

RVNL cmp 319.15 by Daily Chart viewRVNL cmp 319.15 by Daily Chart view
- Support Zone 294 to 306 Price Band
- Resistance Zone 332 to 345 Price Band
- Support Zone tested retested over past few days
- Support Zone since January 2025 seems been sustained
- Volumes below avg traded quantity, need to increase for fresh upside
- Breakout from Descending Triangle pattern might be in the making process

Nifty 50 spot 25966.40 by Daily Chart view - Weekly UpdateNifty 50 spot 25966.40 by Daily Chart view - Weekly Update
- Nifty has closed within Support Zone range upper end
- Support Zone remains steady at 25710 to 26010 for Nifty Index
- Resistance Zone stands firmly at 26200 to ATH 26325.80 for Nifty Index
- Volumes synced closely with avg traded quantity over the entire past weeks
- Falling Resistance Trendline Breakout in a steady making process by weekly closure

Bank Nifty spot 59069.20 by the Daily Chart view - Weekly UpdateBank Nifty spot 59069.20 by the Daily Chart view - Weekly Update
- Bank Nifty has closed within the Support Zone range
- Support Zone sustained at 58850 to 59375 for Bank Nifty
- Resistance Zone stands firmly at 59825 to ATH 60114.30 for Bank Nifty
- Volumes in close sync with avg traded quantity over with intermittent spikes
- Falling Resistance Trendline weighing hard for Bank Nifty has closed below trendline

IDFC First Bank cmp 83.79 by Weekly Chart viewIDFC First Bank cmp 83.79 by Weekly Chart view
- Support Zone 66 to 75 Price Band
- Resistance Zone 84 to 93 then ATH 100.70
- Bullish Cup and Handle setup made on the chart
- Falling Resistance Trendlines Breakouts well sustained
- Volumes are in close sync with the average traded quantity

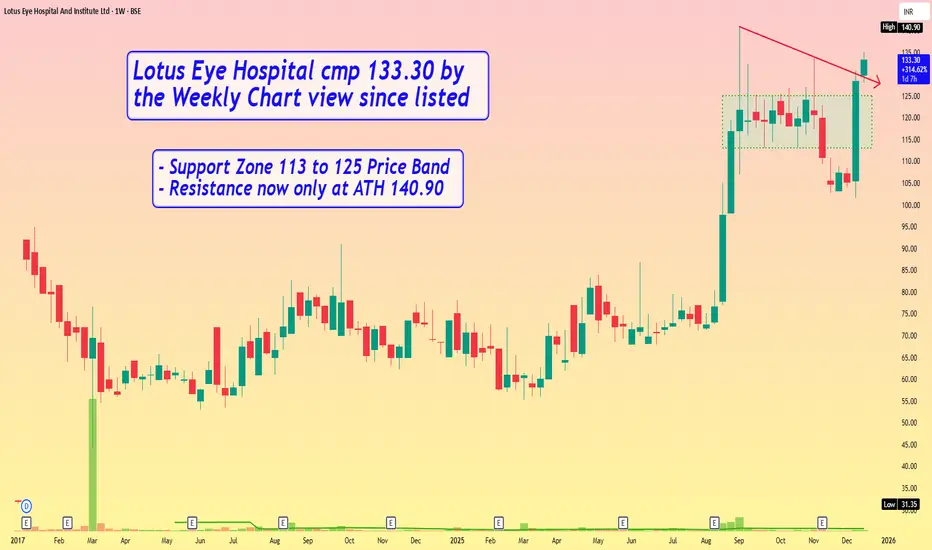
Lotus Eye Hospital cmp 133.30 by Weekly Chart view since listedLotus Eye Hospital cmp 133.30 by Weekly Chart view since listed
- Support Zone 113 to 125 Price Band
- Resistance now only at ATH 140.90
Belrise Inds cmp 157.70 by Daily Chart view since listedBelrise Inds cmp 157.70 by Daily Chart view since listed
- Support Zone 150 to 157 Price Band
- Resistance Zone 166.50 to ATH 172.68 Price Band
- Price traversing within Rising Price Channel since listed
- Volumes need to increase for sustained upside movement
- Support Zone been tested retested since mid of November 2025
- Bullish Rounding Bottoms retracing at Resistance Zone inclusive of ATH 172.68

IRIS Clothing cmp 35.66 by Weekly Chart viewIRIS Clothing cmp 35.66 by Weekly Chart view
- Support Zone 28 to 31 Price Band
- Resistance Zone 36.50 to ATH 40.71 Price Band
- Volumes above average traded quantity over past 2 weeks
- Darvas Box - Price trending between 30 to 35.50 since June 2025
- Long Bullish Rounding Bottom followed by small one's made within Darvas Box

Nifty 50 spot 26046.95 by the Daily Chart viewNifty 50 spot 26046.95 by the Daily Chart view
- Support Zone is intact at 25710 to 26010 for Nifty Index
- Resistance Zone stands stable at 26200 to ATH 26325.80 for Nifty Index
- Volumes keeping stable under average traded quantity over past few days
- Falling Resistance Trendline Breakout attempts seem in the making process
